Why self-similarity?
The distribution of oil field sizes is characterized by a few large
fields (the king, the queens, etc.) at one end and a large pool of
small fields at the other end. This pattern can be closely represented
by a self-similar process. To understand this, let's imagine that the
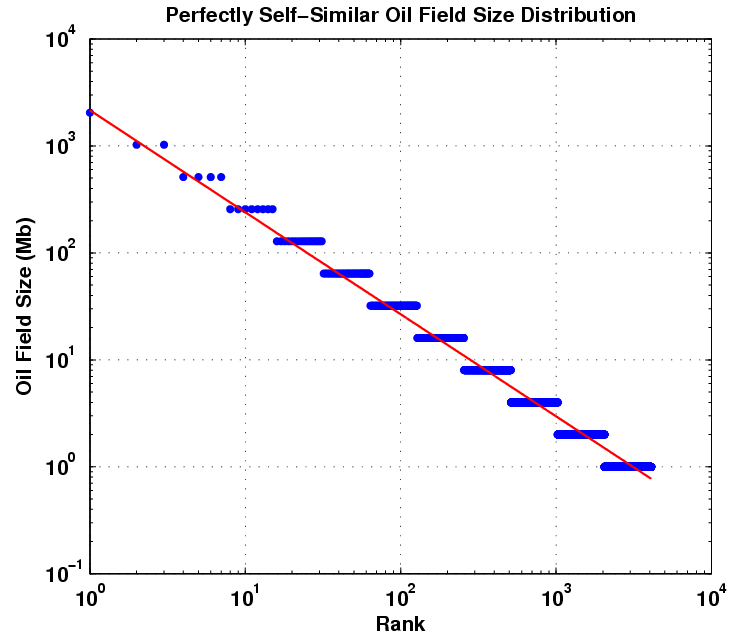
biggest field has a size of 2,024 Mb. The next fields in size will be 2
fields of size 1,024 Mb. Consequently, the self-similarity rule is to
multiply by two the number of fields at each stage and divide by two
their sizes. A convenient way to reveal the self-similarity law is to
display the log of the ranked field sizes versus the log-rank as shown
on
Fig. 1. If the process is
perfectly self-similar the points are distributed along a straight line
with
-1 slope value.

Fig. 1 Example of a simple self-similar object size
distribution represented in a log(rank)-log(size) plane. The red line
has a slope equals to -1.
The Parabolic
Fractal Law (PFL) is an unperfect self-similar law where a
quadratic term is added:
log(Size(i))= a + b.log(i) + c.log(i)^2
where
Size(i) is the size of the oil field of rank
i.
we call
c the PFL curvature. In case of perfect
self-similarity, we have
c=0 and
b=-1.
Jean Lahèrrere has estimated the curvature for the world
(excluding North America) and came up with the value
c=-0.1518/log(10)=-0.07.
Interestingly, we get also the same value for the UK oil fields (see
GraphOilogy
for details). Once the PFL parameters are estimated we can derive an
URR value by computing the area under the PFL curve given a small field
size cutoff:
URR= Sum_i(a + b.log(i) + c.log(i)^2)
with: a + b.log(i) + c.log(i)^2 > Size_Min
Application to Saudi Arabia
Unfortunately, there is no public database on Saudi Arabia oilfields.
We don't need to get an exhaustive dataset but only a few estimates
about the size of the largest fields. I found some data about the top 9
fields from various sources on the web and from Simmons's book
(Twilight in the Desert).
| Field |
URR (Gb) |
Discovery Date |
| Ghawar |
66-100 |
1938 |
| Safaniya |
21-36 |
1951 |
| Shaybah |
18-18 |
1969 |
| Manifah |
17-17 |
1957 |
| Berri |
10-25 |
1965 |
| Abqaiq |
10-15 |
1941 |
| Zuluf |
12.0-14.0 |
1965 |
| Qatif |
8.4 |
1965 |
| Abu Safah |
6.0 |
1969 |
Table I. Size estimates for Saudi Arabia Top 9 fields (src: IHS,
Simmons).
Because we have so little data, it will be difficult to
reliably estimate a valid parabolic curvature. So we proceed as
following:
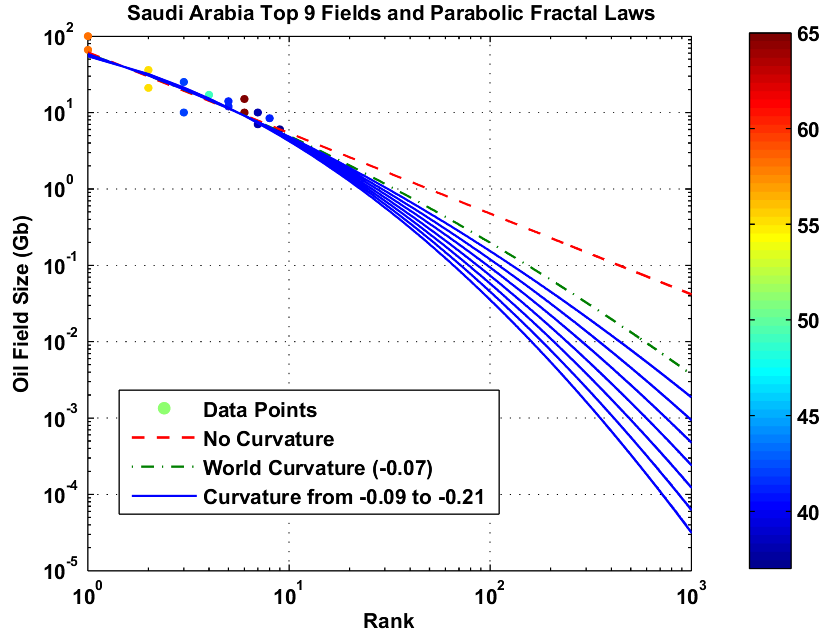
- The Field URR are ranked according to their size and
represented in a log(rank)-log(URR) plane as shown on Fig. 2. When only an interval is
available, we take the center value.
- a robust linear fit (no curvature) is applied on the data
points (red line on Fig. 2).
- A parabolic model is then fitted using the slope
established in 2) as first guess for the linear term b
and a fixed curvature value c (blue lines on Fig. 2). The algorithm used for this
step is the Levenberg-Marquardt
algorithm.
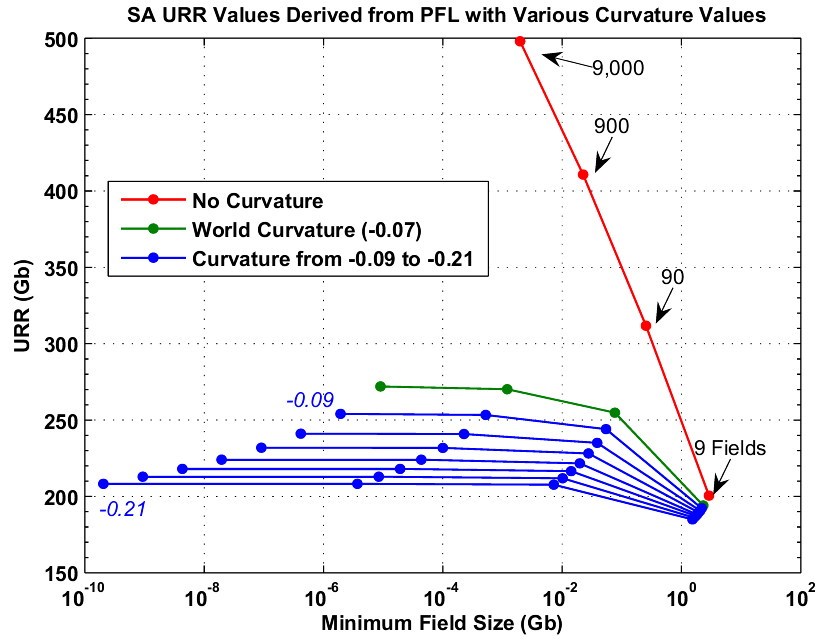
- The URR values are estimated from the areas under the PFL
curves conditionally to a particular minimum oil field size as shown on
Fig. 3.
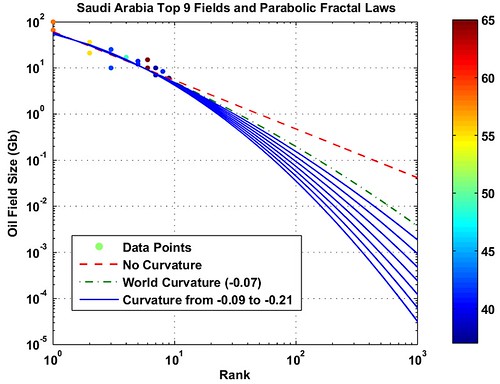
Fig. 2. Estimation of various PF Laws with different
fixed curvature values. Each data point is color coded according to the
oil field age.
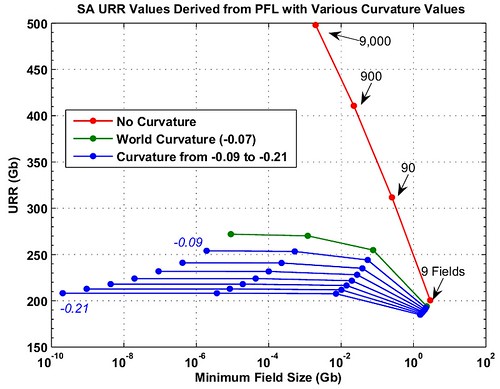
Fig. 3. Derived URR from the PFL shown on Fig 2. The URR value is function of
the minimum oil field size considered.
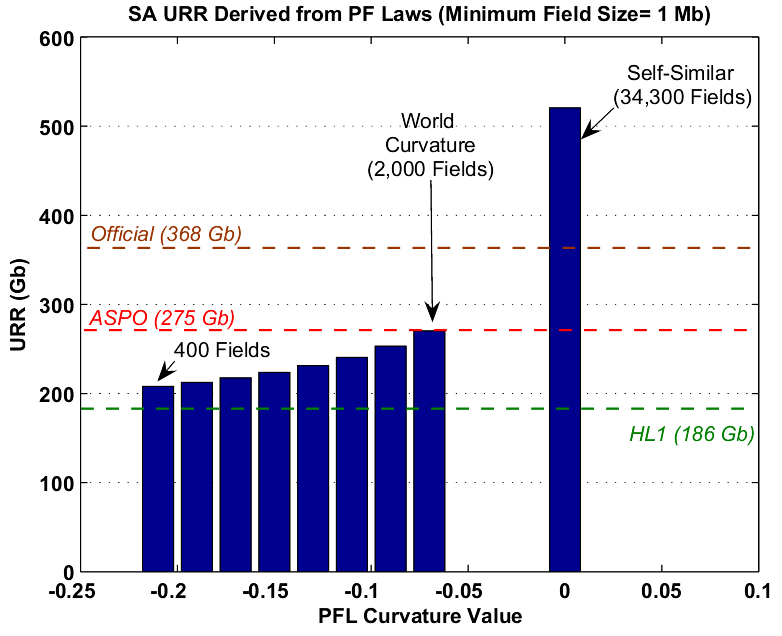
If we fix an arbitrary field size cutoff value at 1 Mb, we get the URR
values displayed on Fig. 4. We
can see that using the world curvature at -0.07 we
get an URR at 270 Gb from about 2,000 fields which is remarkably close
to the ASPO own estimate (275 Gb). The official URR at 368 Gb would
imply a curvature closer to zero around -0.025 with
also a much higher number of fields. We compare also with the estimated
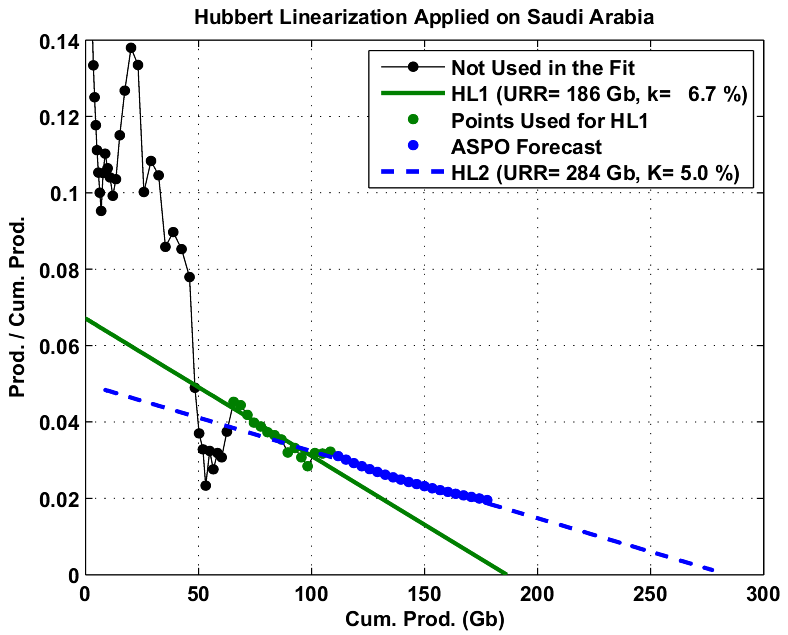
URR values we get using the Hubbert Linearization technique on the
production data (see Fig. 5).
The first fit (HL1) gives a rather low URR at 186 Gb which would imply
a strong curvature beyond -0.3 with a small number
of fields (< 400).

Fig. 4. Derived URR from Fig.
3 by fixing the minimum oil field size at 1 Mb. HL1 and HL2
are the URR estimate from two different Hubbert Linearizations shown on
Fig. 5.
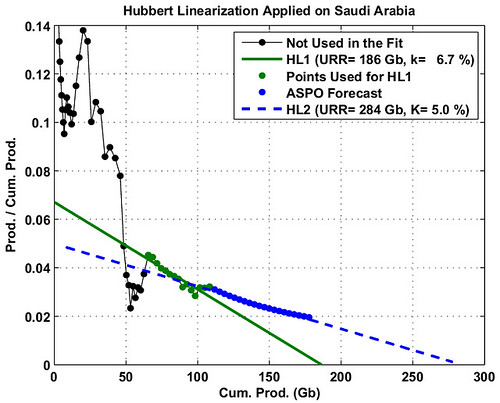
Fig. 5. Hubbert Linearizations on Saudi Arabia
Production profile (data from BP, Crude + NGL). The blue points are the
ASPO forecast which see a constant production level for the next 20
years at 9.5 mbpd (newsletter
66).
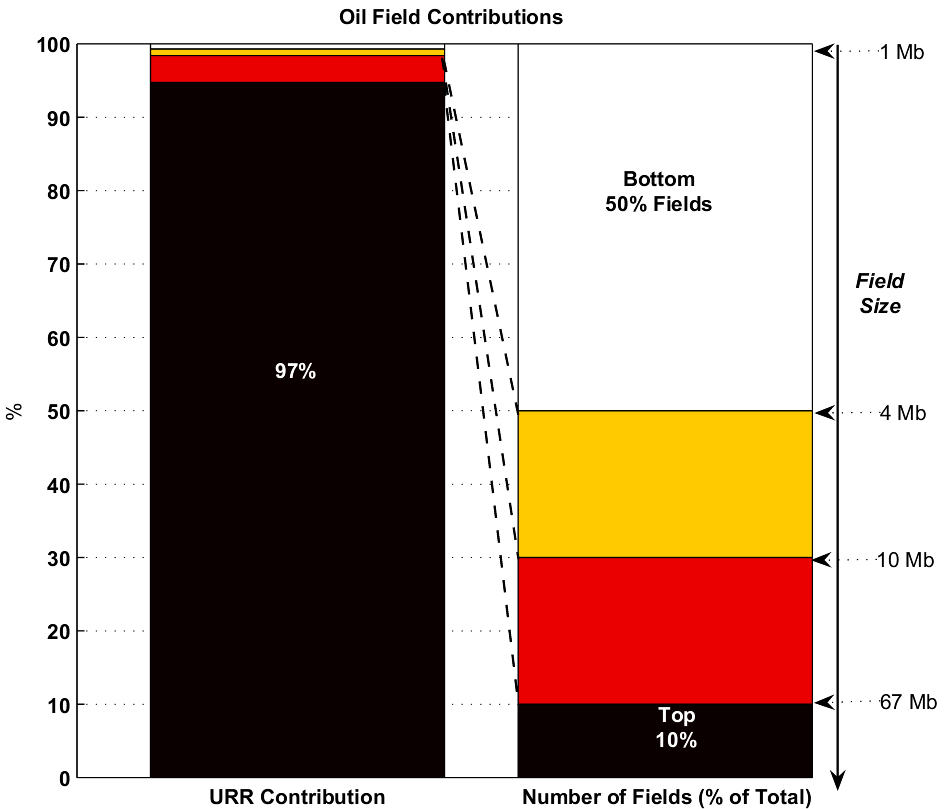
To further illustrate how hierarchical the oil production is, Fig. 6 gives the contribution of some
oil field groups ranked according to their size.
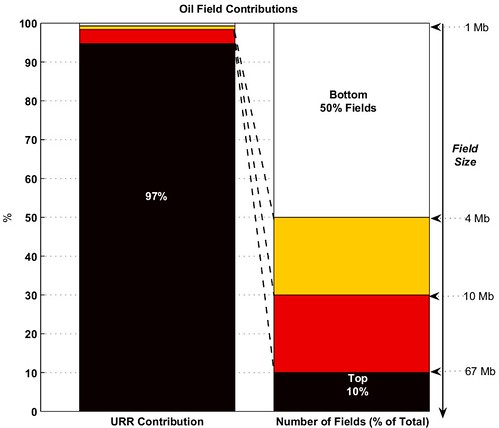
Fig. 6. Contributions from oil fields using the PFL
law for Saudi Arabia with the world curvature (green line on Fig. 2 and Fig.
3). The top 10% of oil fields (size > 67 Mb)
contributes to 97% of the total URR.
Discussion
The results are promising despite being based on partial and poor
quality data. In particular, I find intriguing that the PFL will lead
to a reasonable URR based on a curvature value derived from the world
and the UK datasets. The eventual universality of this curvature value (
c=-0.07)
could be confirmed on other datasets such as Norway and the US. It is
difficult to understand what is affecting the curvature value. My guess
is that the population of small fields is probably less exploited and
that less efficient recovery techniques are applied for obvious
reasons. A few observations:
- combined with the Hubbert Linearization technique, the PFL
could be useful for tortuous production profiles from immature
countries such as Saudi Arabia, Iraq and Iran.
- only the top fields are necessary for the fit which is
interesting because they are usually the most mature and the most
documented. However, we implicitly assume that the discovery of large
fields has peaked early in the production history and that no giant or
super-giants will be discovered.
- the PFL integrates naturally contributions from small
fields and the derived URR is dependent on the minimum field size.
Therefore, some reserve growth can be simulated by changing the small
field cutoff value.
Further readings:

A very good addition to your past work. We need new analytic techniques that are robust in the face of small data samples of dubious quality.
The technique clearly works to fit a curve, but which curve should we use? Deffeyes thinks that Hubbert himself played with multiple curves until he found one he liked. Heading Out and Westexas would know, but I assume that different geologic structures would have differing distributions of fields and sizes, and hence different curvatures. If so, we could apply the correct parameter based on the geology of a region to estimate its URR.
Some data for an additional play: Chris Skrebowski's October 2005 megaprojects review lists (by my count) 87 new projects that detail both reserves and expected peak flow rate. Since it's worldwide data, these fields ought to be self-similar.
Thanks for your continuing efforts.
The self-similarity principle states that a subset of fields belonging to a particular region (ex: the UK) behave like the whole (ex: the World). Now, because URR estimate is dependent on the recovery technique which is dependent on the field size, we will observe a deviation from the self-similarity.
Probably, but you need not only the new projects but also all the past projects comparable in size otherwise the ranking will be biased due to missing fields. Secondly, these new projects are in the giant-subgiant field category and are therefore harder to track because of their large number.
This is also a little bit explained over url=here[/url].
A critical point to keep in mind is the age of the top nine oil fields, especially Ghawar. The range in recoverable reserves for the top nine fields is from 168 Gb to 239 Gb. Reserve transparency is a huge issue for these fields, but there is a very useful analogy, the Yibal Field in Yemen. The sudden collapse in production from this field, about 80% over a five year period, was unforeseen by the Shell Oil Company, and they were reporting reserves under public company rules. Note that the same horizontal drilling techniques used at Yibal are being used at Ghawar and elsewhere. Using analogous fields, developed with similar techniques, my bet is on the lower number for the URR from the top nine fields in SA.
I assume that the PFL is an attempt to address the problem of undiscovered (presumably but not necessarily smaller) fields, since the HL technique just plots annual production as percentage of cumulative versus cumulative. If there is a large undiscovered field out there it won't show up in the plots. As some people have noted, the P/Q versus Q plots do tend to flatten with time. IMO, this is because we effectively never go to zero production in large producng areas and we do find large numbers of smaller fields, so the slope has to flatten with time. Historically, what have these smaller fields done for us? Using our two primary historical analogues--the US and Russia--have the smaller fields found post-peak brought production back up to its peak level? No.
As usual, there are two critical aspects--production and reserves. We face the same problem with unconventional reserves.
It is entirely probable that because of a lot of smaller fields, URR for SA will be between 186 and 274 Gb. The question is, will that have any effect on a near term peak? IMO, no. Again, just look at the ages of the top nine fields. Have we seen catastrophic declines in analogous fields, developed using similar techniques? Yes--Yibal and most recently, Cantarell. And the prior swing producer, Texas, peaked at the same HL point that SA is at now.
Look at the Saudis words versus their actions. They say that they are voluntarily cutting back their production, but they bringing in every rig that they can get their hands on. Again, we saw a similar--and futile--effort after Texas peaked in 1972. Also, note that it will be a huge logistical effort to bring swarms of smaller fields on line. And again, historically it has not worked to try to offset the declines from large old fields with smaller newer fields.
I do have one minor complaint--the UK as a model for large producing regions. I have been guilty of cherry picking myself--by separating the Lower 48 from Alaska, but look the timing of the development and the vast distance between the Lower 48 and Alaska. Neither of those factors is at play in the North Sea. IMO, I don't think that it makes much sense to use one portion of a producing province as a model for a very large producing province like SA or the world. The HL plot of the North Sea is one of the most perfect HL plots I have ever seen. It peaked at 52% of Qt, and it has been following the downward path ever since.
I do think that it makes sense to use Texas (the former swing producer) as a model for SA and to use the Lower 48 as a model for the world.
It'a key issue, uncertainty on the top fields has to be reduced.
yes, it's somewhat an orthogonal approach to Hubbert approach.
The PFL gives an upper bound on the URR value (crude oil only), it's very unprobable that we will reach it.
Agreed. Once you are in the tail portion of the PFL you get very small production increases despite huge investments.
UK is not a model, I just got the same curvature estimate as the world.
The HL method indicates that SA and the world are now about the same points at which Texas and the Lower 48 peaked--and coincidentally or not--recent reports indicate that SA and world production are both trending down.
It seems to me that the HL method is best for picking the timeframe for peak production, while the PFL method may be best for estimating ultimate URR, including all economically viable smaller fields, with some occasional large "surprises." However, historically nothing has brought production back to the peak level once a large producing region has declined in the vicinity of 50% of Qt.
Texas is still a very fascinating case history. We had the biggest drilling boom in state history in the Seventies to early Eighties, and we succeeded--we increased the number of producing wells by 14%. But the net decline in production--after the new wells were put on line--from 1972 to 1982 was 30%.
This is actually a variation of the argument that I have been making, to-wit, that I see permament boom times ahead for the energy industry--at least until we hit the net energy problem, which for some areas in the US may not be too far away.
In any case, vast sums of money will be spent, looking for and (in some cases) made producing smaller oil fields. (This is precisely what I am doing.) However, IMO it won't do anything to reduce the Saudi and world production declines.
The PFL does not need the production profiles but can give an interval of probable values for the URR based on the mature top fields. Preliminary results on Norway suggests a lower curvature value (around -0.35) so it's very possible that SA has also a lower curvature that could lower the resulting URR. More oil field data (at least the top 15 fields) could help refine the curvature estimate. If I'm not mistaken, SA production comes from the top 15 field which are believed to be very mature, the PFL is showing that this ubset of fields contains 90% of the URR. Once you have to developped smaller fields, it becomes very difficult to maintain an elevated production rate.
Anyway...
This point, made all the time by Westexas, seems to always be the 800 lb. gorrilla sitting in the room. In an empty world economic model this fact could conveniently be ignored as high prices would mean more oil could be discovered somewhere, if not in the mature fields themselves.
In a full-world model, however, with companies having scoured the earth for every last economically recoverable barrel, this fact just seems to sit there showing to all who want to look that geology eventually trumps the laws of supply and demand. Demand, no matter how high, cannot by itself create supply if the physical resources simply aren't there. This information about Texas is simply terrifying once you understand the implications. No wonder most people don't want to acknowledge it -- it really does call into question basic fundamental assumptions about our society and our way of life.
There is no somewhere else.
The only exception is when a product is rationed, as oil was in the US during the seventies and has been in China until recently. In this case, product disappear from the shelves (or pumps) and cannot be obtained by the non-priveledged at any legal price, thus bringing into being an illegal black market. China is now in the process of allowing prices to rise to world levels, which acted to ration liquid fuels, thus allowing demand/supply to increase.
Yes, and in the long-run we're all dead too. Thanks for your helpful economic lesson.
Supply and demand always balance? Wow. Did you also know E=MC^2 too? Your point is trivial. What's important is what equilibrium markets fall into.
Noting that 'supply and demand' always balance may be 'technically' correct in econo-speak, but that's cold comfort to individuals who will, in the future, likely face ever higer prices for a resource that is in ever shorter supply. Society at large is under the mistaken impression that absolute scarcity can be overcome simply with higer prices. Somehow the magic of the market will produce affordable alternatives all by itself. That this is not the case, as the record on Texas depletion aptly demonstrates, will come as a very rude shock to people who have been sold a bill of goods on how markets operate. That Texas has not once produced more than its 70s peak despite massive investment and never-before-seen prices is, quite simply, terrifying and the implications staggering.
No, you misunderstand what occured. What happend is that hoarded, untraceable, blackmarket supply has come out into the open. No additional 'real' supply has necessarily been created, it has merely come out of hiding as legal trading became more profitable than illegal trading. Overall 'real' supply only increases in this case if the shift from illegal to legal trading frees up productive resources that can then be allocated to the production of the good in question.
The notion that the "law" of supply and demand is a law like a law of nature is a joke. That supply always equals demand, is what a philosopher would call an analytic statement, and doesn't really tell us anything about the nature of reality at all.
This isn't verbal, this is math. Somebody will have to remind me whether it is transitive or associative. I only failed that quiz once, but I sure as hell have learned when it is an important since.
I'll read the parents now to see what an ass I just made of myself.
This is a time when I wish Sailorman was still posting. That guy could wrap something like this up in about 3 paragraphs and leave you begging for more. And the bibliography he could throw at you would put you out of your misery.
Where the Hell are you? If you've got better things to do, then at least say hi once in a while.
Of course when a product that is in short supply is NOT rationed, it can ONLY be obtained by the wealthy at a high price.
My reasoning is that only small independents can make money from smaller reservoirs. A 200,000 barrel field depleted over a 10 year period would make me rich with a small carried interest, but would not be worth setting pipe for anyone with large offices and specialists on the payroll. And I think this economic effect is magnified in countries without a domestic independent industry. Large companies won't even try to complete that kind of reservoir, and the size of the reservoir is pretty clearly deliniated with 3d seismic and 4d.
Secondly, the economics have changed completely because of accuracy of the new seismic. In the dark age before modern seismic, only about 1 wildcat well in 15 in a decent basin was an economic success. The new seismic has cut the dry hole percentage to about 4% and increased the economic success to about 66% in the US. There is also a huge infrastructure available in a mature area that cuts production costs that doesn't exist in other countries. For one example, does Saudi have any public water disposal wells? How about independent oil purchasers with trucks that will pick up from the tanks of a small oil field?
These factors (except for 3D) were all at work in Texas from 1972 to 1982, and we still had a 30% decline. My point is that small fields can be profitable, but they can't make up for the declines in production from larger fields. Texas has never shown a year over year increase since peaking in 1972.
In Texas in the seventy and eighties we could buy small lease blocks because they are controlled by the individual landowners. This isn't true overseas because the blocks are in large concessions. And I think the land ownership will determine whether an independent oil business will develop in a country.
Karl Marx was right about a lot of things. A society determines the nature of wealth by defining how it can be held and by whom. Unless the landowners are given their minerals, a situation I do not forsee, I think that small independents won't develop the smaller fields.They can't form.
.OTOH if a state owned oil company that had [shall we say} its "excrement aggregated" the threshold for a successful project should in economoic terms be lowered by both the the royalty owner's cut and the tax rate. All in all a whopping margin in favor or the state owned oil companies.
My honest opinion is that in the real world the bozos in charge of Saudi Aramco and its equivalents will prove vastly inferior to to the what you termed the "poor boys" who still exist in reaonsable numbers in Texas.
2004 NYT Article on Yibal:
http://www.peaceredding.org/Oman's%20Oil%20Yield%20Long%20in%20Decline,%20Shell%20Data%20Show.htm
April 8, 2004
Oman's Oil Yield Long in Decline, Shell Data Show
By JEFF GERTH and STEPHEN LABATON
Excerpt:
While Oman represents a small part of Shell's reserves, oil industry experts say the company's experience there highlights broader questions about the future role of Western oil companies and their technology in the Persian Gulf, which has most of the world's oil reserves.
In the case of the Yibal field, for example, Shell and Omani oil engineers and auditors have expressed concerns that a technique Sir Philip said would recover more oil not only did not do so, but also increased the amount of water in the extracted oil to as much as 90 percent of the total volume, increasing production costs.
"In Oman, Shell seems to have fumbled on technology," said Ali Morteza Samsam Bakhtiari, a senior official with the National Iranian Oil Company.
Perhaps more ominously for the world's oil outlook, he added that the failure of Shell's horizontal drilling technology in Oman suggested that even advanced extraction techniques "won't bring back the good old days."
The absolutely critical point to remember here is that the P/Q versus Q plot uses two knowns, annual production and cumulative production to date, to predict Qt. My understanding is that the PFL method gives us a range of possibilities, based on comparisons to other regions.
The other critical point to remember is that virtually all of the large Saudi fields are very, very old, with rising water cuts. The Yibal Field, right next door to SA, was redeveloped using the same techniques as Ghawar, and Yibal had an 80% decline rate over a five year period--which apparently shocked the hell out of Shell Oil. So, it's entirely posssible that the Saudis believed what they had been saying.
Also, I believe that large portions of SA are really not prospective.
I still don't think that it was a coincidence that the Saudi stock market crashed, just prior to the Saudis admitting to a production decline.
Consider the chain of events:
Simmons says that SA production may collapse.
Saudis deny Simmons' claims.
HL method supports Simmons' premise, and it indicates that SA is at the same point at which Texas started declining.
Saudi stock market crashes (apparently because of widespread selling by Saudi insiders).
Saudis admit to a 5% production decline. They claim it is voluntary, but the rig count has gone up by something like 400% over recent years.
Semi-Repetitive Comments Follow
At my request, Khebab took only the Lower 48 production data through 1970 and only the Russian production data through 1984, and he predicted post-1970 Lower 48 production and post-1984 Russian production (through 2004).
If you have studied Khebab's work, you can tell that he has no agenda. He is an objective scientist.
In any case, the actual cumulative post-1970 Lower 48 oil production was 99% of what the HL method predicted and the actual post-1984 Russian production was 95% of what the HL method predicted that it would be.
The HL plot for SA is pretty clear. Insofar as I know, no one has shown a Qt for SA of more than about 190 Gb. The Oil & Gas Journal published an estimate showing that SA is currently about 67% depleted.
SA will put new production on line, and probably a lot of it will be significant. However, I seriously doubt that anything they can do will offset the declines from the old large fields like Ghawar. Higher reserves? Probably. Higher production levels? Probably not.
By the way, you may recall that the recently leaked internal reserve estimate for Kuwait was a very close match to Stuart's HL plot for Kuwait.
To recap, several large producing regions have peaked in the vicinity of 50% of Qt--Texas; Lower 48; Total US; Russia and the North Sea. None have subsequently shown higher production than their peak level.
The years typically used to estimate Saudi Arabia's URR correspond to another stretch where production is also fairly flat, as do the graphs I've seen for some other OPEC members. I suspect using the last 14 years of production to estimate URR for most OPEC members is a case of garbage in garbage out.
thanks agian
Bought 2 pelton wheels last week---How much longer do we have before meltdown?
One thing that gets very clear, it isn't as easy as it looks. There are alot of different factors that get involved in small hydro, AC vrs DC, AC regulation, DC storage, and balancing load with generation capacity within a confined system. Power from the power co. is very nice. It takes alot of water and head to make power.
Thanks
log(Size(i))= a + b.log(i) + c.log(i)^2
and this
URR= Sum_i(a + b.log(i) + c.log(i)^2)
with: a + b.log(i) + c.log(i)^2 > Size_Min
I can follow the HL stuff better. Now, the URR for Saudi Arabia is obviously an important topic for the world. But I'm more concerned with what their maximum daily production is going to turn out to be. Will they get to 12+/mbd by 2009 like they claim? None of us know.
My only other comment was about including small (1 Mb) fields. It is hard for me to imagine when the time will come, if ever, that such fields will be worth developing and cost-effective to produce. I do know this -- if that time comes, the Stone Age is just around the corner.
Of course that is just my opinion and all I have to go with is the preponderance of evidence.
I understand generally that we must apply indirect methods to infer what is going on since we can never understand the wily thinking of this much esteemed and beloved gentleman.
Khebab and Stuart
give me heartburn
Not to mention Jeffrey and the others who are mathematically inclined.
- the area under the ultimate production curve (Hubbert approach).
- the area under the field size distribution (PFL approach).
I think that their combined application could be an interesting way to maximize the available information.We don't need to reach the 1 Mb limit which is more a theoretical case. Already above 70 Mb, the URR has reached 97% of its value.
This, in my opinion is why Saudi peaks at 58% instead of closer to 50%. Saudi has constrained production for most of the history of her fields. This is why she is peaking, or rather entering the decline stage now instead of a decade ago. The peak in Saudi production was actually in 1980 at 9.9 mb/d.
Great job! Please email to Saudi Aramco: maybe they will send back a response. Who knows what might transpire? Matt Simmons always pleads for greater transparency, maybe the SA Princes are finally ready to come clean--then totally dictate world energy prices when their fossil fuels' URRs are disclosed to all.
Bob Shaw in Phx,AZ Are Humans Smarter than Yeast?
yowza!
...hey, baby...whazzup?
The sell off has since spread from the economic periphery to the centre, recent sharp counter-trend rallies notwithstanding. IMO it has much further to go to the downside. A collapse of global liquidity would inevitably impact adversely on oil exploration as on almost everything else. Unrest in Saudi Arabia, where the erstwhile middle class is being ruined, will not help either.
Understanding peak and the rate of production decline are valuable. Petroleum is required to manufacture solar panels and the parts necessary to build, maintain, and operate wind generators, hydro-electric, and even nuclear power. There is no mining for uranium (or even plain coal) if you don't have gas or diesel for the big machines, and you need oil for machine lubrication, wire insulation, insulation varnishes for electric motor/generator windings, the computers and control equipment, etc. What is worse, since most do not understand the implications of the laws of Thermodynamics, the typical person in the world does not grasp why electric vehicles cost the world an even greater dependency on oil. First, the plastic body parts which are of course made from petroleum, but most importantly because the exchange of oil to electricity - transmitted through wires to a battery - to wires to a motor - robs you of more than 70% of the energy originally contained in the fossil fuel. Less expensive to operate does not equate to greater energy efficiency. If you charge the battery from a plug-in, the energy cost is less when the power company burns the fuel, than it does when you do from the gas pump, but fuel must be burnt nonetheless. If charging power was "green", we would simply burn more biodiesel or ethanol, and if it is solar/wind/hydro/nuclear based - you still need the petroleum to build, maintain, repair and integrate into the network. To build all of that infrastructe even requires millions of additional power lines - all of which need yet further insulation ... and yet more into each new home manufactured.
If we should choose to place massive spending into alternative forms of power, what would result? The most optimistic estimates by the Global Wind Energy Council show that, at best, the actual energy produced would approximate 6% of global capacity and 3% of America's by 2020 due to increasing demand. What about solar power? This technology is being brought to the desert taking up 7 square miles to produce 500 MW of energy 70 miles north of Los Angeles. Thus far this only seems capable of large production in the desert. Other projects using this technology that are not in the desert are designed to produce less than 10 MW. The environmental impact of these massive installations on the fragile ecosystem of the desert is uncertain, which will likely depend largely on how many of these installations are constructed. This is decent technology, but quite limited as you need one very important thing: an awful lot of sunlight, which isn't so great when the northern hemisphere is in winter. It will ultimately hold a similar capacity to that of wind power generation at best. If we are extremely lucky, solar, thermal, and wind combined could account for a true 10% of society's energy capacity by 2020 if we pursued both with great ferocity starting last year. Our petroleum based economy, and the energy to power its technology, will be bankrupt long before then.
Beyond all of that, there simply is no infrastructure to attempt to get wind, hydro, and solar power to 6 billion people. Here in the U.S. it would take a generation to build, sell, and properly install solar panels and windmills to power everyone in the country - assuming you had enough technicians to handle it - assuming the government could mobilize such an effort - assuming someone could pay for it all - assuming you had enough energy and petroleum-based products to manufacture all the parts and equipment - assuming you had all the energy and petroleum-based products to then maintain them over ... how long? If you could pull it all together before we run out of fossil fuels and petroleum products, solar panels for electricity are really only good for a couple decades on the outside, and then what? The cruelest of all myths concerning renewable energy is known as "the hydrogen economy." Electrolysis is the fastest and most suited to major production, but producing enough hydrogen requires generating massive amounts of electricity (burning fossil fuels or nuclear power) to pass a powerful spark through water, liberating the hydrogen from the oxygen, with a net loss of no less than 70% of the total original energy before the hydrogen is stored, shipped, distributed, shipped, distributed, and MAYBE into your vehicle ... so you must still burn fossil fuels, or accept the massive stupidity of producing more nuclear waste, which of course must still be hauled away to a distant location to store in a deep hole you must dig and fortify using massive machinery to do so, powered by fossil fuels.
Now, it's very easy to immediately start singing praises to recycling, research and development into fuel efficient machines, and advances in new technology, but you must remember the most critical ingredient to the problems outlined above; this is a world where literally everything is made from petroleum, powered by fossil fuels, or mined from the ground for processing with gasoline/diesel driven machinery. When the oil stops - everything stops. Major agriculture, fertilizers and pesticides for crops, large-scale meat production and its ability to feed animals on those crops, plastic tools and appliances, plastic wrap, rubber for tires and the wire insulation in every electronic device, Plexi-glass, basic road tar, water proofing, auto parts, the greater bulk of our most important medications - surgical gloves - anesthesia, the housing on your computer monitor, materials for aircraft maintenance, wood varnish - wood stains - paints, synthetic fibers for clothing, shoe soles, furniture, dielectrics inside digital devices, skateboard wheels, draperies, ropes and fasteners, tooth brushes, camera film - digital tape, CD's and DVD's, plastic coating on boxes of dried goods in the grocery store, sponges and scrub brushes, soap - detergent - shampoo - cleansers - disinfectants, plastic bags and bottles filled with foods and beverages, the millions of miles of power and telephone lines, food additives and preservatives, and even the power to filter and purify drinkable water ... everything will stop.
This isn't about politics or active environmentalism - that time has finally past, and the very best that frame of mind can produce is a slower tug at the Bandaid. The question is not IF peak oil will occur, or even WHEN, but more importantly how soon will the economics of global demand outstrip the world's ability to produce? Five years? Ten years? Those 60-120 months will probably come quicker than most are ready to handle - consider how fast the last 5 years years of your own life have passed. Even if we could stretch it all out for 15-20 years, for each 1-cent rise in gas prices sucks $14 billion a year from consumer spending. At gas prices one dollar higher than in 2004, that's $1.4 TRILLION gone from American wallets. Modeling suggests that once the national average price of gasoline remains above $4.00 a gallon (and proportionate prices globally) for longer than two pay periods, those beneath middle-income will quickly lose their ability to obtain their basic needs ... and that's when the people's voice will no longer be heard in the ballot boxes, but in the streets. The very real truth that few are considering, is that the politics, and economics behind petroleum production, will cause the pumps to shut down long before depletion occurs - when motorists can't afford gas at the pump, and global marktes can no longer afford to manufacture and sell goods requiring any synthetic components, producers can no longer afford to harvest the resource.
Many believe that moving to the country is the best plan, but please consider for a moment; if things became intolerable for highly urbanized communities, they will bring their troubles to your rural doorstep, and possibly more than once, assuming you actually know how to properly fit the missing draft horses into plow harnesses that your farm doesn't have, to pull plows almost nobody manufactures in this age, to attempt to plant crops you don't know anything about, and then irrigate them without electric pumps powering your city water or well. This is not a time to panic or move into the hills - this is the time to enjoy life to its fullest, while keeping both eyes open, both ears alert, and your mind actively engaged in long-term planning for the security of yourself and your loved ones. The truth is, civilization will NOT collapse all at once ... but crumble slowly, at different speeds all across the globe. Where one city in one country may be shaken to its foundations in a matter of days during socioeconomic/political revolt, another town half-way round the globe may do just fine for decades to come.
When it's too expensive to produce, regardless how much is left in the ground, that is when the pumps stop.
Many of us will convert our equipment to wood gas. We have the parts and plans. Those who plan on using their four wheelers/ATV's will also convert but use a hitchcart/forecart so that standard three point hitch equipment can be used. These are used by many horse farmers today. All of us will limit how much ground we prepare so as to minimize engine hours. In other words, I and my neighbors will probably plant no more ground than what is necessary for our own survival - with just a little extra to give away.
The raging hords are always brought up. I have to say that I am more concerned about the govenment coming along and forcably moving us, taking our goods or burning us out. I live in the mountains and we can pretty much isolate the area from the hords. Further, I think that by the time there were hords, there would also be martial law and an open facist state.
Guess we'll have to wait and see.
"...this is the time to enjoy life to its fullest, while keeping both eyes open, both ears alert, and your mind actively engaged in long-term planning for the security of yourself and your loved ones. The truth is, civilization will NOT collapse all at once ... but crumble slowly, at different speeds all across the globe. Where one city in one country may be shaken to its foundations in a matter of days during socioeconomic/political revolt, another town half-way round the globe may do just fine for decades to come."
Understand there is no time-table ... only facts that can be examined as they are today, with implications that follow.
When the price per barrel hit it's peak last fall, I was still living in Los Angeles. I was standing on the corner of Laurel Canyon Blvd. (Cresent Heights) and Sunset Blvd. at 6pm that Friday - one of the busiest parts of all of Los Angeles (a city where 11 lanes of traffic become parking lots by 4:00PM) - and I had the most "creepy" feeling I have ever known. I felt restless and couldn't figure out why ... but something compelled me to step into the street. I did, without hesitation, and then it hit me; there wasn't any traffic for 4 blocks in either direction. This particular area is the only way into the 'Valley from L.A. unless you drive all the way around the 'Hillz via the 405 (parking lot) or take highway 101 around the 'Hillz on the other side (11 lanes at one point).
I waited ... stepped back to the curb ... and watched as buses passed - wobbling from more than standing room only. Then traffic. Then stillness again.
In the biggest cities - what I describe IS reality. Memories tend to be short.
In 1992, a man named Rodney King was assaulted by Los Angeles police. As the sun rose over Los Angeles, more than forty (40) major fires still burned out of control. They were part of an estimated 140 fires that were set in the Southeast and Southcentral parts of the city. During the night, firefighters and paramedics were hardpressed to keep up with the requests for emergency response to more than 140 fires. Reportedly, they came under sniper fire on several occasions, from rooftops surrounding the fire scenes. One Los Angeles firefighter is reported in stable, but serious, condition at an area hospital following his being shot in the face while fighting a blaze.
According to a police spokesman at least five (5) people have been shot by police and one was killed in a gun-battle in the city's Inglewood area. A spokesperson for the Daniel Freeman Hospital says that they have treated at least fifty (50) citizens with "riot-related" injuries. Emergency Medical Services (EMS) officers say that all available city ambulances are "on calls" and that mutual aid from Los Angeles County and Orange County has been requested. At least 192 people are reported to have been taken to various hospitals in the L.A. metropolitan area.
As 4,000 regular Army troops and 1,000 federal law enforcement officers move into Los Angeles, people have begun to actually assess the severity of this latest day of "revolution". They find thirty-eight (38) people dead, 1,250 people injuried, 3,600 structural fires, hundreds of businesses looted and closed, and more than 3,000 people arrested. At least four (4) police officers and three (3) firefighters have been shot and hundreds of other injuried as they attempted to control the fires and lawlessness of the past three days.
A "Dusk to Dawn" curfew has been imposed by Mayor Tom Bradley, in an effort to prevent citizens from congregating into the groups that have controlled the streets in recent days. The curfew also finally has "teeth" as 4,000 California National Guardsmen assist the police in securing areas of previous violence. This evening, the National Guard Units were also "federalized" by President Bush and supplemented by another 4,000 Army and Marine troops with orders to act as "Light-Infantry" and to "return fire if fired upon".
Reports are received at the time of this report that authorities may be gaining a tactical advantage and that, with the help of an added 9,000 law enforcement and military personnel, the situation may be under control by the weekend. According to current reports, there have been fewer fires and shooting incidents since the curfew was instituted on Friday evening.
The wave of destruction, which had spread from Southcentral Los Angeles to Downtown, to Pasadena, to Hollywood, and to Koreatown, has not always seemed just a response to the Rodney King verdict. Often in it's intensity, the "rioting beast" did not pay attention to the race, color, or creed of it's victims; it struck indiscriminately. Early video tapes of the "rioters" sometimes showed middle class white youths, street gang members, and those that have been associated with radical organizations such as the American Communist Party.
Los Angeles Police say that the circumstances also "unleashed" criminals, street gangs, and others who's only motive in involvement in the riots was that of profit. They point out the fact that this was also felt to be the perfect opportunity to justify acts of violence, by street gang members, against members of the police department. Police Chief Daryl Gates admitted that on several occasions his forces had also been "overwhelmed" and unable to respond to even calls for assistance from fellow officers and firefighters. This reportedly enabled those that would engage in revenge against any official agency to feel that they could do so with impunity.
As the senseless violence reached it's peak in Los Angeles on Thursday night, reports began to be received that it had spread to other cities and states across the country.
- In Northern California, 1,400 people were arrested in San Francisco as rioting engulfed the city's downtown area. A State of Emergency was declared there and a curfew established.
- In Los Vegas, a mob of two-hundred (200) people went on a rampage, setting fires, and engaged in sniper fire and drive-by shootings. Local law enforcement officials admitted that they were overwhelmed and requested the activation of the Nevada National Guard. The Governor complied and control has reportedly been somewhat re- established. Reports were received of several arson fires.
(3.) Seattle was struck by mobs of 50-100 people, who randomly broke windows and and looted numerous cars in downtown Seattle during the night Thursday and early Friday. Police say that forty-five (45) people were arrested and five (5) injuried during the violent spree. Firefighters responded to twenty-eight (28) fire calls during the unrest, including five (5) buildings that were termed "suspicious in nature".(4.) Further East, Black protestors in New York City reportedly pulled two white men from a truck, stabbed one and beat the other. An estimated two-hundred (200) protestors attacked the doors at Madison Square Gardens causing injuries and property damage. Another crowd of four-hundred (400) black youths reportedly stormed a popular shopping mall and smashed windows and stole merchandise. Shops and businesses were damaged as the "melee" traveled over several blocks. As many as eighty (80) arrests were made and several police officers injuried. Many NYC employers were said to have released workers from work early to avoid further occurances.
(5.) Police in Atlanta, GA were confronted on Friday, by hundreds of black protestors. This followed a night of three-hundred (300) arrests and fifty-seven (57) injuries. It also prompted the use of teargas and a call for the Georgia National Guard to help combat large crowds of people looting and throwing rocks and bricks. Mayor Maynard Jackson called for calm and understanding, as he counselled college students that had originally begun peaceful protests which escalated into wide-spread violence.
Sporadic acts of violence, arson, and property damage were also associated with the Los Angeles Riots in such cities as Tampa, FL, Pittsburg, PA, Birmingham, MS, Omaha, NE, and several other locations.
As night settled over several cities, residents took to their homes, prayed for an end to senseless violence, and waited for the morning light to see if the fragile peace was to endure. Fire, Police, and EMS Officials hoped for even a brief respite from the constant stress and danger of angry citizens and harrowing rescues. Everyone wished that the madness would be over.
Now ... what do you think happens when the lowest income families in the hardest parts of the biggest cities start to do when they cannot afford the gas to put into their 20 year old vehicles to drive the average 30 minute commute to a job that pays the lowest wages, to come home with a pay check that doesn't cover the cost of heating, electricity, telephone, and basic necessities - as every one of the above is tied to the price per barrel of oil? What do street-tough boys do when they see their mother crying at night because interest rates have gone up along with the cost of essential commodities and they may lose their home, or must go without what most take as the most primitive elements of survival? Street-tough boys who may have a gun? Run with others who do? What happens when marches and protests, like we just witnessed from the immigrant community of 250 - 500,000 people turn violent because someone wants to send in 4,000 regular Army troops and 1,000 federal law enforcement officers to ensure the passage of emergency services? What happens when the prices get high enough that this kind of situation begins to unfold - and then we have a hurricane season like last and the price of gas temporarily jumps to $5.00 a gallon while the number of foreclosures jumps into the many hundreds of thousands because those at the bottom of our economic pyramid cannot afford their mortgages on the variable rate loans they took before inflation came?
This, my friend, is reality.
Rat
Blow the bridges or drop trees across the roads. We don't need to go to town. Get them on thier feet where they can't run far and are easier to shoot if its going to get that ugly. Rifles with scopes against some attitude filled gang banger and his short barrel glock in the woods? This is very diferent than driving by and shooting out the window at some unlucky person.
Do they know how to stay warm if they have to spend the night out. Can these street tough boyz start a fire without matches or hell even start a fire period, especially if the wood isn't dry? Do they know which plants you can eat and which ones will kill you? Do they know which animals come out at night and why?
Steet tough is tough is town but not even in the ball park in the country IMO. There have been too many Walt Disney movies...it won't be that easy for them.
Moral: Arm up and know how to use the stuff. Train regularly. Take your courses in not only marksmanship but in safety, safe reloading, hunting safety, etc. Participate in matches and "fun shoots". Probably a certain amount to be learned from war re-enactor groups too, some of them get pretty hardcore, living in the field and doing everything "historically correct" as much as possible. Dunno about the muzzleloaders this early in the game, but living in the field for a week living on beans and salt beef might be good training for most of us!
They were bragging about it on KPFK a couple of years later!
Great post. If you could divide it up into smaller bits, it would be even greater. I offer that not in an attempt to criticize but because I really liked it and hope you post more.
Regarding the modeling of the effects of $4.00 gas, do you have any references or links for that? I would be very interested in reading more as I've wondered what the "breaking point" for the average American is.
Best,
Matt
Kenneth Deffeyes has a section in this topic in one of his books (I think the first one), where he discusses one well oil fields in the US. These tend to be very small structures pinpointed with 3D seismic.
These one well oil fields are on the opposite end of the spectrum from Ghawar, the King of Kings, which accounts for about half of SA's production.
I have asserted that, practically speaking, if SA has peaked the world has peaked.
One can probably reduce it further to, if Ghawar has peaked SA has peaked, and therefore the world has peaked.
Insofar as I know, there is no Ghawar analogue--in terms of percentage of a region's production--in any of the large producing regions that I have used as models. (I suppose Burgan would be similar to Ghawar, in terms of percentage of production.) If memory serves, I think that the East Texas Field accounted for about 7% of Texas production in 1972. The East Texas Field and overall Texas production had their final peaks at the same time.
The Yibal Field is a very good--and scary analogue--for Ghawar. Same reservoir, same drilling techniques. Yibal had about an 80% drop in production over a five year after the water hit the horizontal wells. Shell did not see the decline coming.
The real challenge that Saudi Arabia probably faces is having to replace rapidly declining production from a field that accounts for about half of their production.
If you have a copy of Simmons' book, I suggest you go back and read the chapter on Ghawar again.
Reserves are broadly created by two accidents of history: first the ancient conditions required for the accumulation of organic matter, and later the geologic conditions required for conversion/containment.
It seems to me that these processes would center on the typical sizes of seas & etc., with relatively fewer examples at the high and at the low end ...
He had an interesting observation. In 2000, more than one-fourth of US oil production came from nine oil fields. Three of these fields were 100 years old.
IMO, the HL technique works so well because we are--by and large--plotting the rise and fall of large oil fields.
Saudi Arabia (and the world economy) are extremely vulnerable to a decline in oil production from Ghawar. IMO, this makes it all but certain that SA can't stop total oil production from falling.
Strictly speaking the Saudis may be telling the truth that they are cutting back voluntarily, but it may be voluntary in the sense that you "voluntarily" hand over your wallet to a guy holding a gun on you. The water cuts may have gotten so scary that the Saudis were concerned about rising water production cutting off pockets of bypassed oil in Ghawar.
Connect the dots: (1) the Saudi stock market crashes (because of heavy insider selling); (2) the Saudis admit to a 5% decline in production and (3) they are in the process of desperately trying to get every rig that they can lay their hands on, to the point that half of the jack-up rigs in the Gulf of Mexico will soon be in or headed toward the Middle East.
Kinda like the four oceans (and a few seas) really being one ocean.
Great work and laud you for it....I would however proffer that perhaps the distribution of feilds in relation to one another may prove the math more effectively if one did not use arbitriary borders such as SA and used rather linner geographical distance instead. For example to answer the following interrogative: How many feilds and what size of (X) Km of a givin Elephant....distribution should be limited by distance not an arbitriary political boundry.
Very well done and please continue the great work... regards TG80 sends
Unexpected rant on this site. I try to type such stuff on Peakoil.com. Not to criticize however, a breath of fresh air really as I just don't get the math most of the time on TOD.
Anyway, your long posting on LA riots in 1992 spreading everywhere and being coordinated reminded me of last fall in Paris spreading all over France by Arab and poor inner city youth. I live in Germany and it really did not pick up here or much of anywhere else outside of France. People across Europe and USA are getting in long term problems due to pemanent high unemployment and general difficulties. In the inner cities(USA and Europe) you are having problems of long term poverty likely similar to what the middle classes will suffer with much higher energy prices. Yes traffic has reduced here in Hamburg to a certain extent. I think it will taper off more slowly in Europe as people have gotten smaller cars, live closer to work generally and pay so much for gas that they are already quite used to it anyway.
I had been thinking over the weekend of the difference in adjustment capabilities between major economies depending on social cohesion. Japan at one end where all almost everyone is ethnically same and has been there with same language and culture for a very long period of time. They adjust quickly to crisis without violence and can handle a lot of stress. USA on the other hand is your classical immigration country where cultural cohesion is created less by what grandma cooked than by coca cola, Mcdonald's, General motors, MTV, etc. Since turnover in ethnic identity and/or cultural values is "relatively" quick and fluid for the community as a whole there is a great deal of flexibility and creativity which perhaps the Japanese do not have to solve problems through their homogeneity and conformism. Sweden is European example similar to Japan. Although they have 10% immigrants, the country is so small and homogenous that they could quickly make a 2020 plan to save their country. Germany and Italy are actually much less homogenous being a mixture of dialectical regions mixed together end of 19th century so that decision making is quite excruciatingly slow and at lowest common denominator.
Again we saw what happened in France and LA when poor in Ghettos with perceived and real injustice start taking it out on others. In Third Reich WWII obviously a somewhat artificially created Germany was hypnotized into hating external and internal enemies. the Japanese had no internal enemies so they just attacked external ones. The Germans did this due to inflation destroying their lives completely.
My big worry is that some sort of combination of economic depression, inflation, peak oil, etc. will create economic, class, racial and religious tensions within and between countries causing riots by poor and minorities resulting in repression, deportation, internment, marital law, dictatorship and war situations. Obviously the severity will be different as one sees in Germany although 20% are foreigners or of foreign descent no riots broke out last fall. In UK the foreign community is quite differentiated so it is difficult to tell although riots have occurred there before. Terrorism is also a possibility if right wing governments get too involved in repression or deportation of minorities. The Jews were such a small minority of 1% or less in Germany that they could not make any big trouble for the nazi terror regime. 15-20 million muslims in europe could make a very big resistance similar to underclass blacks in USA.
My General question is whether the survivability of system as a whole is endangered or helped in a crisis due to the policy up until now of cultural openness/immigration or would it have been better in Europe for example to stay like Japanese or Koreans, homogenous. Fresh blood brings new ideas and enlivens a monotonous culture and gives cheap labour in times of wealth but when the pie shrinks people pull back into their traditional tribal affiliations causing problems partcularly when people live door to door as in big cities everywhere in "the west" now. Brazil and India have completely different solutions to racial differences than USA. One uses a caste system and the other does not call people Black or White on the one drop of blood system so that social consciousness is not based on such a strong racial concept as in America(one drop of black blood makes you black- although stasitically US blacks are ca. 10% white). Social cohesion is effected negatively by this quasi deliberate unconsious social-genetic apartheid in USA.
Great post, nothing wrong with your english.
I'm looking forward to see how universsal that 0.07 curvature is.