Consumption Winners and Losers

[editor's note, by Prof. Goose] Hey folks, see these buttons to the left? Note that they include reddit and digg. If you recommend TOD articles at these sites (account required, but they take seconds to set up, and once setup and logged in, all you have to do is click!), we can get more traffic driven over here!

Oil consumption percentage change from 2004-2005 for countries in BP report, versus GDP percentage change 2003-2004. Source BP Statistical Review of World Energy 2006 for oil consumption data, and United Nations Statistics Division for GDP data.

Continuing with exploration of what's in the new BP report, I wanted to update information on how consumption changed in various countries as a result of the tightening of world supplies through 2005. I looked at this question in Who has to conserve how much? based on EIA data, but the BP data breaks out a lot more countries.

Let's start by looking at those countries that reduced their usage from 2004 to 2005, ordered by the absolute change in usage:

Top countries by absolute decline in oil usage 2004-2005. Source BP Statistical Review of World Energy 2006.

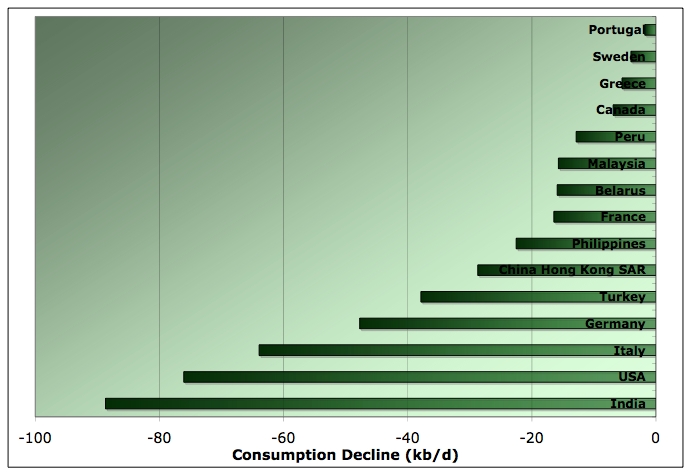
The surprising leader was India, with the US closely following behind. After that we get mostly European countries, with a scattering of middle income developing countries in there too.

Let's look now at the countries that declined based on how big the decline was as a percentage of their 2004 usage:

Top countries by percentage decline in oil usage 2004-2005. Source BP Statistical Review of World Energy 2006.

The list is the same, but it was the middle income countries making the largest percentage cuts, and the US made the smallest percentage cut of any country that reduced oil demand at all.

Turning now to countries that increased their usage (all those who increased by 25kb/d or more):

Top countries by absolute increase in oil usage 2004-2005. Source BP Statistical Review of World Energy 2006.

Here China dominates, followed by a group of oil exporters and then a mixture of western and developing countries with no obvious pattern. If we look at it on a percentage basis (for countries that increased 5% or more):

Top countries by percentage increase in oil usage 2004-2005. Source BP Statistical Review of World Energy 2006.

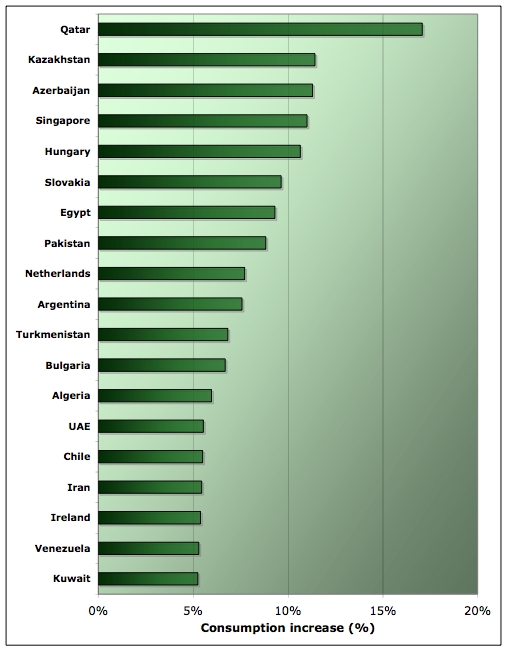
Well, certainly the oil exporters dominate this list, but there's plenty of random developing countries in there too, along with former communist nations. Two western developed countries made this list: Ireland and the Netherlands.

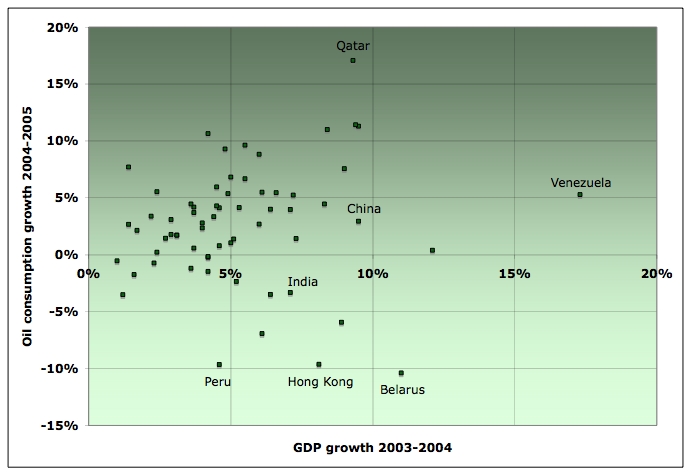
A theory I had was that general economic growth would be a good predictor of who would have to conserve oil usage, versus who could continue to grow it. Unfortunately, I couldn't find 2005 GDP stats, so I had to make do with 2004 GDP growth stats from the UN. These have very little explanatory power for oil usage changes:

Oil consumption percentage change from 2004-2005 for countries in BP report, versus GDP percantage change 2003-2004. Source BP Statistical Review of World Energy 2006 for oil consumption data, and United Nations Statistics Division for GDP data.

For example, fast growing (economically) India conserved oil quite significantly. Some oil producing countries had massive GDP expansion, but they varied widely in how much oil usage expansion there was as a result. Clearly, a more complex analysis is required to determine how things are going to go (if indeed it can be predicted).

For those reading Dave's Thailand study, I note that Thailand is in the middle of the pack, with fairly strong 2004 economic growth of 6.4% and an oil usage increase in 2005 of 4.0%.

Thank you Stuart.  Great post here.  I think the fact that oil exporters dominate the list of counrties experiencing energy consumption increases serves like so much else we've seen to boost Westexas' theory about the world's export capacity being of a greater immediate concern to consuming nations than world oil production.
Note that Stuart has recently documented:  (1)  falling oil production in Russia and Saudi Arabia (at least through the first few months of 2006) and (2)  rising consumption in Russia and Saudi Arabia.

In regard to the 2005 oil consumption decline in the US, I wonder how much of that was due to hurricane damage to refineries?

That's what I thought too. What's the increase/decrease consumption data look like for previous years for oil importers?
Except that exports grew in 2005.
Guess this is where I say something flippant and say, as an Amurrikan, I know who the winners and losers are: he who consumes the most, wins.
I find the last chart encouraging. It seems to suggest that efficiencies can indeed make a difference. I wish Dave could find time to take a look at the success stories there, like Hong Kong or Belarus. Especially Belarus seems tough to figure out - are they an oil/gas producer? Have they opened new nuclear power plants? I see few other ways to explain their position in the chart. GDP growth is to be expected since they're recovering from a recession, but how come it's not matched by growth in oil consumption?
Belarus has oil refinieries that export their products. It can import Russian gas for a heavily discounted price. There may be some problems with the statistics, too. We might here have some combination of statistical discrepancies, substitution by gas and NGLs (also in transport use - trucks and buses use natural gas, propane and butane as fuel quite commonly) and refinery activity.
It's surprising to me, that India's consumption obviously decreased by more than 3%. In the media, it is always mentioned the increasing consumption in China and India is one of the driving forces for higher oil prices.

India's growth in GDP is around 7%. Maybe the reason is, India's economic growth is more based on computer services. Whereas China is more the producing place.

I will be interesting to see if this trend will continue. I presume oil consumption in India will increase again.

India is using lot of oil for electricity generation. Almost every (60%) company has its own generator in the backyard as a backup. Increased coal and gas power generation has diminished oil use for these purposes. Coal and natural gas production is growing there, so is coal imports. Rising crude prices have no doubt caused some substitution of oil in non-transport use.
A couple of years ago teh Phillipines reduced oil consumption for similar reasons - new large electric power plants displaced huge numbers of small diesel electric generators previously needed because electricity had been unreliable. China is in a similar situation, their diesel use might soon decline as their gasoline use continues to increase.
Tertzakian (author of A Thousand Barrels a Day) calculated "Oil Dependency Factors" for leading economies. India and China topped the list at 94 and 90 respectively with the US at 45. Japan, Germany, Russia, Italy, and UK were all less than zero. Based on BP data for 2004-2005 for consumption and World Bank GDP 2004 / IMF GDP 2005 "estimate" India and US were less than zero and China was approaching zero. This is of course one year of change and may or may not be sustainable. Tertzakian has a chart for the US of the relationship between GDP and Oil Consumption (p. 105) that is remarkable in showing the response of the US economy to the spike in oil prices in 1979. It would be interesting to look at such a chart updated for 2005 for all the leading economies.
Sadly these facts and analysis are consistently overlooked in the myopic rush to see every bit of news as proof that peak oil is happening right now, to bend every theory to that conclusion, and to only consider worst case scenarios.
It is interesting to see the reduction in
consumption. It is a shame that we do not
have the figures for the individual
poorest countries. As I would expect them
to be the first to be affected by demand
destruction.
  It is easy for the large profligate users
i.e. USA, to cut usage as all in the First World
waste so much energy. One would expect a
percentage of people in the First World to drive
more slowly, check tyre pressures, reduce speed,
and cut out unnecessary journeys and so reduce
demand a small amount.
  It will be next year's figures, when oil has
been $70 all year, that will be more interesting
to analyse.
Economic growth versus consumption growth should always be compared for the same period, certainly if it is as short as a year.
Well, I agree - do you know where to find 2005 GDP stats?
I did some searching.  Not much out there for complete year stats on GDP yet.
whoops.  I lied.  Wrong search terms!

http://en.wikipedia.org/wiki/List_of_countries_by_GDP_(nominal)

sourced from the IMF.

If you want per capita gdp, I'll need some 2005 estimated pop stats.  or is the raw number what you wanted?

I am staggered by the increased consumption of Singapore.  I spent some time there in 1994, and it seemed maximally developed at that time.  They already required premium stickers to drive in the CBD.  It is hard to imagine more room for automobiles.  I wonder if the stats for Singapore are being pumped up by oil used in shipping?
This is especially true since the figure is in kb/day. If it was in per capita terms, Singapore would probably be at the top of the list.


Singapore has oil refineries for petroleum product exports. May be this is factor here, too.
When I flew into Singapore the number of ships off-shore blew my mind.  The only mental comparison I had was photos of the D-Day fleet.

Maybe a big share of Singapore's oil consumption goes to its role as a trans-shipment point?  Port & air operations?

Singapore Port bunkering stats show that they sold 23.5m tonnes of marine fuel of all grades in 2004. Afraid I don't know the conversion factors to barrels of oil.
Singapore Airport (Changi) lists 204,000 aircraft movements annually. I would guess most take on fuel as many are long haul 747s.
All of this will certainly distort the oil consumption you might otherwise expect from the 2005 population of 3.5m.
Caspian and Caucasian ex-soviet countries are signigicantly large oil-producers themselves, production far exceeding local demand, so they are not pressured that much by high oil prices. It's little wonder they're wasting oil.

Post-communist Eastern-European countries usually still get a nice discount on prices of NG and oil from Russia, and they have a real growth rate 2-4x more that of the EU15, while being very energy-inefficent due to significantly higher average vehichle age and poor heating-insulation of houses. Not sure about other countries in the region, but Hungary also has a very advanced (by relative contribution to GDP) petrol-chemistry sector, wich uses up quite a lot of oil, and it was seemingly resistant to high prices so far.  
Although the issue is surely not represented in these charts, I still remind you about the NG 'wars' between Ukraine and Russia this winter, which caused severe supply problems in some of these countries. Power plants were ordered to burn oil instead of NG (a lot of them are bound to do so in case of NG shortages by contract).
Since it's impossible to diversify NG import in the short & mid term for these countries, they, AFAIK, try diverting some of NG usage growth to oil, because existing ports in the Adriatic region can be used to ship in oil, and dodge such 'problematic' pipeline-countries like Ukraine. (those ports do not have LNG facilities yet, and it would be a LOT more pricey)

Nice to see that my country Netherlands made it high on the list of oil increasing countries. That while our petrol is listed at the top of most price lists.
Well before making final conclusion on the increase of oil consumption in the Netherlands, the function of Rotterdam and its refineries in worldwide oil trading has to be accounted.
Look at this picture to see the amount oil that is processed and exported as oil products. It shows the primary energy flows for the year 2000. Around 2/3 of the primary energy use in the Netherlands end up as exports. I'm not sure that the figures for oil products end up in the BP numbers. Natural gas exports are reported in the BP numbers. Holland is the fourth largest exporter after Russia, Canada, Norway.
   
Canada seems to be an interesting case over the past few years.  NG production has been (roughly) flat for the past five years.  Consumption, after jumping between 2000 and 2003 by 10% (tar sands related?), has been flat for three years.  Most interesting is that total oil production was down ~1% 2004-2005, and only up about 1% from 2003-2005.  If the tar sands are going to come to the rescue, something better happen soon.  Is there a breakout of recent conventional vs. tar sands production in Canada?
Is there a breakout of recent conventional vs. tar sands production in Canada?

There are definitely a lot of projects in the works. I forget what the overall numbers are, but everyone and their dog has a stake in Canadian tar sands.

RR

Boone Pickens had two buy recommendations regarding energy:  coal & tar sand companies.
Still don't know where all the natural gas will come from to develop the sands. How long will Canadians accept their NG reserves being diverted to syncrude production at the risk of near and long term shortages for home heating, electrical production and industrial uses?

I had read that the full development of tar sands on the board would consume the entire MacKenzie basin production, Canada's only huge untapped gas reserve left (as I understand - some may know better).

I posted a note a while back about the proposed Enbridge pipeline, running from around Kitimat, BC, to the tar sands projects (about 1200 kms), with the project currently going through the regulatory run-around.  The pipeline is still years away, but the idea is for a two-way highway - the products from the tar sands going to the coast (and then to market, which is increasingly looking like China), and NG going inland, to fuel the tar sands operations (with the NG coming from ...???).
Kitimat just saw the closing of the Methanex plant (cheap NG to methanol) not due to exhaustion of the resource, but higher prices. Existing pipelines to Kitimat from established northern BC gas fields.

Northern BC gas pipelines do not go AB, (coals to Newcastle) but to Kimimat and points south.

SOME of the NG will likely come from northern BC in a "V".  With much higher prices (imported LNG being the competitor) northern BC gas drilling should see a boom.

My GUESS is that we may see a lot of propane & butane that is now being flared off heading towards Kitimat.

I think my real question is not where they can possibly get it from, but is this truly the priority that Canadians will accept for their Natural Gas. It is a limited resource, production is currently flat or declining and it is desperately needed for other uses. As long as there was stranded gas and the tar sand demand was limited, it wasn't such a big deal. With the proposed expansion it becomes a huge deal and competes with other, some might say more important, uses.
Is there a breakout of recent conventional vs. tar sands production in Canada?

There is an article(diary) I wrote at DailyKos that contains these figures.

http://www.dailykos.com/story/2006/5/22/154616/214

Great post.  Figured demand had to be destructing somewhere.

Some anecdotal support:

Signs of an imminent power crisis loom in Sri Lanka

An imminent power crisis was obvious in Sri Lanka, after an appeal was made yesterday by the Power and Energy Ministry, requesting all offices, both state owned and private to try and conserve electricity as much as possible.

Zimbabwe: Coal Shortage Hits Manufacturers

The manufacturing sector has been severely hit by coal shortages forcing some companies to import from neighbouring Botswana at considerable expense in scarce foreign currency.

...Most manufacturers contacted yesterday confirmed they had been facing serious coal shortages over the past four weeks.

Interesting, because ordinary people in Zimbabwe have been faced with gasoline shortages and rolling blackouts for much longer than that.

Uganda: Power Crisis Dominates 2006 Budget

Uganda's severe power crisis will curtail the government's plans to boost domestic revenues in Thursday's budget so as to reduce reliance on donor aid, business leaders and analysts said on Wednesday.

Uganda has suffered crippling electricity shortages for months. Residents in Kampala receive power for just 24 of every 48 hours, and almost every business has been forced to run costly, diesel-powered generators.

And Korea admits they are Addicted to Oil:

It no longer needs emphasizing Korea is the world's fourth-largest importer and seventh-largest consumer of oil. In 2005 we spent $66.7 billion importing fossil fuel, much more than the combined exports of our top two items -  semiconductors ($30 billion) and cars ($29.5 billion). In sum, this country poured hard-won export earnings into buying Black Gold. If things go wrong with foreign shipments, it would soon lead to pressure on our international balance of payments.
"Zimbabwe...manufacturing sector"

Perhaps if a country's "comparative advantage" is essentially just cheap labor then it may turn out that the cost of providing energy to them is greater than the savings attained from their cheap labor.

It seems clear that the relationship between economic growth, oil consumption and high oil prices is...complicated.

If high oil prices are causing a global plateau in oil demand, so that the demand/supply picture in the short term becomes a zero sum game, it's going to be even more interesting this year and next to see who the winners and losers are in consumption increases or declines. Who has the smartest policies? Who is most able to conserve? Who is most able to afford consumption at sustained high prices?

It's going to be very interesting.

There are situations where cheap labor is also ignorant labor. They are cheap because they don't know how to do factory work which means little demand by manufacturers. Much of Africa work means working on the farm or in the mines.
Comparative advantage, as used in economic trade theory, is independent of the absolute price of labor in the trading countries. Given two tradeable goods, and two countries where the ratios of the amount of labor to produce the goods are different (eg, in country A it's 3:1 and in country B it's 2:1), then the countries can profitably trade surpluses of the good they do more efficiently. Comparative advantage is about relative costs within the country, not about absolute costs.
Hi, Stuart:

I too had this theory that the low-GDP nations would be forced to cut back on oil consumption per your graph above, but this was evidently not the case. The surprising case for me was Bangladesh, not known as an economic powerhouse in a good year, but had a 2.8% increase in oil consumption.

There are two other interesting cases: Malaysia and Philippines: In the case of Malaysia, there were reports of chronic problems with diesel, due to governmental ineptitude, and the Philippines, from which there were reports all year of rationing and other problems, and both of these countries had declines in usage.

But, the other thing on this is that a hypothetical 1% decline by the US would equal more than the entire consumption of 9 out of the 52 countries listed in the report. Also, this 200 mbd decrease would be equal to about half of the declines in your second graph, above.

Is it possible that the great big growth in Qatar oil consumption is stuff being sold to a certain army slightly to the north?
Re: "I note that Thailand is in the middle of the pack, with fairly strong 2004 economic growth of 6.4% and an oil usage increase in 2005 of 4.0%"

Despite Thailand's desperate fuel switching efforts, they are still heavily dependent on oil to fuel their economic growth. Already, cracks are starting to show up in their recent impressive GDP numbers due to high prices. Read Thailand's Economic Prospects and Financial Stability by M.R. Pridiyathorn Devakula, Governor of the Bank of Thailand. Unfortunately, I can't seem to cut and paste from this document, so I highly recommend reading it. He was addressing executives of Thailand's national oil company PTT. But here's part of what he says:

  • The Thai current account went from a surplus of 6.6 billion (US) dollars in 2004 to a deficit of 6.1 billion dollars in the 1st half of 2005, with a bit more than half of this reversal due to high world oil prices. Generally, Thailand must make major efforts to decrease their dependency on oil imports.

  • In light of the fact that the US current accounts deficit and it's trade deficit are unsustainable, the dollar may crash. Therefore, Thailand must strengthen their exports in the Asian market and get away from their dependence on exports to the US. The presumption is that the US will not take care of their problems.
His general message being with respect to the US, Danger, Will Robinson, Danger!

best, Dave