A Look at the EIA Revision Pattern
Posted by Sam Foucher on October 5, 2006 - 11:45am
The EIA is periodically revising its monthly oil production numbers. We have a natural tendency to focus on the front month but very often numbers are revised up to 3 years. In this post, I try to address the following questions:
- How frequent are these revisions?
- How biased are the first estimates in the long term: are they too optimistics or too pessimistics?
- How is the bias is changing according to the petroleum category (i.e. All liquids, Crude Oil, NGPL and Other Liquids)?
I compiled 42 International Monthly Reports from the EIA since 2003 (the data are in a spreadsheet here).
I give the post summary first for people who don't want to scroll down through all the charts:
Summary
The two graphs below are summarizing the observed changes over time. Note that there is a significant change in the curve behavior around 27 months.

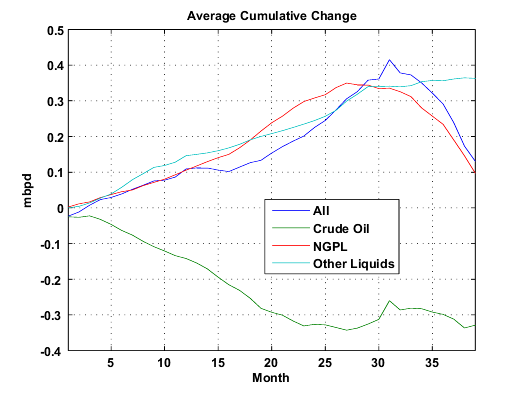
Fig 1.- Observed average variations on an initial estimate versus the number of months since this estimate was issued. Click to enlarge.
For the last two years:
- Corrections are quite small, around 0.3-0.5%.
- NGPL was almost always underestimated by 0.2 mbpd.
- Crude oil production numbers are generally overestimated by 0.2 mbpd. In average, estimates that are older than two years have been revised downward by 0.3 mbpd.
- The other Liquids category seems to be underestimated but a kind of seasonal pattern can be observed since 2005 (See Fig. 13, underestimation at the beginning of the year and overestimation at the end (Ethanol?)).
- The early all liquid estimates seem too pessimistic by 0.2-0.4 mbpd in average. However, the corrections have gone negative since the end of 2005.
In conclusion, One should be careful when a production peak is seen in the data (as it was the case for December 2005). The lifespan of an early estimate can cover at least two years.
All Liquids
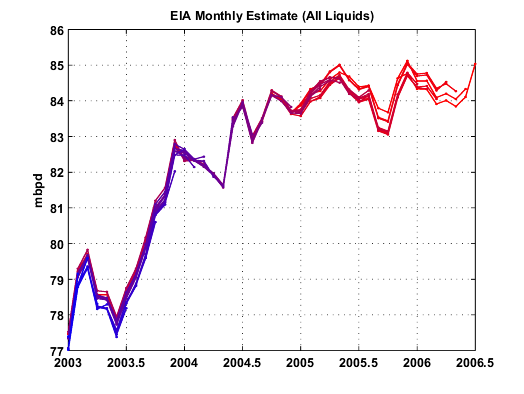
Fig 2.- All Liquids (all the Monthly reports ranging from 2003/03 in blue to 2006/09 in red). Click to enlarge.
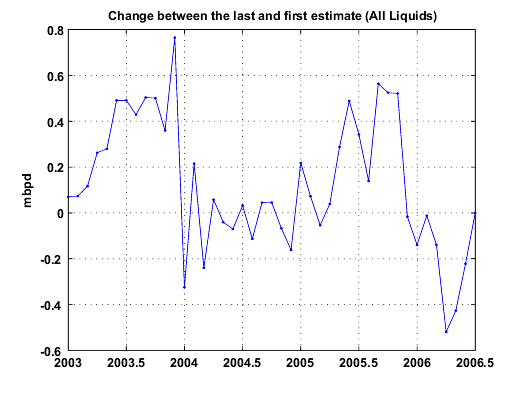
Fig 3.- Estimate change (i.e the last estimate minus the first estimate). Click to enlarge.
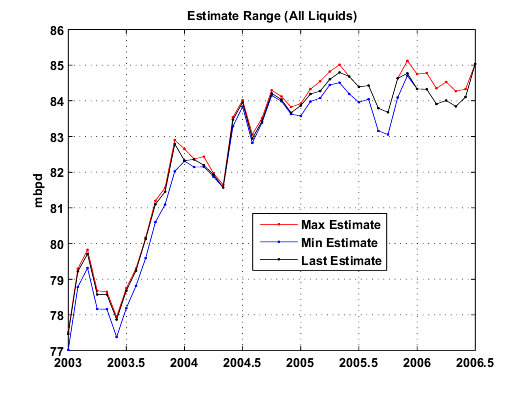
Fig 4.- Estimate range (the last estimate (2006/09) is in black). Click to enlarge.
Crude Oil
EIA's definition:Crude Oil: A mixture of hydrocarbons that exists in liquid phase in natural underground reservoirs and remains liquid at atmospheric pressure after passing through surface separating facilities. Depending upon the characterics of the crude stream, it may also include:Liquids produced at natural gas processing plants are excluded.
- Small amounts of hydrocarbons that exist in gaseous phase in natural underground reservoirs but are liquid at atmospheric pressure after being recovered from oil well (casinghead) gas in lease separators and are subsequently commingled with the crude stream without being separately measured. Lease condensate recovered as a liquid from natural gas wells in lease or field separation facilities and later mixed into the crude stream is also included;
- Small amounts of nonhydrocarbons produced with the oil, such as sulfur and various metals;
- Drip gases, and liquid hydrocarbons produced from tar sands, oil sands, gilsonite, and oil shale.

Fig 5.- All Liquids (all the Monthly reports ranging from 2003/03 in blue to 2006/09 in red). Click to enlarge.
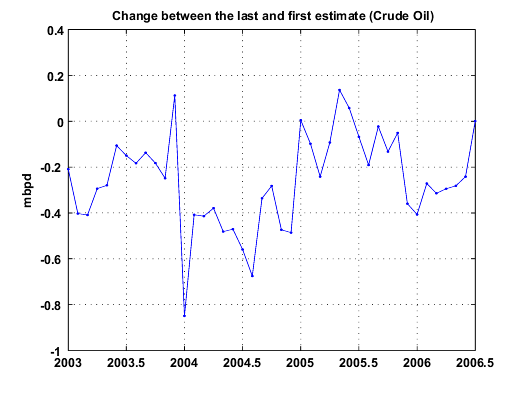
Fig 6.- Estimate change (i.e the last estimate minus the first estimate). Click to enlarge.
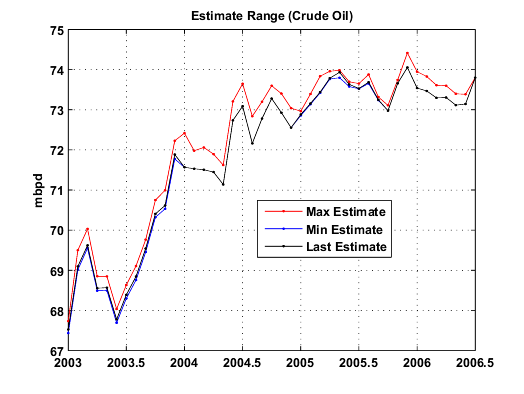
Fig 7.- Estimate range (the last estimate (2006/09) is in black). Click to enlarge.
Natural Gas Plant Liquids (NGPL)
Those hydrocarbons in natural gas that are separated as liquids at natural gas processing plants, fractionating and cycling plants, and, in some instances, field facilities. Lease condensate is excluded. Products obtained include ethane; liquefied petroleum gases (propane, butanes, propane-butane mixtures, ethane-propane mixtures); isopentane; and other small quantities of finished products, such as motor gasoline, special naphthas, jet fuel, kerosene, and distillate fuel oil.
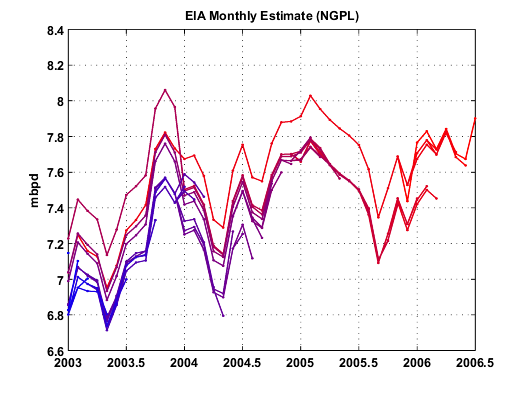
Fig 8.- All Liquids (all the Monthly reports ranging from 2003/03 in blue to 2006/09 in red). Click to enlarge.
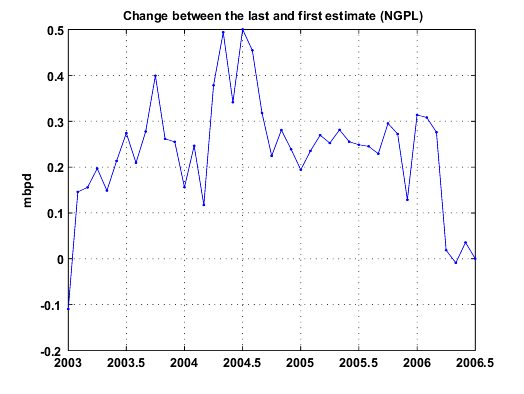
Fig 9.- Estimate change (i.e the last estimate minus the first estimate). Click to enlarge.
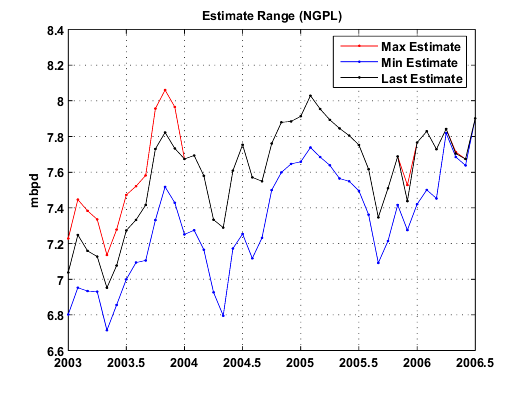
Fig 10.- Estimate range (the last estimate (2006/09) is in black). Click to enlarge.
Other Liquids
Ethanol, liquids produced from coal and oil shale, non-oil inputs to methyl tertiary butyl ether (MTBE), Orimulsion, and other hydrocarbons.
Note: There are no spreadsheets on the "Other Liquids" production. Numbers are simply derived from All Liquids minus Crude Oil + NGPL .
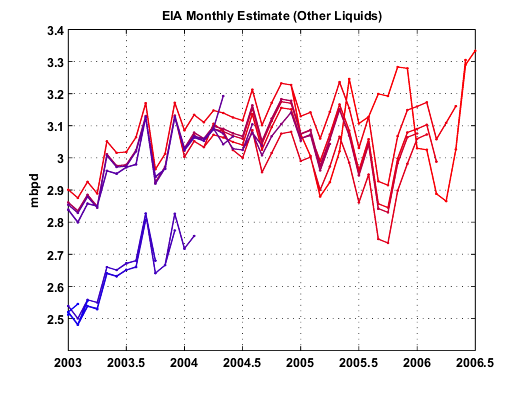
Fig 11.- All Liquids (all the Monthly reports ranging from 2003/03 in blue to 2006/09 in red). Click to enlarge.
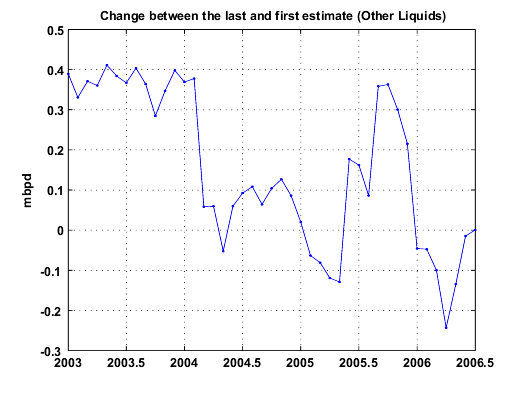
Fig 12.- Estimate change (i.e the last estimate minus the first estimate). Click to enlarge.
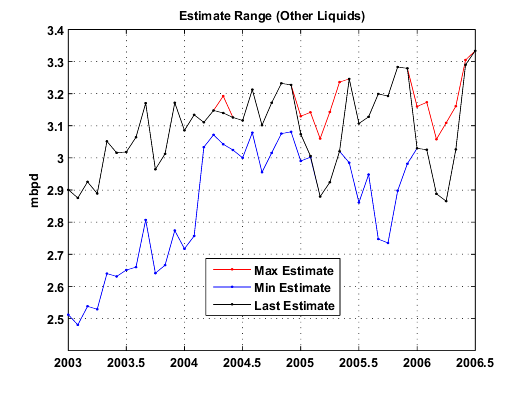
Fig 13.- Estimate range (the last estimate (2006/09) is in black). Click to enlarge.


(and yes, reddit and digg (and metafilter and slashdot and fark and boing boing) work, they bring folks over here who never would have come otherwise...)
Just to stir the pot, a copy of what I posted on Reddit:
----------------------------
Excellent work, Khebab! Information is power, and the EIA wields inordinate power. Makes one wonder how much more accurate the CIA/NSA energy statistics are compared to the EIA's data.
Bob Shaw in Phx,Az Are Humans Smarter than Yeast?
--------------------------------------------------
Reporting a fluid in volumetric units is problematic. The volume for a given mass will vary with temperature, pressure and fluid density at standard pressure and temperature. If the density of the measured mass changes, then then the barrel volume changes with the density. Many countries report production / consumption in tons. The EIA assigns ton to barrel conversion factors for each country.
See
http://www.eia.doe.gov/emeu/international/oilother.html
For Canada the ton to barrels conversion is 7.18, for Bolivia it is 7.881. The conversion factors have been periodically revised. What does this mean? Diffent API degrees? Wouldn't it be better to measure mass? Better yet, heating potential? Just what do these "barrel" measurements really tell us?
My point? Are revisions of 0.2 mmbbl/day noise in the error band or a significant revision?
We are more and more seeing oil price leaps of more than a Dollar within a day - is this "normal" in the oil market?
Has the margin been this way in the recent years (or could it be a writing on the wall of oncoming volatility?)
With this analysis it opens up the question of when you actually have a statistically valid downturn in production.
It seems to me that between 1-2 mbd downturn may be required that cannot be reasonably attributed to other causes before you can claim that we are post peak.
The OPEC decision to "cut" 1 mbpd in production seems quite convenient in 2007. Watch them up this cut go too 2mbpd over 2007 with KSA graciously taking the lead.
http://www.chinadaily.com.cn/world/2006-10/05/content_702046.htm
These so called cuts could very well hide the real peak behind
a charade for a number of years. Taking actions like this into account we may not know the real peak until we hit another price peak and production does not come back to 2005/2006 values. And at that point the initial draws could easily be on tank farms for a while.
Including external factors like this points to a requirement that we see a 3-4 mbd or a 2 mbpd drop beyond what can be covered with potentially fake production cuts before we can be assured of peak.
So the revisions in world production numbers are well below the signal we would need to see to be sure that the peak has passed.
The only alternative excuse I can come up with is global warming. Seeing OPEC cut production due to global warming would warm my heart a great deal.
The odd thing, to me, is that this cut is being widely reported in the media, yet there is no discussion about whether or not Bush is leaning on KSA to keep the taps open and let the price drop back to "normal" levels (~$40/bbl).
http://www.theoildrum.com/story/2006/1/2/19364/13876
It's about the Hotelling model of oil production (which has nothing to do with hotels and everything to do with Dr. Hotelling who invented it).
Basically Hotelling asked, how should owners and producers of oil or some other finite resource manage their production in order to maximize their profits? There's some advantage to producing quickly in order to get money up front, since money sooner is worth more than money later. On the other hand there's some advantage to waiting longer, when the resource will be in short supply and be worth more. Hotelling analyzed how to optimally balance these two effects and computed what the ideal production profile would be.
It turns out that in theory, producers should schedule production so that the price rises steadily and consistently over time. This means producing at the maximum rate at first and then gradually ramping down production (not for geographic reasons, but for economic ones). At some point the resource is assumed to get so expensive that some other resource would be substituted, and the whole thing should be arranged so that we run out of the resource just as the price rises to that point.
Ignoring the somewhat awkward fact that the history of oil production does not resemble the Hotelling model in the slightest, we might nevertheless expect that such considerations start to play a role as we move into the oil endgame. Now that oil producers see that their resource is in fact finite and will run out in the foreseeable future, they need to maximize the net wealth they can extract during the time they have remaining. And Hotelling tells them exactly what to do: adjust production so that the price rises at a few percent a year (in real terms, i.e. plus the rate of inflation - a net price increase of maybe 5-8% per year).
Short-term Peak Oil believers might argue that if this is in fact what producers wish to do, they've waited too long: they will not be able to produce at a rate that can limit price increases to this modest amount. Natural growth in demand will cause the price to increase much faster than this, and geographical limitations will prevent production from keeping up to restrain price increases.
However, Hotelling has an answer to this, which is that if a producer anticipates these events, he needs to change his strategy. Specifically, the producer needs to throttle back right now, which will cause a one-time price increase, such that he will from then on be able to supply sufficient additional oil that this much-higher price can grow at that gradual rate.
I could go into more detail about what the profit-maximizing oil producer should do who knows when he and the world will peak (this would particularly apply to Saudi Arabia), but this is getting a bit long. Suffice it to say that SA's actions are not particularly consistent with the view that they are trying to maximize their wealth and that they know that the peak is now or very near.
Some people say, nobody I know saves, everyone borrows. But remember that all borrowing comes from someone else's savings.
The reality is that most borrowing has little or nothing to do with someone else's savings.
If there are oil storages full and can be released to cover production shortfalls, then aren't these numbers inaccurate to begin with? After all, we are at least double counting if not repeat counting for oils in storage in general. Who is to say if the buyer puts it in storage and releases it as newly produced oil? They must have a way to fetter these out, right?
Actually probably not. KSA controls what they say they pumped and tankers leaving the region could easily be headed
for overseas storage.
So if one month they can pump and store and the next month the both pump and empty storage they "boost" production the second month.
This means they are pumping flat out all the time but doing production cuts as needed to refill storage.
Anecdotal evidence suggests that they are indeed pumping flat out regardless of the announced cuts and using cuts as a cover to refill storage tanks. Or at least till recently it looked suspiciously like this was the case. Now they probably need to simply start cutting production or risk damaging the fields. At say a fake cut of 500,000 mpb with 300,000 mbd still being pumped they can refill storage fairly quickly.
Notice the noble GWB is playing fast and loose with the SPR.
And as far as I know draws on the SPR do not have to be public especially lets say if they are for military use.
So even here their exists the chance that not only is Bush not refilling the SPR but that he has authorized semi-secret transfers for military use. I don't know if the military ever purchases crude directly but if it does then injection of crude from the SPR for military use is quite possible and of course need not be made public. Considering how big a user of oil the military is it would boost supplies considerably.
Here is one link of a company that sells to the military.
http://www.hollycorp.com/refineries_navajo.cfm
I'm just throwing that out as a type of game you can play with monthly production if you have a large tank farms.
It can hide real shortfalls for some time. Sooner or later
real declines will force the numbers down but you may be able to hide them for 6 months or more by playing games storage and it gives you plenty of time to think of a reason for the next "production cut".
The question is how much influence do these types of scenarios have on world supply ?
Remember the claim is 500,000mbd of oversupply was all that is needed to drop oil prices significantly.
A combination of a cooling US Housing market plus stopping the refilling of the SPR and the buildup for hurricane season might be the only reason for the current oversupply. If not additional games with tank farms may be all that's needed to ensure a short term oversupply situation. If we really are playing games with our internal production and the SPR and it ever comes to light then you know KSA is doing it.
If this is really happening expect production numbers to drop of quite a bit say next fall at the latest.
I like a lot of your opinions, but conspiracies are not my cup of tea.
"Remember the Maine"
But I don't think there is collusion.
No I wasn't wishing that on you. I'm jusy listening to some tunes.
I like TOOL.
Hey.....
Sorrry, I got my shit turned up too loud. Way too motherfucking loud. Here that?
Say that again.
I'm just speculating about the games you could play with a large oil reserve to control prices. In reading up on the SPR some of the sales seem a bit intresting to say the least.
Considering my distrust of both the Bush administration and KSA over the oil supply I'd put nothing past them.
Look at the WMD fiasco it was a basically a lie and no one came forward to stop it.
I don't see collusion as being required just don't announce a sell. They are already playing serious games with the SPR now.
Not refilling etc etc.
Whats one more ?
Anyway its just to get people thinking about the types of games you can play with large oil storage facilities that can have a effect on the market. Both the US and KSA are in a position to play shell games with oil in storage to influence the market.
As far as the SPR goes we probably won't find out if anything fishy is going on until a Democratic president is in office. But I suspect if I'm wrong now at some point future a President will start playing games with the SPR.
Umm... lots of experts and foreign/UN officials came out and stated the WMD evidence presented by Colin Powell at the UN is a farce. Just because the public did not pay attention to them does not mean no one came forward.
"I don't see collusion as being required just don't announce a sell. They are already playing serious games with the SPR now.
Not refilling etc etc."
You do know that SPR inventories are public record and are audited. So in order to pull this off, a group of people have to be in. I am not saying it cannot be done. I am saying it does have to be presented as a national security issue. Sound familiar?
This debate will not be resolved until long after the peak has occurred. To the extent that peak is important, we shouldn't have to wait until it is obvious to everyone.
With these stresses, the US may end up like Russia or Argentina after their crashes. If this happens, oil usage will be immediately reduced, but it is not clear any real progress will be made in finding alternatives. Also, we are likely to have problems with many of the basics - food, maintining basic services, law and order, and the like.
With respect to whether to continue to hold enegy and gold ETF stocks, I think solid things, like gold, real estate that can be used to cultivate crops, and things you will need in the future are better investments. It is probably best to limit investments in stocks, bonds, and bank accounts to amounts you can get along without. I still have quite a bit in financial investments, just because it is impractical to shift entirely to solid investments.
With respect to moving to Alaska or Canada, I have read James Lovelock's recent predictions and had the same idea. I have decided against it, partly because my husband and children would be unwilling to move, and partly because of practical questions - Would too many people want to move at the same time, and there not be enough food in the north? Where would everyone get jobs? Would we be able to cultivate crops in the north in the next few years, or would it still be too cold?
For now, I have decided to make as much of each day as I can where I am right now. I cut back my work hours to 80% so I have more time for things I enjoy, and I make an effort to look for the good things in each day. I may not live as long as I would have otherwise, but I am making an effort to spend time with loved ones, and do the things I enjoy, while things are still OK. I am also doing a little Peak Oil volunteer work.
Gail
Thank you for your detailed answer. [You're welcome.] I respect your opinion. Anyone who can pass those exams has got to be smart.
Skip
But urban places served primarily by hydro are going to chug right along.
This translates to "I'm not putting my money where my mouth is, but I think you should".
Frankly, I think it is appalling, and close to criminal, to be giving people financial advice that could severely impact their life, when you know almost nothing about them and don't seem to be following that advice yourself.
Gail is presumably trained as an actuary and may be licensed under bodies that provide guidelines for the ethical and beneficial pursuit of her trade. She is apparently not trained in providing investment advice. Without knowing the individual circumstance of an individual it is impossible to provide guidance on specific investments in a way that is useful. Saying sell this and buy that just introduces a huge amount of risk for the person on the receiving end.
What if the person sells the funds and buys gold. Then gold plunges and the other investments take off. What is Gail going say? The truth: I didn't know what I was talking about when I suggested that you take a life alerting decision?
If someone said to me that they had a huge lump on their throat and asked whether I thought they should cut it out with a sharp knife, it would be irresponsible, and borderline criminal for me to just cavalierly say "yeah, cut it out", especially if when I found a similar lump in my own throat, I did took the more responsible step of seeing a doctor.
She didn't ask for my advice. I didn't ask for yours. In both cases we got it and I hope are wiser for exposure to new ideas.
I know my comment was strongly worded, but I think apt. People do make foolish investment decisions based on the advice of anonymous commenters on websites. While I haven't seen a statistical evaluation of results, I will guess they are not great.
When I see this in the future I will continue to issue what I think is a very valuable warning. Perhaps in the future I will soften the wording to "highly negligent" rather than "almost criminal". I hope that will make you feel better.
You write well. I comprendo. Gee, now I'm sorry I asked! Gail The Actuary is a very thoughtful person!!!! I have been following her comments since she first appeared. She's wonderful and I am so grateful she took the time to respond. I'm no rube (although my brothers may disagree :) and I seriously doubt whether there are any on this web site (okay, maybe I'm wrong about that). Jack you are formidable. Please everyone - Let's move on to the next topic!!! Thank you!!
Skip
I do worry a lot about investment advice flug around as these decisions are very personal and have great consequences. They depend on what portion of one's saving we are talking about, when they might need to money, what level of risk thay are willing to bear and how they view the future.
I do want to continue to caution people about making investments based on what they hear on the web. In the future, I will try to be a bit softer about it.
It's okay. I did read her response closely as you did. It seems to me the folks on TOD are brighter than the average Joe (although I'm definitely on the lowest rung of the scale :) Please don't worry about me. I am grateful Gail The Actuary took the time out of her busy schedule to respond. Thank you for your concern. [You're welcome.] I appreciate that as well.
Skip
Excellent point, all the more reason to support Matt Simmons's pleading for full worldwide energy audits and data transparency. My hunch is TPTB will resist full data disclosure.
Bob Shaw in Phx,Az Are Humans Smarter than Yeast?
If you look at the crude production plot, we have basically stayed with a narrow range of about two mbpd between about 72 and 74 mbpd, since the second quarter of 2004, and 12/05 is still the highest on record so far.
I realize that we have seen plateaus and production declines before, but this is the first one that corresponds to the 50% of Qt mark (Deffeyes' crude + condensate estimate) and we have seen the highest nominal crude oil prices in history after 12/05.
I am going to post two graphs of the same data - US monthly oil production from 1969 to 1973. Remember that the peak of US production was in 1971. Remembering this, notice how hard it would have been to know you were at peak from looking at the raw data. The only other thing that told you were at peak was Hubbert's calculations. I think these two graphs are relevant to today's world. When I have time this weekend I will attempt to graph the monthly production for the world the same way since 2004.
The current trend shows us headed to about 3 trillion total barrels of recoverable oil. To be at the 50% mark, we technically need to have produced 1.5 trillion barrels, or about 480 billion more then we have globally thus far. Interestingly enough that 480 billion barrels of oil at 30 billion barrels use per year puts the peak approximately 16 years off into the future...or around 2022. Pretty close to the consensus estimates of a peak production around 2020...
You can see Khebab's plot (and his vertical scales) in this article: http://www.energybulletin.net/16459.html
Having said that, is this an exact science? Of course not.
However, are various regions consistently showing linear progressions? Yes.
IMO, we are past conventional crude + condensate production for five reasons: the HL model; Ghawar; Cantarell; Burgan and Daqing.
I don't think that it is reasonable to expect to see rising production when we have credible evidence that the four largest producing fields are all declining or crashing, and as Deffeyes predicted, world crude + condensate production has so far been below its 12/05 production level every single month of 2006.
This a link to a crude + condensate plot for the North Sea that I did. Again, you see a little change in the slope before the peak: http://static.flickr.com/67/158784886_5c7a813465_o.png
As I have previously described, the Lower 48 and the North Sea--vastly different producing regions--peaked at exactly the same point on the HL plots, and as predicted by the HL model, the production trend has been steadily downward in both cases.
The world HL plot is showing a consistent linear progression since 1984 or so. Every plot of total liquids that I have seen, including Laherrere's Stuart's and Khebab's, shows a total liquids Qt of about 2,200 Gb or so. Laherrere is taking three (3) data points at the end and using an exaggerated vertical scale to suggest a possible Qt of 3,000 Gb.
If you use a more appropriate vertical scale, which puts the last three (3) data points in their proper perspective, this "anomaly" disappears. Note that Khebab used a consistent vertical scale on his four HL plots in the article I referenced.
This method works because we find the big fields first, regardless of whether it's Texas, the Lower 48, the North Sea, Saudi Arabia or the world.
Did Deffeyes predict a peak in late 2005? Yes.
Is world crude + condensate production below the 12/05 number? Yes.
Do we have credible reports that the largest producing fields in the world are declining or crashing? Yes.
Saudi Arabia in 2005, was at the same stage of depletion at which the prior swing producer, Texas, peaked.
Is Saudi oil production down since 2005? Yes.
Is 99% of the population in denial, or unaware, of Peak Oil? Yes.
I strongly suggest that everyone take a look at Khebab's world plot (at the above link), if you want to see where these points really fall. Note that Khebab uses a consistent maximum P/Q limit of 0.20.
Note that to incorporate the 1978 datum, I had to use a maximum vertical limit of 0.50 on my North Sea plot.
And you STILL keep ranting on about how crude production is down, bla bla bla bla bla. Crude production is following the same pattern it has for over a century, slight swings up and down with a general upward trend that sometimes takes a few years to manifest itself. There have been 2 such 'plateus' in the past decade alone.
SA also recently anounced it was going to expand its production potential by 2.5 milloin bpd. It would take Ghawhar declining at 25% per year to offset this additional production. And do you honestly believe that that is the case?
KSA can announce all that they want to. Producing and announcing are two different things.
In regard to CO2, we have tried that in Texas. Did it help? Yes. Did it reverse the decline? No.
Considering Canada is the #1 supplier of hydrocarbons to the US, I think it prudent that we disect the newly released Energy Outlook here: http://www.nrcan-rncan.gc.ca/inter/publications/peo_e.html.
Initial indications are... nothing to see here folks, move along.
Peakie Whatie???
Thxs for the link, I will study more later. Makes one wonder if Nafta had never been imposed by TPTB: how much further along the US might have been in terms of relocalization and permaculture labor shifts.
Bob Shaw in Phx,Az Are Humans Smarter than Yeast?
I spend so much of my time rounding you up - I swear to God - I am going to torture the fuck out of you next time - just to get you to chill out. We'll see how it feels.
Decline of conventional oil is acknowledged and it is expected that non-conventional i.e. tar sands will be 80% of total oil production by 2020 at 2.9m bbl/pd.
Note that the bulk of this so-called 'oil' will be derived from in-situ production takes huge amounts of NatGas - which as Simmons has oft noted - is a stupid, stupid idea.
And speaking of NatGas... take careful note of this line (CBM being coal bed methane) on p.37:
"As conventional gas resources deplete, CBM is projected to become an important component: it will supply about 12 percent (620 Bcf) of total natural gas production in 2020. If CBM is not developed at this rate, there will be implications for Canadian exports."
This amazing statement is made of course on the further assumption that a thriving domestic LNG industry will also be contributing to the overall supply picture 4 years hence.
No worries though... NatGas will be $6.50 per Mcf in 2020.
The first major US brokerage firm to say saudi Arabia may reaching peak production. Also pointing out that the market is far tighter than last year.
http://www.raymondjamesecm.com/industry_1300_main.asp?indid=71
Click on link to "Energy Stat of the week" on above page.Direct link doesnt work.
Leanan and Darwinian should read this. They might learn something.
If we look at the cumulative shortfall in average crude + condensate production since December, we have produced (subject to revision) on the order of 142 million barrels less oil than if we had simply maintained the 12/05 production level.
Have we seen similar declines before? Yes.
Is this the first decline we have seen since crossing the 50% of (crude + condensate) mark? Yes.
This is not a new occurance, it happened twice before in this same decade. It was worse both of the last times. I'm going to start with one graph here.
In the absence of Stuart, I will probably have to continue. I can only thank God that Leanan isn't watching anymore. These facts would burn holes through the back of her eyes.
Sincerely,
Spokesman for all Vampires
What happened to Stuart ??
This is from a few months ago. I'm updating it shortly, but don't bother looking that up. It'll give you a stroke.
By Anna Raff
Of DOW JONES NEWSWIRES
NEW YORK (Dow Jones)--U.S. energy major ConocoPhillips (COP) and EnCana Corp.
(ECA), Canada's largest hydrocarbons producer, said Thursday they will spend
$10.7 billion over the next decade to boost Canada's oil production and deepen
its access to the U.S. market.
The companies, via a pair of joint ventures, aim to increase the output of crude
oil from two of EnCana's projects in Alberta's oil sands, a region where the oil
is heavy and difficult to refine, and expand the capacity of two of
ConocoPhillips' U.S. refineries to process the crude.
Canada is already the largest exporter of crude oil to the U.S. The deal deepens
ties between the two countries at a time when multinational energy companies are
facing increasingly hostile governments in oil-rich countries such as Venezuela
and Russia, where ConocoPhillips has a joint venture with producer OAO Lukoil
Holdings (LKOH.RS).
The joint ventures also address the issue of refining capacity in the U.S., which
is unable to produce all the fuel it needs. Analysts also have pointed to the
need to boost global capacity to process the heavy grades of crude that account
for much of the world's marginal supply.
For ConocoPhillips, the second-largest refiner in the U.S., the deal locks in
reliable supplies and gives it more exposure to Canada's oil sands, an
increasingly popular energy investment destination that's expected to see crude
oil output triple to 3 million barrels a day by 2015. For EnCana, the agreement
secures a home for burgeoning oil sands oil production as well as distributes the
risk of new developments, many of which aren't considered profitable at oil
prices below $40 a barrel.
ConocoPhillips shares traded 1.9%, or $1.10, higher at $57.88. EnCana shares were
3.5%, or $1.56, higher at $45.96.
Production, Refining Partnerships
Under the agreement, ConocoPhillips and EnCana will operate two partnerships on a
50-50 basis. The Calgary-based production partnership involves EnCana's Foster
Creek and Christina Lake projects and will be run by the Canadian company. The
companies aim to increase output of bitumen - a tar-like substance that has to be
separated from the sand - to 400,000 barrels a day from 50,000 barrels a day by
2015. This is estimated to cost $5.4 billion.
The other venture will involve ConocoPhillips' Wood River refinery in Roxana,
Ill., and its Borger, Texas, plant. The two companies plan on spending $5.3
billion to expand heavy oil processing capacity at these facilities to 550,000
barrels a day from about 60,000 barrels a day by 2015. As part of the investment,
total throughput at these plants will increase by a third.
The agreement to create the joint ventures is the latest strategic move by
ConocoPhillips CEO Mulva. ConocoPhillips closed earlier this year on its $36.5
billion acquisition of North American natural gas powerhouse Burlington
Resources, just as gas prices began an extended decline.
"This is not 'Bigger is better,'" said Mark Gilman, an analyst at the Benchmark
Company in New York, who has disagreed with some of ConocoPhillips' prior
transactions. "This one makes an awful lot of sense for both parties."
ConocoPhillips may defer some previously planned investment into upstream, an
industry term that refers to exploration and production, to accommodate the
EnCana deal, Mulva said during a conference call, reaffirming ConocoPhillip's
target of 3% annualized growth in crude oil and natural gas output between 2006
and 2010.
By the end of 2007, ConocoPhillips will have finished "several billion dollars"
worth of asset dispositions as it seeks to rebalance its portfolio, he added.
More Spending From EnCana
The ventures will require between $100 million and $200 million in additional
spending by EnCana before 2008 but will be self-funding afterward, EnCana Chief
Financial Officer Brian Ferguson said during a separate conference call.
"It's not material," Ferguson said. "It's in the $100 to $200 million range
different than what we otherwise would have invested if we were still in
go-it-alone mode."
EnCana had originally planned to partner with U.S.-based independent refiner
Premcor, but Valero Energy Corp. (VLO) pulled out after it acquired Premcor in
April 2005. Since then, EnCana has conducted negotiations with a range of
candidates, including Marathon Oil Corp. (MRO), Koch Industries Inc. (KOH.XX) and
BP PLC (BP).
Underscoring the Midwest's move toward Canada as a crude source, BP last month
said it would invest $3 billion between 2007 and 2011 to upgrade its refinery in
Whiting, Ind., to allow it to raise the amount of Canadian crude it processes.
ConocoPhillips and EnCana's agreement to expand both crude oil supply and
refining capacity comes as oil futures have fallen below $60 a barrel from their
July high of $78.40. Although the companies agreed to the joint venture assuming
an oil price above $50 a barrel, the project should remain profitable even at
$40, Ferguson said.
Canadian crude usually trades at a large discount to the light, sweet benchmark
crude oil whose futures trade on the New York Mercantile Exchange due to its
poorer quality and limited access to the U.S. market. While this poses a
challenge for the upstream part of the business, the downstream - or refining and
marketing side - benefits from buying cheaper feedstock and then selling refined
products at prevailing market prices.
Pipeline Bottleneck
For years, Canadian crude was limited to the U.S. Midwest due to the lack of
pipelines to other parts of the country. Not only have pipeline companies
expanded the amount of crude that can flow into EnCana's traditional market,
they've also extended as far south as Cushing, Okla., and Nederland, Texas.
Two companies, Enbridge Inc. (ENB) and Altex Energy, are considering the
construction of pipelines that would go straight to Texas, avoiding the
circuitous route that currently takes U.S.-bound Alberta crude through the
Patoka, Ill., hub. These projects are expected to start pumping after 2010, and
it's unclear whether they'd be built close enough to Borger to serve
ConocoPhillips' refinery there.
Whether even more Canadian crude will find its way to satisfy the voracious
energy appetite of the U.S. will depend the progress of these pipeline projects,
said Chi Chow, an analyst with Petrie Parkman in Denver.
"The bottleneck is in pipelines," Chow said. "Refiners have recognized that
Canadian crude is coming and coming in a big way."
-By Anna Raff, Dow Jones Newswires; 201-938-4426; anna.raff@dowjones.com
(Beth Heinsohn in New York and Brian Baskin and John Biers in Houston contributed
to this article.)
(END) Dow Jones Newswires
Friday, 06 October 2006 04:15:55DJN [nDJR502EC2] {EN}ENDS
What makes you asume that everyone here is a, "guy"? Show us your charts.
Are we just supposed to take your word for it? Where is your data? Can you give us a link?
You announce that a cliche is coming, and then...
...you give us one.
This is false. How much tuna have you stockpiled so far? You shouldn't be loving anything at this point.