Can Acts of God and Bush Explain the Plateau?
Posted by Stuart Staniford on January 4, 2006 - 2:28pm
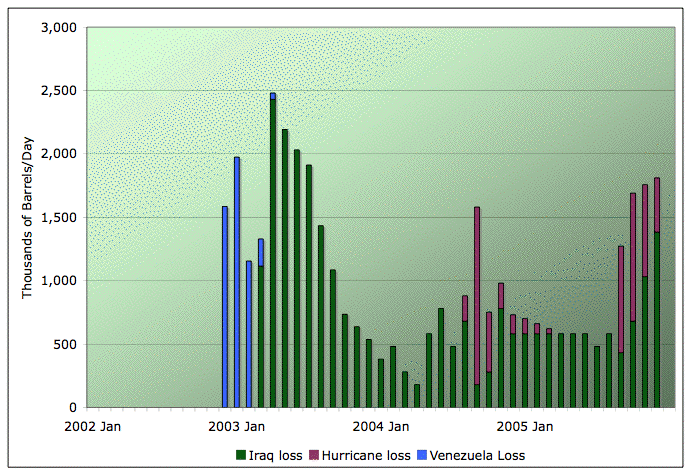
Production losses due to Iraq (Source EIA table 1.1a with production subtracted from February 2003 level), Venezuela (Source EIA table 1.1a with production subtracted from average 2002 level), and hurricanes (Source: EIA hurricane losses archive. Shut in production at mid month. Frances and Ivan shut-in eyeball-estimated from graphs.)
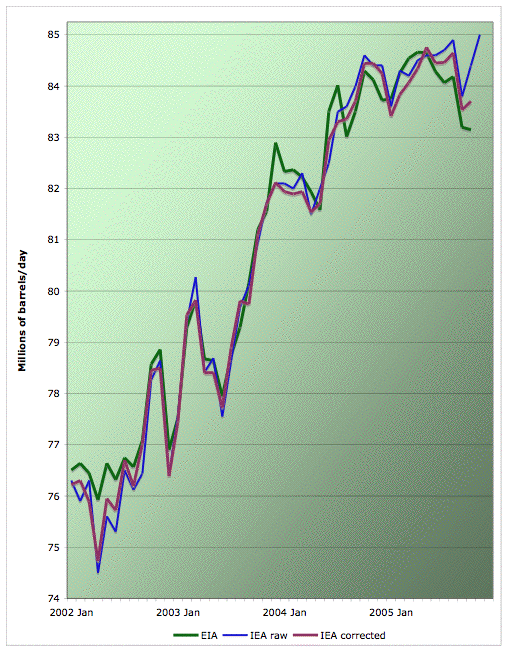
Average monthly oil production from various estimates. Click to enlarge. Believed to be all liquids. Graph is not zero-scaled. Source: IEA, and EIA. The IEA raw line is what they initially state each month. The IEA corrected line is calculated from the month-on-month production change quoted the following month.
In that discussion, our helpful contrarian Freddy Hutter argued that
Peaksters can get excited all they want watching the mid 2005 plateau and read into it what they want but the rest of us know it was hurricane and refinery related and the trendline will continue into 2010 amid the gnashing of teeth.The refinery issue we'll save for another day, but I want to examine the question of whether the hurricanes explain the plateau. However, it doesn't seem quite unbiassed to me to look only at the hurricanes because the other big accident we had affecting production in the period of interest was the Iraq war. Finally, we had some choppiness due to events in Venezuela also. As best I can recall, those were the major problems that had nothing to do with depletion but cut into production. The summary of these various production losses looks as follows:
Production losses due to Iraq (Source EIA table 1.1a with production subtracted from February 2003 level), Venezuela (Source EIA table 1.1a with production subtracted from average 2002 level), and hurricanes (Source: EIA hurricane losses archive. Shut in production at mid month. Frances and Ivan shut-in eyeball estimated from graphs.)
So what would have happened if the world had not been troubled in these various ways? Here's the EIA curve with these losses added back in:
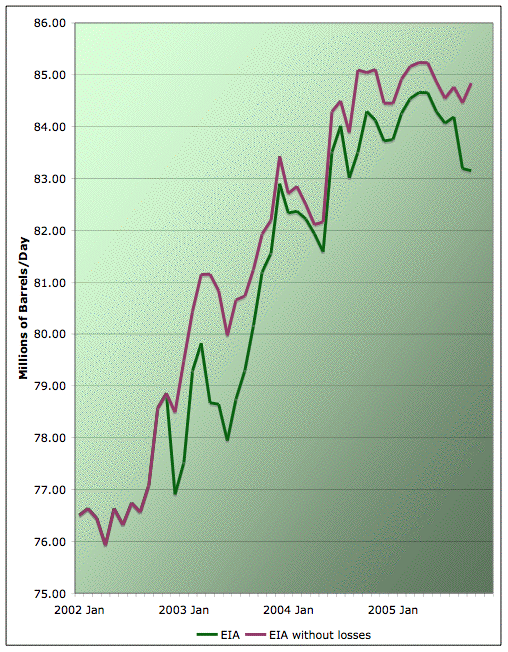
Average monthly oil production from EIA, and as corrected for geopolitical and hurricane losses. Click to enlarge. Believed to be all liquids. Graph is not zero-scaled. Source: EIA
As you can see, if the various problems had not have occurred, we would have had more oil and slightly less volatile supply. However, the plateau shape doesn't go away. If anything, it's a little more pronounced. So I think to argue that the recent plateau is explained by hurricanes is to select only those factors that fit one's desired outcome. Looking at the broader picture, the plateau cannot be explained by the acts of God and Bush.
Contact
- Content: editors at theoildrum dot com
- Tech support: support at theoildrum dot com
License

This work is licensed under a Creative Commons Attribution-Share Alike 3.0 United States License.
Bob Shaw in Phx,AZ Are Humans Smarter than Yeast?
Russia is the one we should watch extra closely.
Aren't the hurricanes and typhoons due to increased greenhouse effect from China's increased industrial base from US outsourcing that started in the 1980's as US oil peaked?
In any case, you raise good points. Many of the factors mentioned are depletion related, tangentially anyway. Why are we in Iraq? Not to free the Iraqi people, that's for sure.
And we can surely expect war and unrest to increase as the effects of depletion spread.
In this overall picture, I don't know if the individual behaviour of such or such country will matter a lot : an increase or decrease in production in one point can and will be compensated by another event elsewhere. This is the effect of international competition modulated by random events.
I'm looking forward on how you will integrate the refining capacity into this picture. Will you try to show that this is or not a factor in this actual plateau ? I don't believe that the constraint of refining capacity is the main facteur in the 2005 production plateau because if this would be teh case, the crude price should drop dramatically while endproducts should become very expensive or not ?
In theory it would work as you say, but in reality the decision-making entities involved react in real time to the situation.
This is a good example of why I'm so unhappy with many of the static analyses (both optimistic and pessimistic) I see about energy issues--there is very often just one little, buit ever so critical, detail missing from the model that makes all the difference.
(And please don't take this as a criticism of you, Cherenkov. I'm talking about the extremists from the ends of the bell curve here, not the ration TODdlers.)
My impression is that Freeddy Hunter's view of the world is not as far from your as some of the doomsters here, it is just more to the conservative side. If you could plot the range of opinions here on a chart, I think the "end of the world as we know it" contingent deviates from your analysis more than Feddy does.
Decline rates will be the key and I am less sanguine on that than you currently seem. My brain is semi-functional atm so I haven't responded on Dave's "The Extraction of Exhaustible Resources" which could be the most significant post I've read here. I fear what that implies, and think it will be = steeper than expected.
Like infrastructure, the economy is less flexible and adaptive than you presume, though that lesson may be a year or two ahead in its knowing - laws which appear true in an equillibriam state are sometimes found wanting when that equillibriam is disturbed.
So, I do not think the optimistic demand and supply projects from EIA, IEA and others will be met. Rather, I think we will make do at a lower level of consumption and production. I agree that a nasty short-term set back is a distinct possibility. I also think it is likely that the impacts are not uniformly distributed. I don't see a global crash, but do expect that those who are more dependent on cheap oil (McMansions/SUV owners, Some Asian economies) will be hurt worse.
However, I am still optimnistic enough to think that the ignorant will be hurt less than the overreacters.
The banking sector is built upon the fact that energy must be increased in order to keep the system going. What will people do when those few years of the so called "economic growth" are gone...and we are in a long depression? Things today are much different than in the 1930's. We won't be able to ramp up the industrial factories or build large infrastructure projects...as the cheap energy will not be available.
If one's idea is to make as much money as possible before the collapse really starts to take place....buy a small farm in the country as well as gold and silver...I don't know what a few more years of economic growth will do to people who want to live a long life and watch their children grow.
The world, at about 50% of Qt, is precisely in the middle of the range between the Lower 48 peak, at 48%, and the North Sea peak, at 52%. These two regions have shown irreversible declines post-peak.
Hold on to your hat. IMO, it's all downhill from here.
Dr. Robert Hirsch spoke to Global Public Media and expresses his concern about the probability that we are beyond the 20 year threshold of expedited remediation and technology switchover. We simply do not have enough time to provide a smooth transition.
http://www.globalpublicmedia.com/interviews/615
Looking into the future, it is the assumed successful and consistent production from these numerous but small sources (mbpd for eg. Chad, Mauritania, you name it) that makes everything work. When CERA or other optimists make their predictions, there is always this large category for new supply called "Other". I for one tend to worry about that with respect to the "world" peak for oil production and I'm sure you do too.
best,
- this "other" category has little impact on world predictions (vis-a-vis Hubbert Linearizations)
- or it does have some impact in the short (but not longer) term
My view is in accord with your own but I wish I knew more about these other small countries which individually are marginal suppliers but added up all together are claimed to be a major source of new supply--at least according to some well-known consultants who shall remain nameless -;) Just looking at megaprojects and large declines in big oil provinces is only part of the story. I myself have held onto a bias that tends to ignore those hundreds of millions of barrels available in off-shore Mauritania. I haven't (and still don't think) they matter at all in the big picture. I think it's worth raising the issue in any case. By the way, in Bubba's post on non-OPEC production, it is apparently predicted by his proprietary source that we can see a rise in Ecuador's production. I'm so glad! We are saved!best,
Aparently Brazil's crude oil will peak around 2010. We are geting crude oil under hard conditions, our oil come is offshore and the new fields are under 1000 meters water, so the new fields will not give their oil cheaply or easily. When you need to use robots and not humans for make the under water work the exloration cousts will not get down. My guess that the thecnology limit for offshore exploration can go to 3000 meters under water, but that will be not possible economically (the cousts will be prohibitive, the crude oil need go to US$ 1000 price before you can have profit exploiting oil under 2000 - 3000 meters under water.
So, CERA's predictions for Brazil are plainly wrong. My guess is that other CERA's predictions for the small countries are plainly wrong too.
However, ethanol and biodiesel will not save us. We can MAYBE produce enough ethanol from sugarcane to mantain our automobiles. I have no idea how much biodiesel we can produce, but we are trying use oil from native tree species that have a higher oil production than soyan beans. I am not sure if will work.
I fear that the ethanol and biodiesel prices will follow the crude oil's prices, so the biofuels will only make sure we have no shortages (I hope), but we will have a lot of economic pain.
Moreover, our electric power come mostrly from hidroeletrics power generators and not from termeletric generators. So, oil and gas prices will not affect too much the eletricity prices here at Brazil. But we will need build more hidroeletric generators and there are not enought rivers where we can build dams out the Amazon Basin. I think that can be a good idea we go strongly for eolic power, mostly because our semi-arid Nordeste is a good place to build wind turbines (and maybe some solar energy too, few rain there). I suspect that nuclear energy will be not a solution for Brazil, mostly because it is not wise substitute a finite non-renewable energy suply for other finite and non-renewable energy supply. We don't have too much money, so can be better we use the few money we have to build wind turbines than build expensive nuclear reactors. By the way, what we will do with the nuclear waste?
João Carlos
Sorry my bad english, my native language is portuguese.
I know, Simmons is making a point about the total demand and its long-term consequences, i.e. he's taking the "geologic viewpoint," not the short-term "market viewpoint." That's perfectly valid, but I very often hear people cite these kinds of numbers and make the logic error of saying, "Price and demand both went up, so demand is price inelastic." That's only true if you adjust the demand for changes in all other non-price factors (including economic and population growth, businesses shifting some energy demand from NG to oil, etc.) and still see no decrease.
Barron's: What about the argument that demand will adjust to meet supply?
Simmons: The likelihood of demand stopping is zero, unless we have a bird-flu pandemic. Demand is still accelerating. For the top 25 emerging markets, GDP [gross domestic product] change year-over-year is averaging up 5.5% for 25 countries. Argentina is 10.1%. Chile is 5.2%. China is 9.4%. Hong Kong, 8.2%. India, 8%. Indonesia, 5.3%. Malaysia is 5.3%. The Philippines is 4.1%. Singapore is 6%. Embedded in that is a continuation of an inexhaustible increase in the use of oil, particularly in the countries where they are barely using any oil. The wealthier they get, the faster they start using oil. The idea that $60 oil is really hurting the emerging economies is a myth. It doesn't seem to be affecting them at all. The Energy Information Administration numbers that came out recently showed the U.S. crossed 22 million barrels a day of petroleum use, a brand new record. So it is not stopping the U.S., either. To everyone's surprise, the economy grew by 4% in the third quarter, even with the hurricanes. That was when we had almost $65 oil.
When the EIA and others report "demand" levels, they are really reporting consumption levels. Sometimes this can differ slightly from reported production levels due to small build-ups or draw-downs of stored oil, but that is mostly just a matter of technical definitions.
So how do you tell a demand-driven peak from a supply-driven one? I would suggest that you look at the price. In a supply-driven peak, there is desire for oil that cannot be met. This will drive the price up. In a demand-driven peak there is ample supply but people don't want it (perhaps due to an economic slowdown). This will drive the price down.
Unfortunately it's not clear how to apply this heuristic in today's volatile environment. Suppose oil production/consumption falls next year but the price also falls to say 50. This is a lower price than the last few months but is much higher than the last few years. So is this a somewhat delayed response to continued tight supplies? Or is it a short-term drop in demand due to other economic conditions? It could be interpreted either way.
The recent "plateau" in production/consumption however did definitely occur in the context of near-record high prices, so I'd say it makes most sense to interpret it as a supply-based plateau. (Note however that this doesn't mean we've "reached the peak" because there are longer-term effects on both the supply and demand side which could change things in the next few years.)
This looks like as good as any place to post this. I've learned a lot from this site, and there have many different looks at the data that all seem to point to the same result. Well, here's another one. I've been playing around with a supply-demand analysis for a while now, but haven't had the time to get it in digestible form until I caught this miserable cold and could stay home for a couple of days. I decided to try to look at this in the context of the traditional supply and demand curves from college economics. Looking at the data from EIA, I charted the following:
Demand has increased since 1983 in a very linear fashion. This can be represented in the graph below by a steady shift in the demand curve from left to right as we come forward in time. Also, at any given time the demand for oil is very inflexible; price has little effect on consumption. In my own experience, I can cut out the impulsive run to the hardware store on the weekend, but I still have to get to work every day. This makes the demand "curves" quite steep for any point in time. To try to get a ballpark WAG on what the slope might be, I looked at the data around Katrina, when we had a price spike of close to $10, and a consumption reduction of about 0.87 MNbbl/day, for a slope of about $-11.50/MbblPerDay. I have represented this slope below for every two years historically, then every year for 2006-2010. The supply curve, until the late 1990's, has been pretty flat - producers have been willing to just pump more oil with little or no increase in price, to appease the shift in the demand curve. But if PO exists, and we are close to or at that point, then supply has an upper limit, so the supply curve starts to go vertical. I've shown two scenarios. First, if we extrapolate the production increase from 2004 to 2005, out to 2010, we hit $95 per barrel at 2010. If we assume a peak rate of production of 85 Mbbl/day, then we hit $100 per barrel in 2008. Both scenarios assume no demand destruction; however, I've only increased demand by 1.54 Mbbl/day per year for 2005-2010. EIA predicts a demand increase of 1.7 Mbbl/day per year, so one could argue that there is some demand destruction built in.
So you proved that recent geopolitical/weather events have not a significant impact on the large time scale shape of the production curve. They are rather acting like noise around the trend which is maybe driven by the geological constraints we are expecting. It also shows how important is the Iraq production compared to Hurricane disruptions. However, as dicussed in a previous thread (November IEA global production) these bumps in the production curve have been observed many times in the past and were due to temporary drop in demand growth (Asian flu, recessions, etc.). But without hard data on demand, how do we know for sure that this time this plateau is a consequence of a problem on the supply side?
3rd quarter 2005 GDP was still strong at 4.1% (in the US).
I think it is too early to see if 2005 is a particular year. Reductions in productiom growth seemed to have happened in the past despite strong GDP growth.
It seems that your graphs are wrongly labeled in the x axis. The years should be what's there less one.
Got the O&GJ data for 2005? We're all anxious.
I remember a couple of years ago a major U.S. city had one of its supply pipelines rupture. Gasoline supply was reduced immediately by 33%. Prices skyrocketed, 2 hour lines formed at gas stations, people sold 5 gallon jugs of gasoline for $20...
As I remember it, the problem more stemed from hysteria - not only did supply shrink, but demand almost doubled (everyone in an SUV was topping off the tank, people horded gasoline in their backyard). Does anyone see this happening on a national level? Once people become PO aware will they change their consumption patter, or install a 500 gallon holding tank in their backyard? Did the fact that even I filled up before the hurrican contribute to the problem more than the loss of supply?
The aphorism says that only death and taxes are inevitable but that's not true. Necessarily, we can look forward to more "acts of God" and geopolitical disruptions of supply. Your graphed data show the effect clearly--the production is lower and the shape is the same. Leaving God out of this and regarding Human Stupidity as a constant, I would say that the resulting increase in scarcity makes fights over resources more probable as time marches on. This can be viewed as a positive feedback loop.
Unfortunately, "acts of God" are no longer all created equal. On the one hand, there are tsunamis due to plate tectonics. We can't do much about that. On the other hand, there are hurricanes where due to anthropogenic climate change, humankind would appear to be giving God an assist.
In contrast, from 2002 on we've basically had strong and increasing growth in the economy (until possibly the very end of last year but the jury is still out on that). Certainly through Q3 2005 we know US GDP growth was strong, European growth was no less than usual, and China/India was strong. Thus any plateau must be from the supply side (as I think you agree), and that is the phenomena of interest to me in this series of posts.
You are of course at liberty to make your own graphs and post them in comments :-)
Don't forget the effects of the 9/11 terrorism.
http://omrpublic.iea.org/supply/iq_cr_ts.pdf
it appears that Iraq ramped up production during the oil for food program reaching capacity in mid 1999. After this capacity (fields in production whith no new development?) has declined fairly steadily at 7-8% per year. I would give the insergency much credit for the reduction. The disruptions after the March 2004 are smaller than than the interuptions before the war.
Iraqi oil production is not significant until actually needed to prevent a shortfall in (US) supply. The US is happy atm to use it as a punchbag to draw out terrorist attacks. Once the supply becomes important it will make the facilities more secure, increase production and take more direct control over them. Consider Iraq as the US's oil 'freezer'. But things rarely go according to (neocon) plan.
Right now, you have ambiguous data: high prices coupled with very high refinery utilization.
Anyone agree? Disagree?
Not only does the strategy you outline avoid the building of refineries that will be idled post-peak, but it helps constrain supply and push up price pre-peak. This enhances the oil companies' profits, and it also helps the world by sending a price signal pre-peak that will help restrain demand and therefore slightly delay and lower the peak.
(This phenomenon is also why I think that even though a strict application of mathematical analysis works well for individual fields or regions, it won't be as successful when applied to the world as a whole. The world situation is recognizably and predictably unique, which changes the behavior of the large, powerful decision-making entities in the system.)
As they say, follow the money. Or in this case, the lack of investments.
So, demand is affected more for gasoline in the long run (years) as price goes up than by short spikes. If this is correct, demand is still decreasing from last year's increase in oil prices.
Source - Introduction to Economic Analysis by R. Preston McAfee, California Institute of Technology, pp. 2-30 and 2-31
I will be very interested in reading your thoughts on demand elasticity. Thanks for provoking me to read up on this stuff in the first place!
Besides, we have the question of substitutes. Oil can be substituted with other fuel in heating, industrial use, power generation (worldwide there are many power plants using oil). About 30% of oil is used for other purposes than transport. 1 - 2% changes in the oil supply can be offset by other fuels - if they are available and the price is right. This affects the demand elasticity and the effect is different in different countries.
Since Bush talks to God, then aren't acts of Bush the same as acts of God?