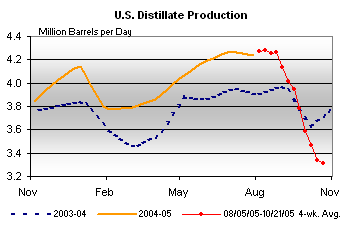
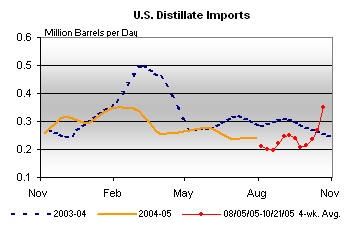
The leaves and data are changing . . . .
Posted by Heading Out on October 29, 2005 - 6:30pm


It begins to appear that the refineries are switching around and that the EIA are now showing not only a swing upward in production but an increase in imports as well - perhaps not before time. But then all the folk who will need fuel in the North East have already stocked up ! Right ?
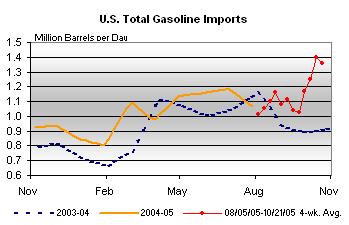
On the other hand, with gasoline imports, it looks as though we have come to the end of the lollipop. While the curve so far from the EIA shows only a slight kick over, but, remember that these are four week averages.

When one goes to the actual numbers the drop was from 1.54 mbd to 1.027 mbd. This could signify that we are at the end of the loan volume, which, since the refineries aren't up to full production yet, is a concern. Certainly there are enough stocks at present, and with the inability to refine beyond a certain point there is more than enough crude to meet the refinery demand, if not the demand beyond it.
This, I suspect, may be where the juggling begins.


In my opinion, by the end of the winter we could have a situation where crude stockpiles are far from zero, but low enough that refineries are having trouble getting all the crude they need to run at close to full capacity. Of course, we have the SPR, but it would make more sense to tap it for short-term disruptions rather than drain it all winter long. It may be that upcoming times are far worse than any individual disruption could ever be, but in that case it doesn't make much sense to drain the SPR immediately.
If we have consistent crude drawdowns of more than 5 million b/d, the price of crude would likely soar. Therefore, inventories might not get dangerously low, but only because prices went up dramatically. That is the job of the free market. On the other hand, if the price of refined products were to soar in lockstep, the refineries would have no incentive to slow their runs until they absolutely have to.
Thanks in advance.
To use - just download the zip file, unzip in a directory, then run the PeakProj.exe file. Nothing is installed on the PC. To remove, just delete the files.
ftp://polydee-instruments.com/pub/peak-viewer.zip (this file is about 1.2MB)
Screenshot:
This is a project in progress, I would welcome any suggestions, email is on the about dialog.
Have fun plotting the future.
But I think you are right about the fourth quarter and 1st quarter 06 probably should follow in a similiar vein. MMS reports more than 71 million barrels lost till now in gom Estimates of total production loss range from 125 -200 million barrels total. Then there is also the number not reported. BP's flagship thunderhorse now comes on about 6 months later. Assuming 10000bl per day thats 18 million barrels lost in 2006. Damaged rigs are using shipyard time which could otherwise be used to build more rigs. Doesnt look good. Doesnt look good at all.
I was wondering if someone could comment on the pros and cons of the two oil numbers. In my opinion, the best oil number is crude oil + condensate, 73.6 mbd in July according to the EIA.
If we include NGL's, the number increases to 84 mbd in July. The latter number is the most frequently used number.
The EIA refers to the smaller number as "oil production." The larger number is "oil supply."
By the way, both numbers are basically flat, from 7/04 to 7/05, i.e., according to the EIA, we were showing zero growth in oil production/supply year over year (just before the hurricanes).
I was wondering with suhc high Natural gas prices can companies choose to directly sell NG rather than make NGL with it? Of course in North america only.
October looks like it has been a busy month moving oil out of the SPR.
http://www2.spr.doe.gov/DIR/SilverStream/Pages/pgDailyInventoryReportViewDOE_new.html
Note there are even November numbers. Can anyone explain that one to me?
Is this why crude stocks built over the last few weeks?
Do you know what they mean by 'Exchange'? The 'Drawdown' is an obvious figure, but why is the 'Exchange' figure sometimes negative? What is the difference between a negative Exchange and a Drawdown?
Also, look at the Exchange figures for March to May next year! How on earth can they know what is going into the SPR so far out?
This may be how they know what to expect incoming.
Coul be wrong.