Tech Talk - The Potential for Saudi EOR
Posted by Heading Out on June 3, 2012 - 9:55am
Without getting into the discussion of the other aspects of the site, it was interesting to read a post dealing with future oil production on “Watts Up with That” today, in which it is suggested that the forthcoming fall in Saudi oil production will presage the decline in overall global oil production. (The site has won the “Best Science” weblog award the past two years).
The relevant quote is
The next big one to tip over into decline will be Saudi Arabia.
And, if you have been following this series, then you will understand the basis on which I make the observation that this is, in fact, incorrect. The site uses a plot by Euan (without the link) from back in 2007, though it is credited to 2008.
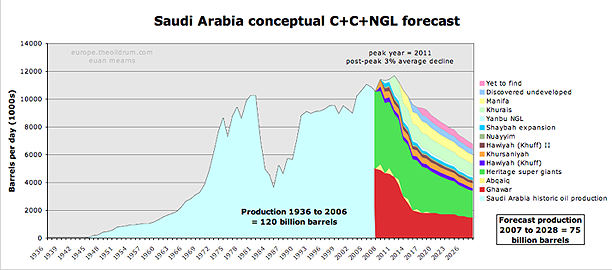
One of the reasons that I am writing the current OGPSS series is to see how the earlier estimates that we made “back when” are playing out, and for reasons I have explained both in earlier posts and below, Saudi Arabia is likely still a couple of years away from peaking. No - to finish the opening thought - the major player who will tip over first is much more likely to be Russia (of which I have written earlier) than the Kingdom of Saudi Arabia (KSA). Very simply, Russian producers will likely yield back global production leadership to the KSA soon, (though presently still slightly ahead). Further, since they run on maximizing current production rather than overall field yield, they are not doing the necessary steps to sustain future production, a growing characteristic of the KSA operations.
There are a number of different examples to illustrate this, as I have documented earlier. In addition the KSA seems increasingly interested in developing the enhanced oil recovery (EOR) techniques that have helped other fields in the latter stages of their lives.
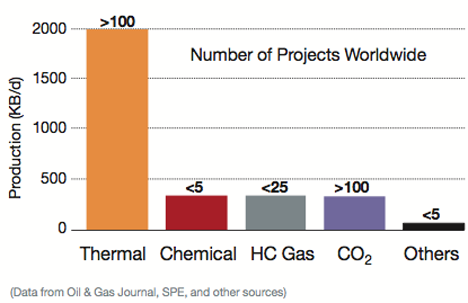
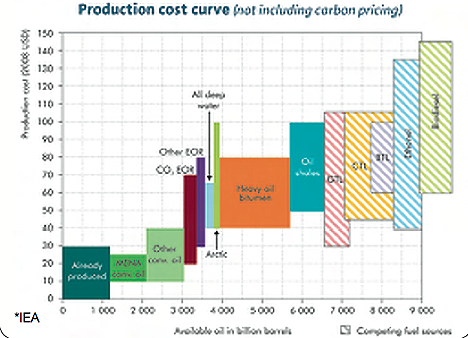
As Aramco note, as the price of oil has risen, so the economic viability of EOR technologies covers a greater range of options.
Traditional CO2 injection, for example, can enhance overall field production by perhaps 18% or more.
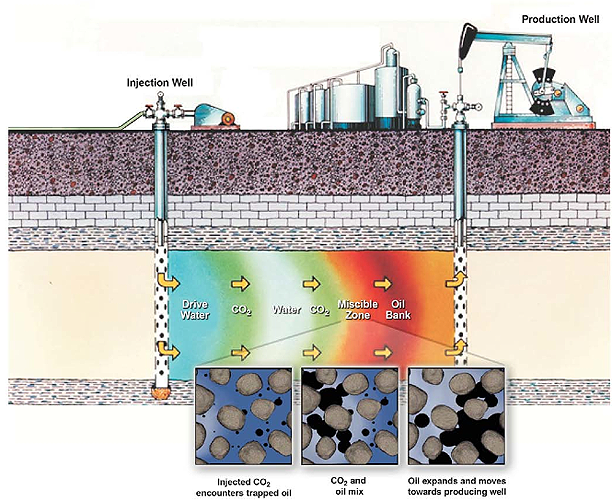
DOE notes
In WAG injection, water/CO2 injection ratios have ranged from 0.5 to 4.0 volumes of water per volume of CO2 at reservoir conditions. The sizes of the alternate slugs range from 0.1 percent to 2 percent of the reservoir pore volume. Cumulative injected CO2 volumes vary, but typically range between 15 and 30 percent of the hydrocarbon pore volume of the reservoir. Historically, the focus in CO2 enhanced oil recovery is to minimize the amount of CO2 that must be injected per incremental barrel of oil recovered, especially since CO2 injection is expensive. However, if carbon sequestration becomes a driver for CO2 EOR projects, the economics may begin to favor injecting larger volumes of CO2 per barrel of oil recovered, i.e., if the cost of the CO2 is low enough.
And how effective can it be? Consider this plot of production gains in the Wasson field in West Texas.
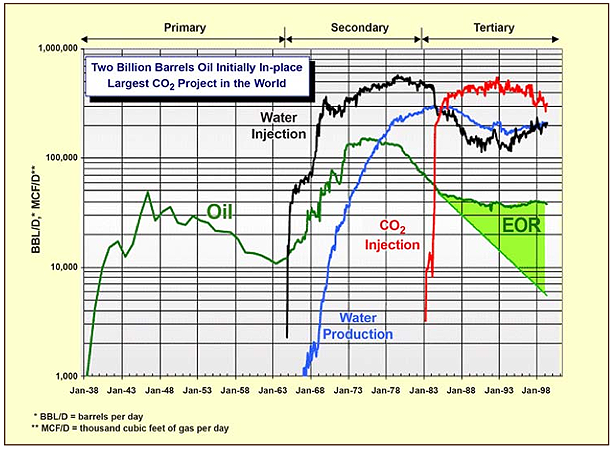
Note that the DOE reported that in 2008 the industry was injecting 1.6 bcfd (billion cubic ft/day) into Permian Basin fields to produce 170 kbd of oil.
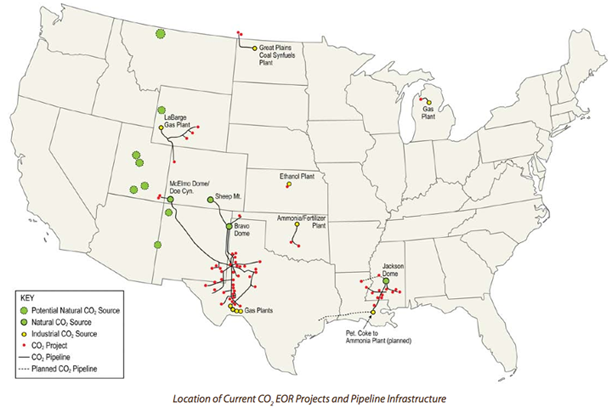
It is worth noting that the KSA initial site is being set up to inject 40 million cubic ft/day (mcf/d), some 2.5% of the US volume, into 7 wells in the initial pilot project in Uthmaniyah, so that the initial gain in KSA production may well be quite small, but there are additional CO2 sources in country which, should the pilot show to the gains potentially possible, can be tapped and which could significantly change the overall ultimate recovery of oil from Ghawar (and others). Further, there is ongoing research into enhancing the performance of CO2 in EOR that will likely pay off in the medium term.
In regard to the SmartWater flooding the first field injections have been successful, and a full scale demonstration is now planned. The advantages for this change are considered to be:
• It can achieve higher ultimate oil recovery with minimal investment in current operations (this assumes that a water- flooding infrastructure is already in place). The advantage lies in avoiding extensive capital investment associated with conventional EOR methods, such as expenditure on new infrastructure and plants needed for injectants, new injection facilities, production and monitoring wells, changes in tubing and casing, for example:
• It can be applied during the early life cycle of the reservoir, unlike EOR.
• The payback is faster, even with small incremental oil recovery.
A BP study (Lager, A., Webb, K.J. and Black, J.J.: “Impact of Brine Chemistry on Oil Recovery,” Paper A24, presented at the EAGE IOR Symposium, Cairo, Egypt, April 22-24, 2007. Also Strand, S., Austad, T., Puntervold, T., Høgnesen, E.J., Olsen. M. and Barstad, S.M.: “Smart Water for Oil Recovery from Fractured Limestone: A Preliminary Study,”) showed the following incremental gains over conventional water flooding.
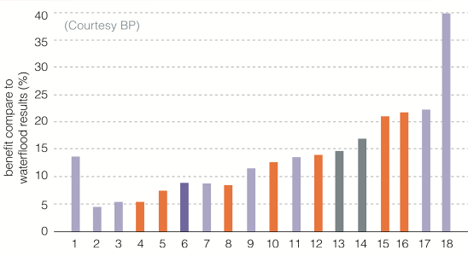
The current areas of investigation have extended into dealing with the tar mats that are present in parts of Ghawar.

Current research is aimed at extending wormholes into the formation, through which it will be possible to pass different EOR treatments in order to further improve the extraction rate from the field.
When these current projects in their various stages are combined with the future production from Manifa, and enhanced production from Safaniyah, I expect that the Kingdom will continue to produce at around 10 mbd for at least a few years more, though I continue to doubt that it will be able to increase much beyond that. After all, even when field declines are held to 2% a year, after 50 years the arithmetic starts to take an increasing toll – Ghawar began production in 1951.
And so, with respect, I disagree with David Archibald, if only in the short term - but for those of you with a few minutes, the comments that follow his post at WUWT are quite entertaining.


According to ELM, Saudi consumers are a causing an increasing dent in Saudi exports over time. Some say the switch from oil power power plants to Natural gas in Saudi arabia will mitigate the decline. However, they are building still building heavy oil powered power plants. We all know that SA is having trouble selling heavy oil because no one wants to invest in the refining capacity. Has anyone split the export land model (ELM) into light vs heavy oil? I wonder if all this heavy oil production is masking the problem.
Realist, the article you link to is misleading, probably because the author did not know any better. But all oil burning power plants can also burn natural gas. I worked for two years at Ghazlan #1 power plant just north of Ras Tanura from 1980 to 1982. That was well before they built Ghazlan II. Back then they had almost enough gas to power the country. We burnt gas about 28 to 29 days a month. But we burnt oil at least one day a month. We could also burn any liquid petroleum product. Occasionally we would burn naptha, apparently because the refinery at Ras Tanura produced an excess of it.
Of course oil and gas used different burners. The gas burners just injected gas directly into the boiler from the boiler wall. But the oil burners telescoped out into the boiler and injected the oil as a spray.
Anyway all the power plants and thermal desal plants in Saudi can burn either oil or gas. Also, the plants could burn straight crude of bunker oil. Bunker oil is a refinery product and is much heavier than crude because all the lights, gasoline, diesel and such, have been removed.
Ron P.
perhaps they were burning mostly gas in the 80s but a recent post on TOD (link?) showed the source of Saudi electricity at 50% gas and 50% oil. If oil is worth so much more than gas, why would they burn oil? If it is just heavy oil that no one will buy, that makes sense. Bad news for the importing nations that want light oil.
Has anyone plotted heavy vs light exports over time?
They burn oil for the simple reason that they don't have enough gas. And there is no such thing as "heavy oil that no one will buy". Heavy oil is discounted anywhere from a couple of bucks per barrel to up to $30 a barrel for oil from the tar sands. Saudi heavy oil would likely be discounted at around $15 a barrel but I don't have the exact figures.
They burned mostly gas in the 80s because they did not need nearly as much electricity back then and they had enough gas, back then, to produce all the electricity they needed.
Saudi is spending billions on developing Manifa. It is supposed to produce 900,000 bp/d and it is all heavy oil.
Ron P.
I do not believe such a graph exists outside Aramcos HQ.
Have they found enough natural gas? By what I understand, they've had difficulty finding enough natural gas to meet their desired demand.
Meanwhile, there is that pesky problem of net exports, especially the disconnect between the Saudi net oil export response to a doubling in global annual crude oil prices from 2002 to 2005, versus their response to the doubling in annual global crude oil prices from 2005 to 2011.
Annual Saudi Net Oil Exports (total petroleum liquids, BP) for 2002 to 2011 (with an estimate for 2011):
Ratio of Saudi production to consumption (total petroleum liquids, BP) for 2002 to 2010 (with an estimate for 2011):
In any case, on the production side even the EIA, which has recently had significantly more optimistic production numbers than other sources like BP (for Saudi Arabia) and the Texas RRC (for Texas) shows 2011 annual Saudi crude oil production below the 2005 rate, and the EIA shows 2011 annual total petroleum liquids production the same as 2005.
My guesstimate is that BP will show annual Saudi 2011 total petroleum liquids production at about 10.8 mbpd (versus 11.1 mbpd in 2005), with consumption of about 3.0 mbpd, resulting in net exports of about 7.8 mbpd in 2011, versus 9.1 mbpd in 2005.
If we extrapolate the 2005 to 2008 rate of decline in the Saudi P/C ratio, it suggests that Saudi Arabia would approach zero net oil exports around 2031, which suggests* total post-2005 Saudi Cumulative Net Exports (CNE) of about 40 Gb. Cumulative Saudi net exports for 2006 to 2011 inclusive were about 17 Gb, putting estimated post-2005 Saudi CNE at about 43% depleted at the end of 2011.
Note that an extrapolation of the initial three year rates of decline in the IUKE (Indonesia, UK, Egypt) net export decline case histories indicated combined estimated post-peak CNE of 4.6 Gb.
Actual combined post-peak CNE for the three IUKE countries were 4.6 Gb.
Indonesia P/C graph for 1991 to 2004:
http://i1095.photobucket.com/albums/i475/westexas/IndonesiaPoverC.jpg
If there is anything that it is more overlooked than "Net Export Math," it is the fact that net export declines tend to be "front-end loaded," with the bulk of post-peak CNE being shipped early in the decline phase. A fairly consistent rule of thumb is that about half of post-peak CNE are shipped about one-third of the way into a net export decline period. In other words, a relatively low initial net export decline rate obscures a sky high CNE depletion rate.
For example, I estimate that the 2005 to 2011 rate of decline in annual Saudi net oil exports was about 2.6%/year, but I estimate that the post-2005 Saudi CNE depletion rate--the rate at which we consumed the total post-2005 estimated supply of Saudi net exports--was about 9.4%/year.
*Post-peak CNE Estimate = (Annual net exports per year at peak X Estimated number of years to zero net exports X 0.5, to get the area under a triangle) less annual net exports at peak
Evenin' Jeffrey,
re: "In other words, a relatively low initial net export decline rate obscures a sky high CNE depletion rate."
Could you possibly please add another sentence or two to explain the significance of "sky high CNE depletion rate"?
Is the meaning of this the following: that the decline in CNE alone is not enough to give an accurate picture of what "zero in 2031" actually means?
For the naive reader - (that would be yrs. truly) - "zero in 2031" is hair-raising enough all by itself. Is there something I'm missing here?
Or, is it simply that looking at the CNE depletion rate adds an element of "reality check" to the picture, something like: "when it's gone, it's really and truly gone" - ?
re: Est. P/C 3.6 for 2011: 1) To what do you attribute the difference between the "projected based on 2005-2008" number - (i.e., according to the graph projection it should be more like 4.2? Yes? or...something - ?) - v. the 3.6?
2) What is the meaning and significance - (i.e., what is the implication, if any) - of this difference?
re: Then, just to try to cover all the bases: the naive reader keeps staring at the "net oil export" inflection points that correspond to 2008 and 2010. 1) To what do you attribute these? Something like: "spare capacity...but not all that much spare capacity" - ?
and 2) When do you expect the next inflection point for that "net oil export" line to occur? i.e., turn downward.
Re: Post-peak CNE depletion
Here is a link to the Export Land Model (ELM), assuming a production peak in the year 2000:
http://i1095.photobucket.com/albums/i475/westexas/Slide1-17.jpg
Peak Year (2000): Annual Net Exports of 365 mb, with post-2000 CNE (Cumulative Net Exports) of 1,382 mb (100% of post-peak CNE remaining)
I've broken the nine year net export decline period into thirds.
Post-peak CNE less annual net exports = Remaining post-peak CNE (mb)
2001: 1,382 - 318 = 1064 (77% of post-peak CNE remaining)
2002: 1064 - 274 = 790 (57% of post-peak CNE remaining)
2003: 790 - 230 = 560 (40% of post-peak CNE remaining)
Three years into the net export decline period, production had fallen by 14%, annual net exports had fallen by 37%, and post-2000 CNE had fallen by 60%. Most analysts would only focus on the 14% decline in production, but in only three years the total post-peak cumulative supply of (net) exported oil had fallen by 60%.
2004: 560 - 190 = 370 (27% of post-peak CNE remaining)
2005: 70 - 150 = 220 (16% of post-peak CNE remaining)
2006: 220 - 110 = 110 (8% of post-peak CNE remaining)
Six years into the net export decline period, production had fallen by 26%, annual net exports had fallen by 70%, and post-2000 CNE had fallen by 92%. Again, most analysts would only focus on the 26% decline in production, but in only six years, the total post-peak cumulative supply of (net) exported oil had fallen by 92%.
2007: 110 - 73 = 37 (3% of post-peak CNE remaining)
2008: 37 - 37 = 0 (0% of post-peak CNE remaining)
2009: Zero annual net oil exports
A fairly consistent rule of thumb appears to be that one-third of the way into a net export decline period, around half of post-peak CNE have been shipped.
Following are some graphs looking at Global Net Exports (GNE) and Available Net Exports (ANE, or GNE less Chindia's net imports):
2002 to 2010:
http://i1095.photobucket.com/albums/i475/westexas/Slide09.jpg
2002 to 2020 (assuming 0.1%/year production decline rate):
http://i1095.photobucket.com/albums/i475/westexas/Slide10-1.jpg
2002 to 2020 (assuming 1.0%/year production decline rate):
http://i1095.photobucket.com/albums/i475/westexas/Slide11.jpg
Here are some CNE projections (based on extrapolating 2005 to 2010 rates of change in C/P ratios) for key countries and regions:
http://i1095.photobucket.com/albums/i475/westexas/Slide5-2.jpg
Note that you can either extrapolate C/P or P/C. As an oil exporting country approaches a 1.0 P/C ratio, they approach zero net oil exports. Regarding Saudi Arabia, if we extrapolate the 2005 to 2008 rate of decline in their P/C ratio, they would have been at 3.73 in 2011. I estimate that the BP data base will put them at about 3.60 in 2011. In other words, even with a year over year increase in production, I estimate that the 2008 to 2011 rate of decline in their P/C ratio was faster than their 2005 to 2008 rate of decline.
The bank balance model.
Assume that you deposited $55,000 into a bank account in the year 2000, and then immediately withdrew $10,000. One year later, in 2001, you withdrew $9,000, a year after that you withdrew $8,000, and so on.
I’ve broken the annual withdrawals into thirds:
Post-2000 Bank Balance - Annual Withdrawals = Remaining post-2000 Bank Balance
2001: $45,000 - $9,000 = $36,000
2002: 36,000 - 8,000 = 28,000
2003: 28,000 - 7,000 = 21,000
Note that the annual withdrawals were only down by 30% in 2003 (-12%/year), versus the 2000 withdrawal, but the post-2000 bank balance had fallen by 53% (-25%/year). In other words, the bank balance was falling at twice the rate that the annual withdrawals were falling.
2004: 21,000 - 6,000 = 15,000
2005: 15,000 - 5,000 = 10,000
2006: 10,000 - 4,000 = 6,000
Note that the annual withdrawals were only down by 60% in 2003 (-15%/year), versus the 2000 withdrawal, but the post-2000 bank balance had fallen by 87% (-34%/year).
2007: 6,000 - 3,000 = 3,000
2008: 3,000 - 2,000 = 1,000
2009: 1,000 - 1,000 = Zero
As shown above, the rate at which the bank balance was falling considerably exceeded the rate at which the annual withdrawals were falling. In a similar fashion, I believe that the rate of decline in post-2005 global cumulative supply of (net) exported oil (estimated at about 5%/year) is much higher than the rate of decline in global annual net exports of oil (1.3%/year from 2005 to 2010).
...using this model we are only 18.5 years away from zero exports from KSA -a country that relies almost entirely on oil exports to feed its 27 million inhabitants of which;
"...9 million are registered foreign expatriates and an estimated 2 million are illegal immigrants. Saudi nationals comprise an estimated 16 million people..."
(Source: http://en.wikipedia.org/wiki/Saudi_Arabia
"Oil accounts for more than 95% of exports and 70% of government revenues, facilitating the creation of a welfare state[9] although the share of the non-oil economy is growing recently")
-As it becomes clear that those lines are converging (how long will that take???) I think it likely that KSA will 'impose measures' in an effort to eek out its oil exports for as long as possible. This is going to include all the usual scaling back on gas guzzlers, moving to nuclear and renewables and gas, etc. -I.e. all the stuff that the ROTW will have been attempting for even longer...
Without the income to placate their population at some point the whole pack of cards might simply implode at which point KSA becomes another "US-Protectorate Zone".
Regarding CO2 injection:
Where would one find natural sources for CO2 in Saudi Arabia? In the US some CO2 comes out with the natural gas produced, so it is free; or it is produced at power plants like Great Plains project in North Dakota.
If the Saudis have to make CO2 (by burning natural gas), this Enhanced Oil Recovery method is costly and contributes to climate change/global warming. Also, some energy is expended to compress the CO2 for injection (pressure must be greater than "down hole" for this to work). Water injecgtion does not require much energy to inject since it is nearly incompressible.
Should oil prices drop to below $70 per barrel, as some energy analysts are now predicting, some of these techniques may not be financially viable and KSA production would likely decline, IMO.
I have often myself where would Saudi get C02 to inject. Found this:
Saudi Aramco to use CO2 to boost Ghawar oil field output by 2013
Okay, so they are going to get it from two gas processing plants but how does the gas processing plants generate it? Is C02 a by-product of processing natural gas? Does C02 come up with the gas?
Of course C02 can be generated from burning gas but that would seem strange, burn gas just to get the by-product of C02. Of course the fermentation process also produces C02 but I seriously doubt that is how they do it.
I can find dozens of ways via Google to generate C02 for your greenhouse but they all involve burning something or just melting dry ice. No help there.
Ron P.
I guess that the gas processing plant uses methane to power the operations. Since combustion of pure methane produces pure CO2 and water they could simply dry the exhaust to obtain the pure CO2.
I think you are talking about a gas turbine. I have no idea how one would capture the exhaust from a gas turbine. I know combined cycle power plants use it but they don't really capture it, they just pass it through a boiler. However these are not LNG plants that would likely generate their own power. These are gas plants that separate the methane from the ethane and NGL gasses such as propane and butane. They don't generate their own power, they just get it off the grid.
Saudi does not export liquefied natural gas.
Ron P.
Sounds like they are producing it from the gas plants that process the nat. gas coming from local wells. Some natural gas wells produce CO2 besides the methane and natural gas liquids. The gas plants separate the CO2 from the well gas stream and will use it for EOR instead of releasing it directly. However, this is not sequestering the CO2, just using it for oil field pressure drive where it comes out with the oil produced from the well, IIRC.
Associated gas in Saudi Arabia contains as much as 17% CO2, and non-associated gas (Khuff) around 3.5%. That is why they can source it from the Uthmaniyah Gas Plant. From those percentages, one could calculate how much they could theoretically get from these sources.
In any case, I think this is more of a PR stunt than anything. This was first announced at an environmental conference and touted as sequestration.
And how dothey doit in the US? According to the map up in the article, they use CO2 pipelines. Is the source of US CO2 for example coal mills? It would make sense to use it as such (if CC effects are neglected).
In Louisiana the source is refineries or petrochemicals plants, I THINK as a byproduct of hydrogen production from natural gas (see earlier remarks @ steam reformation).
Alan
One of the Technology Innovation Centers funded by the Saudi National Science Lab - KACST - was at KFUPM on Carbon Capture and Sequestration. This center is looking at 3 potential technologies for carbon capture:
Their stated sources are:
Some of it seems academic wishful thinking, but on a follow-up visit I was surprised to learn that Saudi Aramco had become very interested in carbon capture from automobiles and had funded an associated project. At the start of the center, the team had seen this as a topic of future interest, and had only wanted to invest a small amount of resources to this thrust. But the new funding had elevated its importance. Still not sure if it is an economically viable route, but 25-30% of the hydrocarbon fuel consumption is in this sector, so perhaps it does need to be pursued more aggressively.
I never thought a WUWT article would be linked here....
Just goes to show that a blind squirrel can on occasion stumble upon a nut....
A cursory look at the comments reveals how GW and P0 denial are joined at the hip...
WUWT being a top science site has to be one of the greatest sleight of hands ever accomplished on the internet. A shining example of the creeping anti-intellectualism in the USA...
never heard of that site before - some of the replies are , uh , quite "disappointing " I was going to say shocking but I guess this is the level people are at.
When the decline in oil occurs I cannot see any of these guys "getting it " more like they'll be gunning for a scapegoat . ie getting "even"
or maybe just coming up with some "delusional" answers - rational thought is going to go out of the window!
scary indeed !
forbin
PS: as a former J6P , now a billy beer barrel , I dispair at my fellow average human thought processes...
So I finally went to the site and looked at some of the comments...
A few gems:
EVER!
Way to go, Eienstein!
Well, there you have it...way to go looking at the bright side...
Just a smattering of what I dread represents 'majority thinking' in the U.S., if not the World.
That Einstein quote just made my Quote of the Day. Now let's see how many people work out why... and how many others think i'm a little bundle of optimism for once.
It shows how prevalent the anti science ideology is among engineers, and that can infiltrate out to even people striving for a science based perspective.
Part of the problem:
http://www.huffingtonpost.com/chris-mooney/the-science-of-truthiness_b_1...
Very interesting analysis of the better educated right.
There is this thing called "anti-processing". However, since I last googled about it, a new digital photographic technique with the same name has popped up flooding the google search results, and I just can't google it up any more. Anyway, if you would manage to find it, there will be a good explanation of how we do to avoid thinking when we know thinking will lead us to conclusions we do not want.
Maybe they're right and we're wrong?
Based on the arguments and articles made against AGW and the complete and utter lack of scientific integrity on display at WUWT, the answer is fairly obvious to anyone familiar with real research....
I have to laugh that WUWT is even considered a science blog.
It's really a blog catering to mass hysteria. The guy in charge is a former broadcast weatherman.
Sir, you are much too kind. Watts is a paid shill of the Heartland Institute, college drop out, and a non-AMS certified radio weather announcer.
EDIT: Oops, forgot the link: http://sourcewatch.org/index.php?title=Anthony_Watts
"WUWT being a top science site has to be one of the greatest sleight of hands ever accomplished on the internet. A shining example of the creeping anti-intellectualism in the USA..."
Creeping?
Thanks for this interesting posting, which goes well in line with a recent statement of the former president of Shell Oil John Hofmeister, who doubts that SA can increase its output:
http://www.bloomberg.com/video/88714670-saudi-oil-supply-claim-unlikely-...
And if they are able, it's likely a poorer quality, refination-unfriendly & heavy/sour type of oil?
Where is the source material for that EIA production cost curve graph? Corn ethanol is competitive (at the lower end) with most of the 'enhanced oil recovery' setups I see... I also expect more ethanol plants and CO2 pipelines to start showing up in North Dakota if this continues.
What is probably *not* reflected in the corn ethanol cost is the tremendous reduction in cost for natural gas, which is a feedstock for both the distillation in ethanol plants, and the ammonia fertilizer. If we have a correction in farmland prices back to say $3500 an acre in Iowa, along with ammonia fertilizer under $500/ton, we could easily have $4.00 a bushel corn, which is going to contribute $1.30 a gallon to the price of ethanol.
At that point, we might as well turn the entire starch content of the US corn crop into ethanol, and feed DDG's for livestock.
As for food vs fuel, you can eat dried distillers grains and yeast extract, but you still can't eat oil.
"...I also expect more ethanol plants and CO2 pipelines to start showing up in North Dakota if this continues."
The CO2 gas produced by the Great Plains Energy project comes from a power plant (coal fired I believe) and is pumped via pipeline to old oil fields in Saskatchewan. The CO2 is helping boost production in declining conventional oil fields in Canada.
The Bakken formation in western ND and Montana requires fracturing of the shale to get oil to flow. These oil bearing rocks in the Bakken have low permeability, so CO2 injection would not increase production much. Besides the added cost of peripheral injection wells around the producing well would be cost prohibitive given the low flow of most Bakken wells, IMO.
I don't see a market for ethanol production in ND as corn production is rather low there (short growing season throughout and not enough water in the western part of the state). Besides, the market for DDG's is somewhat saturated as you can't feed cattle or hogs more than 50% DDG's due to its high protein content, IIRC. With oil dropping and nat. gas rising, while corn remains near $6/bushel, I would forecast a lot of ethanol producers having a hard time making a profit.
I have NEVER had any doubt that a variety of EOR techniques would be applied to Ghawar - innovative and very well thought through.
However, what of the RATE of production from EOR ?
I always assumed a step down in production rate when the primary wells watered out and production shifted to EOR.
The Wasson Field graph is interesting - but a sample size of one. A fairly small step down due and then stable due to EOR.
I now understand that Aramco will be able to keep extraction rates up for 2 to 5 years with attic oil and tapping into stranded oil pockets.
However, after that, it still seems to be difficult to keep the rates up. The volumes of CO2 required to produce 3 million b/day from Ghawar are staggering.
Note: AFAIK, the easiest way to generate CO2 is to separate oxygen from air and burn NG or oil in oxygen. Separate out the water (perhaps not necessary) and any other undesirable contaminants from the exhaust and inject the rest.
Perhaps a dual stream - air in, nitrogen for injection in some fields (a la Cantarell) and oxygen to burn to make electricity and capture the CO2 afterwards.
Anybody need LOTS of argon ? Or just inject it too.
Alan
"Anybody need lots of Argon..."
Yes, thousands of companies need it for production welding stainless, aluminum and high strength steel alloys. Only problem is getting it to North America or to China from KSA.
The easiest way to produce CO2 is to "steam reform" methane. This process is ubiquitous in the chemical and petrochemical industries, and its primary function is to produce hydrogen. CO2 is a by-product. Steam reforming of methane has been practiced in very large scale for at least 90 years on all continents.
An alternative for producing CO2 to steam reforming methane is to gasify coal. This is also done on very large scale on all continents and has been in commercial practice for over 100 years. It was the original source of "town gas" which was used for street lighting in many European cities before electric grids were developed.
This is very basic chemical engineering and needs no speculation on TOD.
KSA can, if it decides to, produce all the CO2 it needs to produce lots of additional oil by CO2 EOR that is otherwise impossible by continuing water injection only.
The problem with getting it from steam reform methane is they don't have any methane to spare. That would defeat the entire purpose. They are desperately short of natural gas. That is why they are burning crude oil in their power plants instead of natural gas.
Read Joules post above. That tells us exactly where they are getting it... finally:
Ron P.
"Where they are currently getting their CO2" is not the same as where they can choose to get it if they decide to use more CO2. If they do not have the option of more steam reforming of methane, gasifying coal then they can choose to "gasify" crude oil and process to ultimately produce hydrogen and CO2. This is not a common process, but it can be implemented.
If they do not want to produce more of their own CO2, KSA could choose to import CO2 by pipeline or cryogenic tank ship from other CO2 capture projects, where it is produced by steam reforming of methane or gasifying coal, or in the future, post-combustion scrubbing of fossil fuel power plants or boilers or oxy-fuel combustion processes. There are several very large projects around the globe in one of these categories in early phases of development.
When they burn't the nat gas, why not just collect the CO2 and send it down into the wells? Or the CO2 from burning bunker oil, or whatever they burn?
Hey, Heading Out actually gives us the source above. Are we blind or just lazy? ;-)
Opportunities for C02 sequestration
It is a PDF file so I cannot copy and paste. But the article points out that it is very expensive to sequester C02 from a power plant. And since Saudi is not likely to do that because they don't care how much C02 they dump into the atmosphere they are getting it from associated gas. As Joules wrote above:
And I think that should settle it. They get it from associated gas which is 17% C02. Almost all of the natural gas produced in Saudi Arabia is associated gas.
Ron P.
Not quite true, even from the Ghawar field. When producing at 5 MMBPD oil, Ghawar produces about 2 billion cubic feet/day of associated gas. Two of the gas Ghawar plants (Uthmaniyah and Shedgum) are allocated for associated gas production with a combined capacity of 3 billion. The other two plants (Hawiyah and Haradh) are designed for non-associated gas production, also with a combined 3 billion cu ft/day capacity. I can't find an actual breakdown (as opposed to capacity), but it is roughly even for Ghawar. However, associated gas in Ghawar is about 10% CO2 vs. a third of that for the Khuff non-associated gas.
I do not know how widely distributed or how extensive they are but there are reservoirs where all or nearly all the gasses are CO2. A few years back I remember reading about a test on a well in AZ that indicated the presence of a sizeable CO2 reserve that the company believed could be exported to NM or TX for enhanced oil recovery. In any event, here is a link to information on CO2 bearing reservoirs in the Southern Rockies.
http://geology.utah.gov/emp/co2sequest/pdf/co2poster.pdf
Oh great; we go for under ground CO2 resources and pump it out, while other people work on CO2 capture. Are we idiots? Well, I think I know the A to that Q.
"Oh great; we go for under ground CO2 resources and pump it out, while other people work on CO2 capture."
As I understand it, the CO2 is injected and reinjected into the oil reservoir on a continuing cycle. Most of it remains there when the EOP project is completed. Part of the article I linked to was about sequestration. Sequestration if accomplished as part of an EOR process lacks a downside unless you believe the collapse of oil production is a good thing.
Alan - Good point about EOR rates. I've studied dozens of EOR projects in detail with a wide range of results. From net energy losers to very successful efforts. But almost all the efforts have one aspect in common: it's slow. The one standout exception is in situ combustion ("fire flood") but it has limited application and often too complicated for many companies to embrace.
I've seen EOR efforts more than double a field's projected URR. But often taking several times as long to get that second half out as the first. So again that brings us back to the basics of PO: it's about rate not recoverable volume. I suspect many ME fields, especially in the KSA, have a bright future re: EOR. But not as great an impact on PO as some might expect. Wasson Field is actually a good example. Consider that it has a huge volume of EOR recovery and is the largest effort of its kind on the planet. Yet it has only managed to stabilize its production rate. Which is terrific but only means it isn't contributing to global decline while many other fields are suffering irreversable declines.
As Decarb's excellent explanation of C02 sourcing shows there's no lack of possibilities. But, as usual, it's not a question of capability but economic viability. Just my WAG but I suspect the KSA will be focusing on EOR as a way to balance the ELM situation. In that regards those efforts may be a very significant factor. Production decline is troubling enough but double dipping with ELM could quickly escalate the arrival of the very bad days.
Alan:
I agree with much of what you say, and was tempted to raise the same point in the main post - or later write another on the lines of "Saudi Arabia can't find enough carbon dioxide", just to be mischievous. The fact that there is more effort being put into these activities suggests that there is a growing need for them. I would suspect we have about a couple more years (based on previous rates of decline and what is left that is readily achievable) before life gets more complicated, and in that time frame they don't have enough infrastructure in place for these techniques to be applicable on a broader scale.