| So Foul and Fair a Day - the Impact of Earlier Icelandic Eruptions | The Oil Drum: Europe | Carbon Capture and Storage: Economic Costs Revisited |
Oilwatch Monthly April 2010
Posted by Rembrandt on April 27, 2010 - 10:28am in The Oil Drum: Europe
The April 2010 edition of Oilwatch Monthly can be downloaded at this weblink (PDF, 1.24 MB, 33 pp).
The Oilwatch Monthly is a newsletter that is available free of charge with the latest data on oil supply, demand, oil stocks, spare capacity and exports.
Below the fold is an executive summary, subscription form to receive the Oilwatch Monthly by e-mail, and latest graphics. For much more detail and a country by country profile, download the .pdf.
Subscribe to receive Oilwatch Monthly by e-mail
Latest Developments:
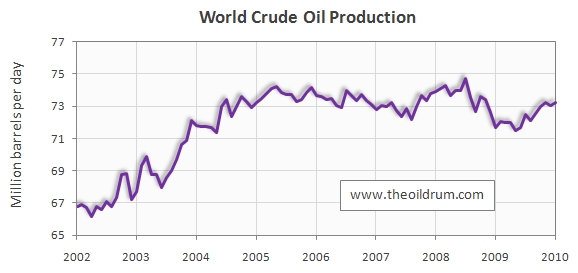
1) Conventional crude production - Latest figures from the Energy Information Administration (EIA) show that crude oil production including lease condensates increased by 190,000 b/d from December 2009 to January 2010, resulting in total production of crude oil including lease condensates of 73.24 million b/d.
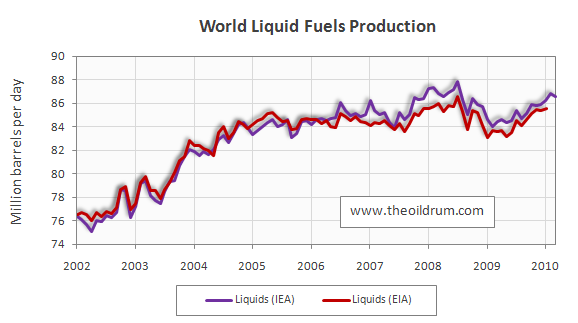
2) Total liquid fuels production - In March 2010 world production of all liquid fuels declined by 220,000 barrels per day from February according to the latest fgures of the International Energy Agency (IEA), resulting in total world liquid fuels production of 86.59 million b/d. Liquids production for February 2010 was revised upwards in the IEA Oil Market Report of April from 86.59 to 86.8 million b/d. Average global liquid fuels production in 2009 was 84.94 versus 86.6 and 85.32 million b/d in 2008 and 2007.
3) World oil production capacity - Total oil production capacity in March 2010 decreased by 200,000 b/d from February 2010, from 90.36 to 90.16 million b/d. World production capacity is measured here as the sum of world liquids production excluding biofuels plus total OPEC spare capacity excluding Iraq, Venezuela and Nigeria.
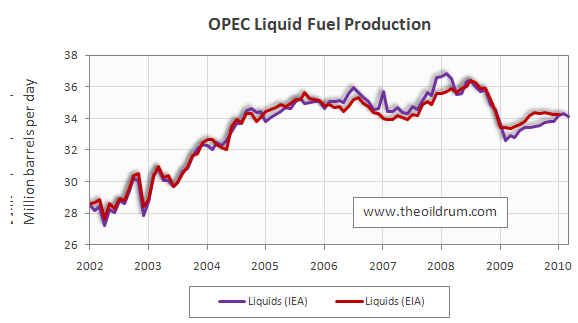
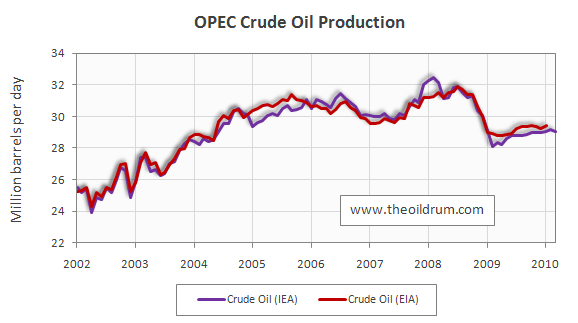
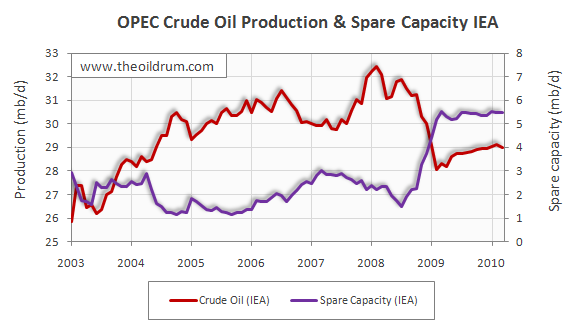
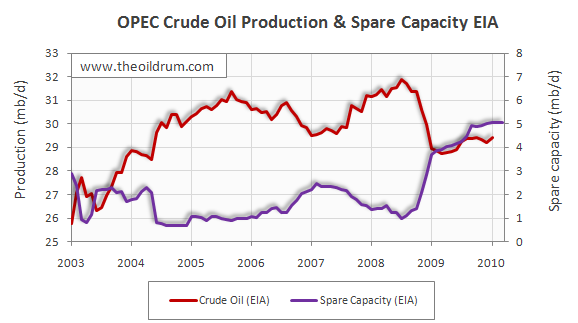
4) OPEC Production - Total liquid fuels production in OPEC countries decreased by 160,000 b/d from February to March 2010 to a level of 34.13 million b/d. Liquids production for February 2010 was revised downwards in the IEA Oil Market Report of April from 34.36 to 34.29 million b/d. Average liquid fuels production in 2009 was 33.7 million b/d, versus 36.09 and 35.02 million b/d in 2008 and 2007 respectively. All time high production of OPEC liquid fuels stands at 36.4 million b/d reached in July 2008. Total crude oil production excluding lease condensates of the OPEC cartel decreased by 160,000 b/d to a level of 29.0 million b/d, from February to March 2010, according to the latest available estimate of the IEA. Average crude oil production in 2009 was 28.7 million b/d, versus 31.43 and 30.37 million b/d in 2008 and 2007 respectively. OPEC natural gas liquids remained stable from February to March 2010 at a level of 5.13 million b/d. Average OPEC natural gas liquids production in 2009 was 4.67 million b/d, versus 4.47 and 4.55 million b/d in 2008 and 2007 respectively.
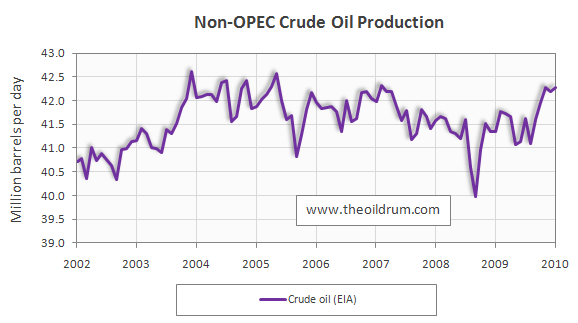
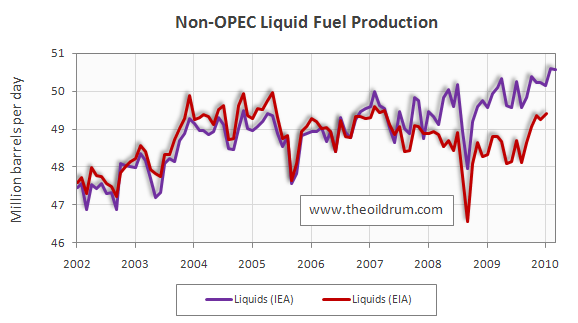
5) Non-OPEC Production - Total liquid fuels production excluding biofuels in Non-OPEC countries decreased by 50,000 b/d from February to March 2010, resulting in a production level of 50.55 million b/d according to the International Energy Agency. Liquids production for February 2010 was revised upwards in the IEA Oil Market Report of April from 50.43 to 50.6 million b/d. Average liquid fuels production in 2009 was 49.67 million b/d, versus 49.32 and 49.34 million b/d in respectively 2008 and 2007. Total Non-OPEC crude oil production including lease condensates increased by 90,000 b/d to a level of 42.27 million b/d, from December 2009 to January 2010, according to the latest available estimate of the EIA. Crude oil production for December 2009 was revised upwards in the EIA International Petroleum Monthly of April from 41.18 to 42.19 million b/d. Average crude oil production in 2009 was 41.62 million b/d, versus 41.32 and 41.80 million b/d in 2008 and 2007 respectively. Non-OPEC natural gas liquids production increased by 178,000 b/d from December 2009 to January 2010 to a level of 3.55 million b/d. Average Non-OPEC natural gas liquids production in 2009 was 3.34 million b/d, versus 3.65 and 3.79 million b/d in 2008 and 2007 respectively.
6) OPEC spare capacity - According to the International Energy Agency total effective spare capacity (excluding Iraq, Venezuela and Nigeria) increased from February to March 2010 by 10,000 b/d to a level of 5.47 million b/d. Of total effective spare capacity an additional 3.75 million b/d is estimated to be producible by Saudi Arabia within 90 days, the United Arab Emirates 0.42 million b/d, Angola 0.17 million b/d, Iran 0.32 million b/d, Libya 0.17 million b/d, Qatar 0.08 million b/d, and the other remaining countries 0.56 million b/d.
Total OPEC spare production capacity in March 2010 increased by 30,000 b/d to a level of 5.09 million b/d from 5.06 million b/d in February according to the Energy Information Administration. Of total effective spare capacity an additional 3.8 million b/d is estimated to be producible by Saudi Arabia, the United Arab Emirates 0.30 million b/d, Angola 0.20 million b/d, Iran 0.10 million b/d, Libya 0.15 million b/d, Qatar 0.25 million b/d, and the other remaining countries 0.14 million b/d.
7) OECD Oil Consumption - Oil consumption in OECD countries increased by 1.92 million b/d from January to February 2010, resulting in a consumption level of 45.02 million b/d. Average OECD oil consumption in 2009 was 43.92 million b/d, versus 46.10 and 47.68 million b/d in 2008 and 2007 respectively.
8) Chinese liquids demand - Oil consumption in China increased by 331,000 b/d from January to February 2010, resulting in a consumption level of 8.75 million b/d according to JODI statistics. Average oil consumption in China in 2009 was 8.05 million b/d, versus 6.92 and 7.29 million b/d in respectively 2008 and 2007.
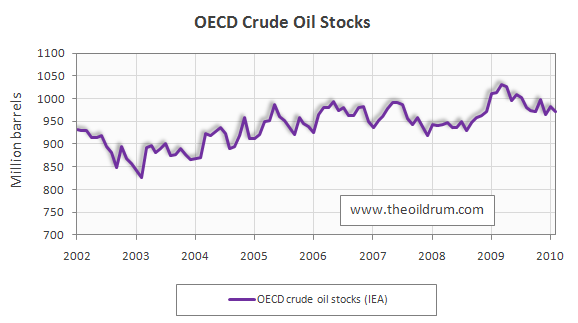
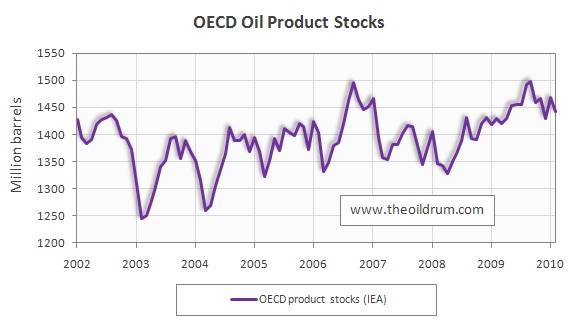
9) OECD oil stocks - Industrial inventories of crude oil in the OECD in February 2010 decreased to 972 million from 983 million barrels in January according to the latest IEA statistics. Current OECD crude oil stocks are 7 million barrels higher than the five year average of 965 million barrels. In the March Oil Market Report of the IEA, a total stock level of 979 million barrels was tabulated for January which has been revised upward to 983 million barrels in the April edition. Industrial product stocks in the OECD in February 2010 decreased to 1441 million from 1468 million barrels in January according to the latest IEA Statistics. Current OECD product stocks are 35 million barrels higher than the five year average of 1406 million barrels. In the March Oil Market Report of the IEA a total stock level of 1447 million barrels was tabulated for January, which has been revised upward to 1468 million barrels in the April edition.
Personnel
Editors
Contributors
Peak Oil Primers
Archives
- November 2010 (3)
- October 2010 (6)
- September 2010 (4)
- August 2010 (7)
- July 2010 (6)
- June 2010 (7)
- May 2010 (2)
- April 2010 (8)
- March 2010 (4)
- February 2010 (6)
- January 2010 (3)
- December 2009 (5)
- November 2009 (8)
- October 2009 (12)
- September 2009 (6)
- August 2009 (5)
- July 2009 (11)
- June 2009 (8)
- May 2009 (16)
- April 2009 (10)
- March 2009 (7)
- February 2009 (10)
- January 2009 (15)
- December 2008 (9)
- November 2008 (9)
- October 2008 (9)
- September 2008 (13)
- August 2008 (10)
- July 2008 (14)
- June 2008 (23)
- May 2008 (16)
- April 2008 (12)
- March 2008 (16)
- February 2008 (9)
- January 2008 (13)
- December 2007 (13)
- November 2007 (16)
- October 2007 (22)
- September 2007 (8)
- August 2007 (9)
- July 2007 (16)
- June 2007 (8)
- May 2007 (7)
- April 2007 (7)
- March 2007 (10)
- February 2007 (10)
- January 2007 (12)
- December 2006 (9)
- November 2006 (15)
- October 2006 (4)
- September 2006 (5)
- August 2006 (5)
- July 2006 (9)
- June 2006 (5)
- May 2006 (10)
- April 2006 (9)
- March 2006 (13)
Vital Trivia
License

This work is licensed under a Creative Commons Attribution-Share Alike 3.0 United States License.
OPEC production went down from Feb. to Mar., but their spare capacity went up? Does that mean they purposefully reduced production, and in so doing increased spare capacity? Or was it a case of reduced demand? Or do they just want more money per barrel?
Those are not mutually exclusive.
Nothing to see, move along, no problem with oil...
Oil Volatility Sinks as Shortage Concern Eases: Energy Markets
Looks like the consumption has recovered globally, if not in USA/Europe, and is climbing to the practical limit of production (not theroetical of 90 mbd), i.e. ca. 88 mbd this year or so provoking a price spike in near future, 6-12 months.
Puru Saxena on Asian CNBC, talking about PO (start about a minute in)...
http://www.youtube.com/watch?v=aiNBCyiB0XA
Practical limits are upon us, in his eyes.
Saxena says max flows of 89 mbd which is halfway between last max in July 2008 and the proposed max of 90 mbd in charts here. Saxena must read up here a lot `cause he is completely bought in to the whole PO/alt energy idea.
Anyway 1.5 mbd-2.5 mbd more consumption somewhere is bound to come along if something "strange" doesn't happen (Greece, etc.) to crash the system befor resource constraints get hold of it.
Maybe not strictly on topic but could someone explain why a price differential of $3 has opened up between WTI and Brent. Is this due to differential demand or supply or some other reason?
I'm going to hazard a guess for you and I'm sure I'll be corrected at some point if I'm wrong.
But the arbitrage spread (to which you refer) very generally indicates the direction of global crude oil shipments. If WTI is less than Brent, then as a general rule this indicates that Brent and other African and Middle Eastern crudes using the Brent price marker are mostly being shipped to North American markets (taking advantage of the price difference to make up for the shipping costs). When Brent is more than WTI, the general inference is that North American markets are slightly over stocked and there is relatively greater demand for crude in the Far East; China, India.
This interpretation would be consistent with what we've been hearing. That inventory levels are high in North America and demand is still running strong in China.
Jabberwock
Or it's just that the level of crude oil inventories in a remote corner of Oklahoma is a poor indicator of global demand.
Oh, yeah. Absolutely.
Could this be related to the January switch of KSA to a marker better suited for more sour grades of crude? I forget all the details, but that sticks in my mind.
Thanks for this newsletter...I will share this link with my company partners...useful.
very interesting to see OECD demand bounce back - and a big bounce too.
questions about price and substitution, which are really the key issues
1) what is the price of all the non crude+condensates? can we assume this gas to liquides etc advances in lockstep with crude?
2) now that the ratio between oil and Nat gas is the widest it has ever been, how real is the option for substitution and how large?
this large new volume of nat gas is the only difference between this year and the 2008 run up. when we hit the next run up, which i believe will begin in 4Q this year (people will blame it on the economic expansion) the reaction, wherever possible, will be to switch to nat gas.
this, i think, will just sustain and extend the run up in crude, but should have some positive implications for nat gas prices
I too find the consumption data interesting.
I would love to see some graphs that incorporated OECD consumption, China consumption, global production (all liquids) and price. Can someone point me to data sources?
Thanks
Chart 9 is VERY interesting. non conventional oil production
this has increased about 50% in the past 10 years - from about 8.2 to about 12.4 MBD
will this continue to increase at this rate?
could we see 20 MBD by 2020?
this is very dramatic and will have a larger impact going forward as conventional oil begins to decline
What I find interesting is that even with contributions from unconventional sources, global crude oil production showed a cumulative shortfall in the 2006-2008 time frame, relative to the 2005 rate:
Global Cumulative Crude Oil Production Versus US Oil Prices
2002-2005 & 2005-2008 (EIA, crude + condensate)
Here are the average total global crude oil production numbers per day by year, versus average annual US spot crude oil prices:
2002: 67.16 mbpd & $26
2003: 69.43 mbpd & $31
2004: 72.48 mbpd & $42
2005: 73.72 mbpd & $57
2006: 73.46 mbpd & $66
2007: 73.00 mbpd & $72
2008: 73.71 mbpd & $100
Relative to the 2002 production level of 67.16 mbpd, in the following three period, 2003-2005 inclusive, the cumulative three year increase in production was 5,164 mb, versus a three year increase in oil prices of $31.
But then we have the 2006-2008 data.
Relative to the 2005 production rate of 73.72 mbpd, in the following three year period, 2006-2008 inclusive, the cumulative three year decline in production was 632 mb, versus a three year increase in oil prices of $43
WT I take your point
If the average price in 2002 was 26, and the average price in 2010 turns out to be 85
you have a compound growth rate of 16% for 8 years.
versus a global economic growth rate of perhaps 3% per year
you can't have the core energy source increasing in price at 5X the economic growth rate
this is unsustainable, as recent events have shown
Is it possible to add the oil price to the first graph ? That would make a good praph to show to the skeptics.
The figure I find most surprising is #4--What is behind the big up tick in non-OPEC crude oil production? They seem to be a couple hundred thousand bbls from hitting a new high.
We had all thought that non-OPEC had peaked five years ago as it had be on a steady (if bumpy) decline up to a few months ago.
Were we wrong?
Keep in mind that the data tends to be revised downward after several months and sometimes years. The data is only accurate to about 1 Mb/d and should be viewed with fuzzy vision.
13/4/2010
Natural gas liquids and other liquids mitigate crude oil peak
http://www.crudeoilpeak.com/?p=1352
21/4/2010
Flight disruptions in Europe a Foretaste for Period of Oil Decline
http://www.crudeoilpeak.com/?p=1372
9/4/2010
Australian Population Scenarios in the context of oil decline and global
warming
http://www.crudeoilpeak.com/?p=1300
"Saudi Arabia's surging energy demand may significantly reduce its ability to export oil to the rest of the world in the next two decades, the head of the country's national oil company has warned."
http://www.ft.com/cms/s/0/9042a896-5193-11df-bed9-00144feab49a.html
ELM anyone?
A friend of mine sent me the same story. Pretty interesting.
I am uncertain what to make of the numbers for "spare capacity".
Firstly, what is the exact definition?
According to this post,
However, searching the EIA website I couldn't find any definition of spare capacity; and above I read "According to the International Energy Agency [...] an additional 3.75 million b/d is estimated to be producible by Saudi Arabia within 90 days".
So the two agencies appear to be using different definitions. Does this matter much? The numbers they produce obviously differ, but is that because of different definitions, or mainly uncertainty/noise?
Secondly, how to interpret the numbers.
Broadly, I can imagine three reasons to produce at less than capacity:
Taken together, 2) and 3) (producing at maximum rather than optimum, and postponing maintenance) would represent "surge capacity". In the EIA definition, surge capacity is clearly included in their "spare capacity", since it doesn't have to be sustained for more than 90 days.
Also it seems to me that it's pretty improbable that all surge capacity can be brought on at once; after all, some maintenance just has to be done. Somewhere, something just broke.
It therefore seems to me that the only real spare capacity, that is, spare capacity that is good for a (relatively) permanently increased production as opposed to a mere spike of a month or three, is the withheld production.
Perhaps a new term is needed: Threshold production. As in, you can produce above treshold for some time, but you run up a "maintenance debt" if you do so, which means that eventually you'll have to produce below threshold for some time to "repay".
Threshold production would be, roughly, today's production + withheld production; assuming, of course, we're currently below threshold.
Looking at chart 11 (in the PDF), OPEC production fell some 3 million b/d from the top in mid-2008 to the bottom in early '09.
Now, I'm willing to bet they were using surge capacity in mid-2008, but let's say it was all voluntary. It'll be two years ago this summer. If the decline rate is 4-5%, they will have lost roughly 2,5 - 3,5 million b/d capacity. So that's about even.
By this logic, I conclude that any "Withheld Production Capacity" OPEC has, is roughly equal to what they've added since mid-'08.
Now how much is that?
How believable are these OPEC spare capacity figures versus crude oil production?
Every month I look at these graphs and wonder how they are constructed and how rubbery the figures are.
Who provides the raw data? Where do the EIA and IEA get their information?
Would it be too cynical to suppose that they (or their OPEC sources) pick a number out of thin air in order to maintain the shape of the graphs so that the spare capacity/production level of crude are roughly laterally symmetrical about a gently rising near horizontal curve??
Does this apparently precise mirror imaging not bother anyone else?
Fingolfin asks:
Well, even in the best case I think it is safe to say that the fudge factor is large. Kjell Aleklett reads the OPEC Bulletin:
But then, this isn't really news, is it.
What I was trying to get at in my post yesterday, I guess, is that apart from the fuzziness the numbers have the character of "true lies". That is, they're theoretical. As in the old joke: "Theoretically means not really".
To recap and reformulate a bit, I think "spare capacity" is a misnomer. I do think the "spare capacity" is real, as far as it goes; I think they can, if Murphy wills it, theoretically bring that much production on line.
For a short time.
But, of course, Murphy rarely wills it...
I am getting concerned about the production development in Iraq:
As we know Iraq had (or still has?) extremely ambitious plans to expand its oil production, which should almost explode within a few years.
But according to the most recent IEA Oil Market Report (http://omrpublic.iea.org/) last month Iraqi crude production went down by 10%!
I hope that this is only a temporary drop out but not the sign of a trend break. Otherwise we might see that speculators not only bet against a struggling Greece but also against the entire oil driven economy...
Iraq showed a small decline in net oil exports in 2009, according to preliminary 2009 data. At their current rate of increase in consumption, their production has to grow at about 2.5%/year--just to maintain constant net oil exports.
According to Chart 23, US oil consumption has dropped roughly 2M bpd from 2007 to 2010.
According to Chart 116, US oil production has risen roughly .5M bpd from 2007 to 2010.
So, US oil imports should have dropped by about 2.5M bpd from 2007 to 2010.
But, Chart 54 suggests that imports have only dropped by about 1M bpd from 2007 to 2010!?!
Chart 54 looks like it's badly inaccurate, right?
We discussed this previously here: http://www.theoildrum.com/node/6304/603537 :
"My source is here: U.S. Imports of Crude Oil and Petroleum Products ( http://tonto.eia.doe.gov/dnav/pet/pet_move_imp_dc_nus-z00_mbblpd_m.htm ). This is EIA, the IEA number seems to be the EIA's "U.S. Imports of Crude Oil and Petroleum Products (Thousand Barrels per Day)" minus imports of Finished Products, but not minus "Other Liquids"; these latter two comprise the "Petroleum Products."
EIA absolute peak for crude oil + products imports was Aug '06 at 14697
kb/d; subtract 2028 kb/d of finished products imports from the same month and you get 12669
kb/d, close to what's on Rembrandt's chart. This may just be a methodology quirk of the IEA, like the way BP doesn't include biofuels or CTL in their production numbers for the Stat Review, but they do include NGLs, giving numbers that are neither C+C nor liquids as usually defined."
So, it appeared that chart 54 didn't include "Finished Products". That seems like an big error.
In fact I cannot see where a decreasing trend of production in the next year (and the following) may come from.
Russia seems more or less on its plateau - should stay on for few years.
Saudi Arabia has probably 1 or 2 mbd of spare capacity.
China is still increasing - should stay on a plateau for 5 years or something like that
Iran is not at peak yet, UAE neither.
And then we got the probable development of Irak - even if they don't reach their target of 10 mbd, they will probably increase their production of 2 mbd more. Brazil should increase signifcantly too.
There are some other potential increases (Algeria I guess, Kazakhstan, Venzuela on a long term point of view)
On the other side we got Mexico, North sea countries, Indonesia and probably Kuwait in the near future. Some smaller producer too. USA I don't really know.
Making the sum of this I would guess an increase up to 2015 (even for crude), more than a descrease.
Any thoughts ?
Marc
(2005) Top Five* Net Oil Exports (EIA) & US Annual Oil Pirces
2002: 20.2 mbpd & $26
2003: 20.7 mbpd & $31
2004: 23.2 mbpd & $42
2005: 23.8 mbpd & $57
2006: 23.0 mbpd & $66
2007: 22.1 mbpd & $72
2008: 22.4 mbpd & $100
*Saudi Arabia, Russia, Norway, Iran & UAE
The 2006-2008 data points are falling between Sam Foucher's middle case and best case projections, which suggests that it will take about 30 years from them to collectively go from their 2005 peak net export rate of 23.8 mbpd to approximately zero net oil exports. This suggests that by the end of 2010, the (2005) top five will have shipped about a third of their post-2005 cumulative net oil exports.
What gets a little more interesting is China & India's (Chindia's) net oil imports expressed as a percentage of (2005) top five net oil exports. Chindia's net imports were 19% of (2005) top five net exports in 2005, and at 27% in 2008 (probably at about 33% in 2010). If we extrapolate Chindia's current rate of increase in net oil imports out to 2018, and if we take Sam's best case for (2005) top five net exports, Chindia's net oil imports in 2018 would be 100% of net exports from Saudi Arabia, Russia, Norway, Iran and the UAE.
The same kind of projection shows US imports pretty much disappearing by 2018, which would dramatically improve the US's balance of trade and economy. For instance, in the 4th quarter of 2009, US oil consumption fell by 1.1% over the previous quarter, while GDP grew by 5.8%.
If OECD countries become less dependent on oil imports, and Chindia become more so, the US and Europe may hang on to their traditional central role in the world economy rather longer than we might have suspected.
re: The same kind of projection shows US imports pretty much disappearing by 2018, which would dramatically improve the US's balance of trade and economy.
There are a couple of problems with projecting that trend into the future. First of all, there are limits to how far the US can improve its energy efficiency without drastically restructuring American society (e.g. replacing freeways with electric trains), and second, the increase in production is not backed up by reserves in the ground. US oil reserves have been falling fast, and if production rates continue, the current 19 billion barrels of proven reserves will be almost exhausted by 2018.
The US needs to find a lot of new oil soon to replace its consumption, and based on the latest deepwater disaster in the Gulf of Mexico, I don't think the prospects are good. Obama's plan to open up the offshore to drilling is going to become a lot less popular when that oil slick hits the Louisiana coast.
There are a couple of problems with projecting that trend into the future. First of all, there are limits to how far the US can improve its energy efficiency without drastically restructuring American society (e.g. replacing freeways with electric trains),
I agree - see my comment below. Partly I was pointing out the hazards of this kind of uncritical projection of current trends.
US oil reserves have been falling fast, and if production rates continue, the current 19 billion barrels of proven reserves will be almost exhausted by 2018.
IIRC, US reserves have always been relatively low vs production, and yet they don't seem to have fallen in the last 40 years. Based on reported reserves 40 years ago, we should have run out 30 years ago. I have to say that the Bakken's 100:1 ratio of oil in the ground to economically recoverable suggests that there's a lot more potential with a little drilling innovation.
Have you seen a good data series of reported reserves, and how they've changed through the years?
Obama's plan to open up the offshore to drilling is going to become a lot less popular when that oil slick hits the Louisiana coast.
Can't help.
Yes, of course I have. The US Energy Information Administration would be the definitive source for U.S. Crude Oil Proved Reserves.
Just a quick summary (billions of barrels):
1970: 39.0
1975: 32.7
1980: 29.8
1985: 28.4
1990: 26.3
1995: 22.4
2000: 22.0
2005: 21.8
2008: 19.1
Notice the consistent trend? The US has less than half the proven oil reserves it had 40 years ago. Of course, oil companies find new oil every year, but not nearly as much as they produce - and far, far less than the US consumes.
In 1970 we had reserves of 39B, and since then it's dropped by about 20B, so we might expect that we would have produced about 20B. And yet...we've produced very roughly 100B.
I'm not sure those reserve numbers are very useful.
The reserve numbers are very useful, but you have to know how to interpret them. I used to do this for a living so I find the numbers tell me a lot about what is going to happen.
As I said, oil companies find new oil every year, but US companies have not been finding enough to replace consumption for the last 40 years. The US supply situation is steadily getting worse, and as you may have noticed is damaging the entire economy (although most people are oblivious of the economic forces at work).
The bigger concern is global oil supply, which is less predictable since we do not have reliable data. But the situation there is not looking good. In other words, do not count on having fuel for your car into the indefinite future. Cheap gasoline is definitely a thing of the past.
That is why you can find articles that state that in the U.S. at least 89 Gb of oil can be recovered with CO2-EOR. So Nick is right in a certain way that reserve numbers don't say a lot. Only if you dig deeper in the matter you learn about flow rates of the different types of EOR.
flow rates of the different types of EOR.
What have you discovered about this?
The reserve numbers are very useful, but you have to know how to interpret them. I used to do this for a living so I find the numbers tell me a lot about what is going to happen.
Well, what do you think is going to happen with US production? It's been showing a distinct increase lately. I'm very familiar with the general situation, but my question: how long and how much can N. Dakota production grow (where there's 400B bbls of oil, but only 5B bbls that are economic to recover at this moment)? How long can places like Kern River continue to defy the odds? How much can we find in old fields in Texas, as has been done lately? What's the effect of the dramatic drop in dry holes due to better imaging?
We need current, inside info from people working in the field - what can you tell us?
From the EIA data I would say that the US is producing more oil out of a smaller and smaller resource base. This is caused by high prices, which encourage companies to produce as much oil as possible as fast as possible. However, unless they find new reserves, they are risking a steep fall-off in production in the not-too-distant future. The Bakken Shale and Kern River fields are not exactly new, Texas has been drilled to death, and Alaskan production has been falling steeply. Much of the new production has been coming from deep water wells in the Gulf of Mexico, but the latest blowout in the GOM indicates the type of technical challenges deep water wells present.
Rockman and Westexas are much more familiar with the domestic US industry than I am, but what they have been saying here has not been encouraging. Companies are not doing enough drilling to replace production, and some of the existing fields (notably Thunderhorse) are developing problems.
I'm more familiar with the international industry, and there the Chinese are quietly buying up all the reserves they can. Historically much of this oil has gone to the US, but the Chinese seem to be planning to divert it to their own refineries. This has been disguised by the fall in US demand, but if and when demand comes back there will be a real supply crunch for the US.
Historically much of this oil has gone to the US, but the Chinese seem to be planning to divert it to their own refineries.
Will the Chinese pay market rates for the oil? That's a crucial question, I think. If they will (and I'd be very surprised to find out otherwise), then they'll still have to outbid others in order to get the oil. The bidding might not happen directly, but if they lock up sufficient supplies to affect the overall market, then market prices will go up and increase the price they pay.
I don't think they're really "locking up" this oil, I think they just want to prevent others from locking it up.
The Chinese are willing to pay higher=than-market rates for the oil they are getting control of. It's apparent they think the oil price will rise, and also that Chinese demand will continue to rise. They have very long planning horizons compared to Western companies, so they will be willing to overbid on the assumption that future prices will be much higher.
I was under the impression that they were buying ownership stakes in oil projects, but that the oil output from those projects would be purchased by Chinese importers at the time of delivery, at market rates.
How are they getting control, and how will they pay for it?
Yes.
It's all made up.
Hmm you willing to bet that KSA/OPEC will claim to be pumping at maximum capacity if oil crosses 100 ?
Anyone Anyone Bueller ?
In any case one can consider my C02 approach found on my blog in my bio.
Also found this link and this ChemE plays almost exactly the same game I did.
http://www.john-daly.com/ipcc-co2/ipcc-co2.htm
Glad to see someone else considering mass balance.
He approach is slightly different however he is also getting the discrepancy between claimed C02 emissions and atmospheric concentration. He interprets it to mean anthropogenic C02 emissions are not a problem and I of course claim they have gone down. Regardless similar procedure and similar results.
As far as sensitivity of Mount Loa observation to northern hemisphere C02 emissions.
One can see a very nice spike recently that fits very well with the recent extreme cold weather. I'd argue that this helps show that the data is indeed sensitive enough to detect monthly variations in anthropogenic C02 emissions.
A large part of this would have been coal and NG for heating with a significant fuel oil fraction. We burned a lot of stuff over the last several months.
However it also basically hides any change in oil consumption for the moment and it probably won't be until May before its again useful to check up on oil production.
In any case figured I'd bring this up as at this moment even my approach is unable to discern current oil consumption for at least one perhaps two months.
Might as well add this while I'm at it.
Given the C02 data and the fact that heating oil had to be a significant contributor we can wonder what real US heating oil storage levels where.
First of course the propaganda piece it not even worth calling it wrong.
Next I happen to agree with import data as its easy to get and hard to hide a lot of people have access to real imports counting VLCC's or product imports is not that hard.
Distillate imports fit very well with the C02 data and make a lot of sense.
However if you think about it a bit they also have a interesting signature looking a lot like and emergency import scenario. One can imagine what would have happened if the US was caught in a serious heating oil shortage while claiming to be amply supplied. A dire emergency that no one knows about.
In any case it allows us to pin the real distillate levels since the import surge would have started as we approached MOL. This would put real distillate storage levels very close to MOL and well below the five year trend instead of ridiculously above it.
If one takes a look at the trucking index.
http://www.calculatedriskblog.com/2010/04/ata-trucking-index-increases-i...
We can see trucking also has picked up substantially.
This suggests that the US is probably still fairly tight in distillates. Later on if this trend continues and as spring planting starts I suspect things will remain tight.
Despite this distillate imports have fallen off sharply which further supports the argument that it was a serious emergency move that probably left Europe in and uncomfortable position.
One looks at US distillate production which is a iffy number not bogus but also not completely trustworthy in general I trust the trend and wonder about the amount.
One can see support for the US desperately trying to rebuild its distillate stocks.
Last but not least if my analysis is correct no way has the US used the total amount of oil it claims to have used. The number is seriously off to the tune of 500kbd to 1mbd. Assuming oil imports are trustworthy same as distillates. Obviously US domestic production claims must be a complete farce.
We are not in great shape but also not on MOL. Assuming that oil storage level was low when we drew heating oil down to the point of emergency imports suggests that the US is probably ok on crude oil. One generally needs to simply shift the bogus numbers down.
My best guess on oil is it now sitting slightly below the five year range.
However just to finish up we have a big problem still looming.
Gasoline imports are dying. I've blogged in the past about double export land and the Achilles heal of the US is when we can't get the gasoline imports. So far it looks like that time is upon us. I'd have to imagine we may see emergency imports similar to what we got with heating oil however it should exhibit the same sharp signal. Given the situation with distillates and probably gasoline it makes sense that the US is focusing on strait oil imports and local refining as we are basically short of everything however the knob if you will is going to have to be kept towards distillates in my opinion and should result in a crisis in gasoline looming over the next several months.
And back to oil imports if they are also a bit of and emergency situation then we may well see them begin to taper off as one can suspect that some of the surge was from oil stored at sea not real production.
My best guess is that this is indeed the case and over the next several weeks perhaps a month they will indeed taper off. Shortly after I expect a surge in gasoline imports say in 2-3 months. After that things get really interesting.
On the price side given all of this I'd say oil trades in a 80-90 band over the next month with things potentially getting interesting fast depending on how oil imports go a July crisis seems to be in the cards.
And as a final note most of the driving in the summer is discretionary if we really are attempting to manage a looming oil crisis then doing your best to get it to hit non-essential driving after the crops are in is a good move.
I'm by no means claiming that the US is attempting to manage a real oil shortage issue :) But if it was then doing your best to get through the winter and spring planting season before oil prices take off makes a lot of sense.
Not sure if you saw it but while you were in India the EIA "corrected" November production by applying an unexplained "adjustment" of more than -0.5 million barrels per day to PADD 3. For about a week, November Crude Production was listed as 4.938. Then it was changed back without explanation. Very strange.
So what do you think the CO2 half-life in the atmosphere is anyways ????
CO2 impulse response function
http://unfccc.int/resource/brazil/carbon.html
Around 30% of CO2 ist still in the atmosphere after 100 years
Thanks!
That is a bizarre impulse response function:
It will take me a while to digest this. The impulse response does not seem to want to return to zero. It appears more like a convolution of several impulse responses stretching backwards in time.
Or else it is the most fat-tail I have ever seen.
All I can say is wow. I now understand this to a gnat's eyelash.
http://mobjectivist.blogspot.com/2010/04/fat-tail-in-co2-persistence.html
Worth quoting part of your summary here I think.
Thanks, sometimes all it takes is for a small amount of logical reasoning for everything to crystallize in one's mind. That was my aha moment.
US snow storms were linked to the melting of the Arctic summer sea ice
Impact of Arctic sea ice loss on atmosphere
http://www.arctic.noaa.gov/future/heat.html
http://www.arctic.noaa.gov/future/impacts.html
Kiou said:
China is likely very close to peaking. Have a look at The long march of the Chinese giant oilfields (Höök, Tang, Pang, Aleklett). The preprint version was put up on the GES website in December last year, so it's pretty fresh.
Bottom line: Chinese oil production is dominated by their giant oil fields, and production from these are probably about to enter decline.
(p. 19, my emphasis)
But
(p.20)
Interestingly, Matt Simmons has claimed that China is already Post Peak. "Official Figures" of course say otherwise.
If you find older articles from the Chinese they where talking about resting their old fields and capping production and peaking back in 2003-2004.
http://www.chinadaily.com.cn/en/doc/2004-01/06/content_296195.htm
Later of course the field seems to have staged a miraculous recovery however assuming that they where telling the truth back when prices for oil where reasonably low it seems the decline rate was pretty steep.
What this means for China is that a significant amount of the increase in imports is probably going to offset declining domestic production not for real growth.
China is not a alone in leveraging claims of rapid growth to hide falling domestic oil production Saudi Arabia takes the prize in this regard.
What it does mean is that WT's export land model is somewhat skewed because some of the claim of increased consumption is really simply falling production. This is in my opinion very important as it means real consumption growth is almost certainly a lot saner and less elastic than whats claimed.
As far as actual consumption goes well having spent a month in India I'd argue that people have really messed up estimates of consumption changes. In general everyone assumes that people buy a car and immediately adopt American driving habits. This is not even close to the true situation. Indeed I found that in general Indians used gasoline like we claim the US should rarely driving and using very fuel efficient cars and public transport. Only the higher level managers and executives practiced American driving habits. In Bangalore all the engineers that had cars had motorcycles also. The driving environment can best be described as perhaps the Bronx or some run down part of New York. Even if you want to drive where are you going to park ?
Next another thing that struck me while I was India that I missed in China is the fact your seeing concentration changes for the population as the main cities boom the countryside and smaller cities are losing population. For every increase in the larger cities other regions with less wealth are seeing a loss. Its not like the major cities are booming and the countryside is seeing a steady increase in oil consumption. Certainly its easier to count oil consumption as it concentrates in the major cities but you have to subtract the fact that the people are not staying home and using oil in their old home towns. In general your probably seeing oil consumption fall outside the larger cities as the younger people leave.
Next of course again even if you buy a car it does not mean your oil consumption went from zero to US levels. Anyone with enough money to purchase a car made extensive use of taxi's and autos/put puts before they purchased a car. They where not walking around barefoot. So you have to subtract the oil production profile of a fairly wealthy person using taxi's vs driving a car. Indeed anyone that owns a car in India becomes a taxi driver for the family or lends his car to family members this private taxi service simply replaces the use of public taxi's in many cases with no net gain. Indeed because the taxi does not have to drive to pick up a person empty and in general the taxi's are a bit larger than private cars its probably more fuel efficient.
I mention India but the same scenario applies to China thus increases in purchases of new very fuel efficient cars which is happening in both countries simply does not add up to the claimed increases in fuel usage.
Now I'm not saying that fuel usage is not increasing in these countries simply saying everything I saw suggest that magnitude of the increase is substantially lower then what people claim. Direct observation of what was really happening and a bit of thought suggests that the real increase is fairly small.
Right now its very popular to separate out the OECD economies from the developing world. OECD oil consumption has been flat to falling for years many of these showing very nice growth in GDP. So OECD economies have been able to show nominal growth with little or no increase or even declining oil consumption.
I found absolutely no reason to make this distinction between countries it simply was not there on the street if you will. There was no compelling difference between India's economy and the US's for example outside of India being significantly more efficient with its oil usage.
Last but not least one can readily look at road construction and congestion to get and idea of how many cars can actually move through these dense cities. In general road construction has lagged well behind the rate of auto purchases and these cities have basically always been heavily congested you literally simply cannot increase the throughput of cars that much regardless of how many people buy as its almost constant gridlock already. Anyone with experience with city planning and road planning can easily calculate how many cars can be handled by a given road system before its saturated even if you include significant splitting of lanes etc you have to add in the large number of buses and truck also on the road in these cities. My point is that without massive American style sprawl the road systems result in a hard limit to how much traffic can flow.
I would really appreciate an explanation as to how this would be possible unless we really experience a tremendous depression? You are talking about curtailing 10M bpd in eight years.
I assume your comment was in reply to my comment just above?
Well, first, I was being a bit tongue in cheek, in order to suggest that the projections of net exports disappearing aren't realistic. In this case, US imports have fallen by 2.5M bpd in 3 years. If that were to continue for 9 years, they would fall by another 7.5M. You might object that we can't take short term trends and project them out for many years in the future without some mighty strong justification, and you'd be right. Similarly, you can't casually make the kind of projections offered above for net exports.
2nd, I was talking about a combination of consumption decline and production increase. It is very likely that US consumption will fall by 2-3M bpd in the next 8 years, and that production will increase by perhaps 1M bpd, for a net decrease of perhaps 3.5M bpd. This would indeed be very good for the US economy.
Good, until the second wave of mortgage problems arises, as it will imminently. A better way would be to simply stop wasting so much cash in A'stan and Iraq, but that's not going to happen either. Given the way the West fudges their growth numbers (especially the hilarious inflation figures), I bet we could trim another several million barrels of demand. Sure, everyone will be living in abject poverty, but at least the bottom line will be healthy, though GDP is a piss poor way of measuring the economic health of any economy, as has been detailed before. I always laugh at how the UK government is boasting about our growth out of the recession, while jobless rates go up, along with foreclosures and more and more people fall into fuel poverty because of energy price inflation which is unavoidable.
And all three parties are still billions off balancing anything even with the harsh measures proposed now. I seriously wonder if they're ignorant or just hoping no one will call them on this and point out the cliff they're driving us to still.
the second wave of mortgage problems arises
Have you seen good, recent data? I heard a lot about this a year of two ago, but very little lately. The US Case-Schiller price index reports home prices recovering, and mortgage rates are at historic lows, so the current ARM resets may be relatively harmless.
Read this site everyday. You may want to bone up on recasts and LTV also.
http://www.calculatedriskblog.com/
Suffice it to say we have even started the housing crisis its just now getting going.
Assuming I'm right and another oil price shock is approaching and figuring that government manipulation has manages to keep housing prices 20% higher then they probably should have been right now at the expense of pulling forward a tremendous amount of demand then we are probably looking at say a 30% drop. 20% to bring it back where it probably should have been and 10% from oil and demand being pulled forward.
However this puts your deep into the real housing crisis as and additional 30% drop puts so many people so deeply underwater that making the house payment makes no sense assuming high oil prices are again happening then the ability to pay for anyone close to the edge and many are with unemployment is curtailed.
In other words we are probably right on the edge of the real big one for housing.
Given the above if we did see and additional 30% drop then housing would be in a death spiral from that point on. There literally is no bottom.
In any case this thing has barely gotten started and the real housing crisis should be heating up soon.
One other problem is of course Fred and Fannie and the FHA become black holes at this point attempts to print more money to shore up their collapsing finances are fruitless as it would put the US itself on the brink of default. And thats simply to deal with losses from previous mortgages not to make huge numbers of new ones.
Basically what happens is the US reaches the point it can no longer backstop the mortgage market the numbers are simply to large even for us. Now we get into the really really nasty situation. The government basically can no longer backstop new mortgages as the losses are too high. This means the mortgage market would have to be handed back to private financing aka real banks who are themselves in deep doo doo. And your seeing falling home prices the entire time. At this point your probably not talking about 20% down for a mortgage but more like 40% probably with 6-10% rates for private mortgages.
At that point its simply dead. Assuming the average person can scrape together about 10-20k for a mortgage down payment then your talking housing prices approaching 30-60k perhaps depending on what down payments are accepted. For sure you would be talking about the average price falling below 100k or about 60% below today. Attempts to print your way out would simply lead to hyperinflation and oil prices taking a moon shot.
Now one has to imagine we will see real unemployment rates start to rise again and even the government will have no choice but to admit a double dip recession is underway. However things get even worse. Sales tax revenue will continue to fall obviously property taxes must fall and our state and local governments that are already on the verge of bankruptcy will have no choice but to make deep cuts in their spending which means massive layoffs at the state and local level.
Pension plans are going to blow up for sure.
If so its a sure bet that former state and local employees often with skill sets unsuitable for the workforce will begin to default on their mortgages. Strikes by public worker unions aka like Greece will be widespread.
The housing market at this point is finally approaching the bottom which may well be effectively zero in many areas as we are all Detroit at this point.
Regardless the housing market has a long and painful downward journey ahead of it in fact I tend to think it won't be some long fairly slow decline but a fairly sharp one as all the above works to make the pool of potential buyers shrink to a fraction of its current size say 50-70% of the people that think they can buy a house now will leave the market over the next couple of years as all the above freezes purchases by many that might be able to afford a home but cannot make the commitment because of the uncertainty.
Who could sanely buy State and Local employees would be sitting on the fence same for small business owners and once layoffs start again same for employees at all companies. Only Federal employees and the wealthy and fools are left. After everything thats happens the supply of fools has to be drying up and even if they are still out there they will be defaulting as fast as they are buying if not faster. Baby Boomer move up buyers close to retirement are going to freeze up as they watch their equity disappear.
Bottom line is the pool of able and willing buyers shrinks to a fraction of its current size under these conditions this means the transaction rate will fall by 50-70% and again housing prices will have to crash under such conditions.
And last but not least anyone with a house that has any hope of getting some of the equity out will at some point in this debacle put the house on the market in a desperate attempt to sell while there are still greater fools to buy. So your talking about perhaps a 50% drop in buyers and a 50% increase in inventory on the market with the sellers getting more desperate every day as Baby Boomers with equity watch their dreams of retiring on equity evaporate or sell while they can.
Everyone under 50 is simply trying to live pay check to pay check to hell with buying a house I'm worried about gas/food and the rent and the only good news is rents would also be falling rapidly. Well good news for me but this also means all the homes sold over the last two years to speculators even if they where planning on renting will find themselves losing money and no longer cash flowing so all of these homes go back on the market and they where close to 50% of sales in many areas.
If your getting the feeling that a mad dash to the exits is developing then your getting a good idea of what I think will happen. Thus I don't think its going to be a slow slide down more a fast and furious drop.
Mike, I'll try to read this and reply as I have time.
Could I suggest that you make your comments shorter, focus on fewer points, and spend more time editing and providing sources?
-----------------------------------
You've provided Calculatedriskblog as an authority, but it says "I don't expect a 'double dip', but a slowdown in the 2nd half of the year seems likely." http://www.calculatedriskblog.com/2010/04/ceo-wal-marts-customers-still-...
I'd say it disagrees with your pessimism.
If we look at it's latest post about housing prices http://www.calculatedriskblog.com/2010/04/case-shiller-house-prices-mixe... , we see that home prices are starting to rise. If we look at the first chart, we see that the 20-city index shows about 45% growth in nominal prices since 2000, which is below growth in incomes. That suggests that housing is now properly priced.
Nick, Look a bit deeper into the Case Shiller outlook and you will see they still think housing has much further to fall. Housing is being propped up by the gubmint and the banks. The government is subsidizing sales, and allowing the banks to carry homes on their books at above market values. THis is allowing a huge number of foreclosed inventory to remain off the market. Supply is huge and sales still pretty punk. Foreclosures are running at a rate of 4 million a year while new starts are running at around 300K a year. Not signs of a healthy market in spite of what prices are doing in some markets. Its a rigged game right now. Wait and see what happens in May after the $8000 gubmint subsidy goes away. In the fall when it expired sales went into the shatter.
In the final analysis home prices have to relate to income and with incomes continuing to drop prices have to adjust to those declining incomes. In most of the country they still have not adjusted to that reality.
Give a listen to this interview with Mark Hanson one of the top consultants to the Mortgage Industry
http://kingworldnews.com/kingworldnews/Broadcast/Entries/2010/4/16_Mark_...
Look a bit deeper into the Case Shiller outlook and you will see they still think housing has much further to fall.
Could you help me find that? I don't see it in the recent press release, where they simply caution that: "It is too early to say that the housing market is recovering... we are not completely out of the woods." http://www.standardandpoors.com/spf/docs/case-shiller/CSHomePrice_Releas...
In the final analysis home prices have to relate to income
As I pointed out above, home prices are now in sync with incomes.
with incomes continuing to drop prices have to adjust to those declining incomes.
Are incomes continuing to drop? They may not be growing, but I don't see continuing declines at this point. I wonder what the BLS says...
Nick, Besides the calculated risk blog I find a lesser known analyst Mark Hanson very sharp & technical analysis of Housing market. His views are incidentally featured in the famous T2 presentation on the mortgage crisis (scribd keywords: T2 mortgage, highly recommended). You can access his blog here:
http://mhanson.com
One particular posting does a good job of reflecting on the state of housing market & potential 'at-risks'.
http://mhanson.com/archives/349
Also, in regards to the case-shiller pricing index you have to be careful not to lump the whole market together. In light of present crisis, It represents individual markets better than all 'em lumped together. this is because of factors such as the skew of really badly performing MBS pool being concentrated in coastal regions (esp AltA & option arm).
There is another issue with using median sale numbers. I can't remember whether it was Mish or Calculated-Risk that first wrote a post on it. The jist of that analysis was that because of the nature of crisis (subprime namely) the only houses being sold were low-end so the reported stats were heavily skewed on low side. However, as the foreclosures/NODs move into mid-to-high end segment you will actually see a rise in median sale prices but that does not necessarily represents a 'improving' market (again different cases for different markets). This is one of the reasons why I don't take the housing stats very seriously anymore.
In essence, my thinking is that especially in mid-to-high end homes (mainly alt-a & option arms) the only thing that keeps people from walking away is ability to find a greater fool. which is greatly diminished as securitization will never approach the 'crazy times' level. without that any appreciation in that segment (alt-a & O-Arm) has to come from actually rising Income. Now with such high unemployment & oil shocks on the horizon you can be nearly sure that's not happening. so what gives.
There is another issue with using median sale numbers
As I understand it, Case-Shiller doesn't use median numbers: they track properties over time, to make sure the mix of sale prices is comparable.
I don't know about the composition of case-shiller index but from what i gather it has heavier weighting on higher side & it corrects with the repeat sales information. regardless of the specific heuristics these indexes might be using the larger point i was making was that the information contained in most of these aggregated indexes is not very useful in these times unless you look at something very specific.
PS: If you really want to look at the housing in details i'll suggest the RE data releases from Dataquick (http://www.dqnews.com/) .
I took a look: incomes aren't growing real fast, but they're not dropping.
http://www.bea.gov/national/nipaweb/TableView.asp?SelectedTable=43&First...
Look you have to take the blinders off and start considering the mileu if you will that surrounds our current situation. In general it reduces to a series of moral hazards and ponzi like schemes that have been successfully executed for several decades. If you want to look at some narrow data point and assume everything is just fine well go ahead. If you back out a bit and consider the forces that are at work today many resulting from previous attempts to prop up the situation then it becomes obvious there is no exit out of our current situation.
Does that lead to rambling posts yes but its hard to explain the array of factors at work now without rambling.
In the end the ability of most people to successfully go long on a thirty year bet is over. Basically no one from our governments to individuals are capable of paying their long term commitments all are now facing eventual default. Many that think they can now will find as time goes on that their situation changes and they can no longer honor their commitments. A simple example just because I can pay my mortgage means nothing if all my neighbors are in default. The sheer number of people who can no longer successfully go long on debt far outweighs the effect of a few people narrowly focused on their own finances who think they can succeed without regards to the wide range of other factors coming to a head right now.
If I'm right and its and unstoppable avalanche well then asset prices have to fall to reflect their distressed cash clearing price which in general is pennies on the dollar.
Hopefully thats short enough for you however I see no way for our current situation to end until it finally clears via a massive fire sale. Its impossible to kick the can down the road and expect things to slowly heal as way to many people companies and governments will be forced into default. Commodities become critical in ensuring we are trapped simply because any attempt to inflate our way out of our current situation will send commodity prices soaring esp oil and thus blocking the use of the printing press to offset dilution of debt. And thus you get to the heart of the matter we are critically short resources and our ability to transform money into real wealth has been hobbled growth becomes impossible and thus running the printing presses accomplishes nothing.
Everyone who has their wealth in financial instruments of all types from nominal equity on assets to government bonds will be wiped out. There simply is not enough cash in the world to purchase all the assets that will increasingly be for sale at any price esp financial instruments that need debt.
The number of people unable to build wealth and service their debt for any length of time is growing rapidly if commodity prices rise because of scarcity and even higher because of monetary inflation then this sea of people living paycheck to paycheck and day to day defaulting on debt as forced simply grows even faster. Its a Tsunami thats forming and you can certainly ignore it but that does not make it go away.
As long as the number of people being forced out of the credit economy is growing it will force others out and it will force asset prices steadily lower which forces even more people out. Its a vicious cycle thats just now started ramping up and it will swamp every effort to re-inflate the credit economy.
the heart of the matter we are critically short resources and our ability to transform money into real wealth has been hobbled growth becomes impossible
Yes, this is the heart of the matter. Your intuition is that PO, and other resource-related limits to growth will prevent growth. In fact, you assume that decline is inevitable.
We disagree on this. While I think that PO is a serious matter, I don't think it's that important, and I don't see any other critical resource-related limits to growth. I certainly think that we'll face some serious challenges in several decades from Climate Change, but that's a bit later, and different in kind.
I did not say they would prevent growth I said that it would castrate attempts at monetary inflation to inflate our way out of our current situation. This is something that people who focus on alternative energy or conservation or other energy specific solutions often fail to recognize.
The problem is we have to inflate or die if we can't inflate we are dead. Worse a large amount of the needed inflation has to occur as the form of rolling long maturity debt against rising asset prices aka wealth.
Its impossible for us to trigger monetary inflation without also trigging price inflation across a range of commodities because many are now inherently in true scarcity esp oil.
Its like printing money and giving it to people to buy food in the midst of a famine obviously it does not work. And it won't and cannot work for us. Its and inescapable trap and if you don't print your destroyed by debt default. In my famine example deciding to start withholding money does not change the situation as food prices still rise regardless as changes in the money supply cannot change the core situation.
If you did say start shrinking the money supply during a famine all that happens is all other assets are quickly sold for nothing to buy food and your non food assets rapdily become worthless.
Regardless if I'm right then over the next year or so it will become abundantly clear that money games have zero effect in famine conditions if you will as its the underlying shortage of commodities which is driving the economy and no money game can change it. Overlying is of course good old population growth.
We have hit the point that there simply is not enough resources in the world for our current population and our current highly leveraged financial system, its fundamentally broken. No narrow solution from alternative energy prices to a bear market rally in home prices changes this basic situation its simply to basic and to difficult to fix without major painful changes either by force or design does not matter.
The problem is we have to inflate or die if we can't inflate we are dead.
Could you provide some support for that? It doesn't make sense to me.
Its impossible for us to trigger monetary inflation without also trigging price inflation
That also doesn't make sense to me. I define inflation as a general price increase. I agree that money supply is an important factor, perhaps even the only factor, that determines whether inflation occurs. But, in the end, inflation isn't inflation without a general price increase.
We have hit the point that there simply is not enough resources in the world for our current population
Again, I disagree. PO isn't that important, and there are no other resources that create that kind of critical limit to economic activity.
All I can say is you need to educate yourself and become fluent in the various branches of economics.
When your talking about central bank actions and global economics the Austrian School approach is extremely valuable.
http://en.wikipedia.org/wiki/Austrian_School
In particular this one sentence is critical.
As I said there are excellent reasons to adopt this approach at the national and regional level as Keynesian economics can and will fail and its impossible to analyze the reasons from failure inside a Keynesian economic model. The statistical approach simply injects way to much BAU data into the model and they fail to predict turning points. The reason is because the logical underpinnings have fundamentally changed while economic practice in a sense overshoots in its attempt to restore things to "normal".
Your approach is incapable of elucidating that the old normal simply is no longer applicable.
Worse in general attempts to restore or return to some desired economic state when its now fundamentally unattainable invariably worsen the situation. They make what many consider highly improbable scenarios increasingly probable.The more you try and force the situation the worse it gets and the higher and higher probability that the worst possible outcome will become the one that actually happens.
If you took the time to understand Austrian economics then you will realize that its critical that the system be allowed to naturally fail if you will on its own accord and simply its time to aggressively weed out the weak so the strong can survive attempts to avoid this sinks everyone.
Economically this means instead of avoiding the on coming depression we should embrace it and allow it to force our standards of living down until we have basically paid everything off either via default or true creation of wealth. As asset prices fall and cost of living falls and excess capitol that can be devoted to frivolous use of resources recedes we right size to our economic constraints. Perhaps at the same time alternative energy can grow certainly the reduced economy will have reduced need for resources buying us one of the most valuable things in the world time.
By not taking this approach we are rapidly spending this incredibly valuable resource time. A simplistic Keynesian approach simply attaches no value to time and thus fails at the macro economic level while a more logical Austrian approach intrinsically includes the concept of the passage of time in its logical progression. This stark difference with time intrinsic in one and not the other is of course the result of using BAU statistics which destroy the concept of time in the sense that actions wants desires take a finite amount of time to execute i.e they follow a logical pattern or set of steps this stepping is time itself.
Which is ironic given accounting is all about the time value of money.
http://en.wikipedia.org/wiki/Time_value_of_money
Indeed your price approach is simply the assumption that certain fairly simple formula's are invariant aka price inflation is all that matters and this is entirely under the control of the relationship between the rate of economic growth and growth of the money supply and the only possible result is a homogeneous distribution of money.
How can you determine when this series of assumptions is no longer valid ?
Indeed what conditions actually made such assumptions valid in the first place ?
In the end it has to be a logical construct that allows certain economic situations to occur.
Thus first and foremost you eventually have to explicitly and clearly state the economic conditions or logical rules if you will that would be in force before you can make assumptions about various possible economic outcomes.
Certainly my views are extreme and perhaps if we are lucky my concerns will eventually be shown to be unfounded however that does not matter what matters is the probability that I might be right is not only non-zero it may well be highly probable depending on how you do the modeling. But how on earth are you going to do any sort of shock analysis or research into if we have undergone a fundamental logical change without adopting a Austrian like approach.
Surprisingly for me at least a lot of people seem to literally be unable or unwilling I don't know which to even explore this. I don't have a problem with the concept of running the printing presses inducing some mild inflation in exchange for growth if the underlying logic of the system supports it claiming this is wrong would fly in the face of 30 years of growth to the contrary. Regardless from time to time you have to ensure that the logic is still valid and from time to time it simply is not and does not work.
It did not work in the 1930's and a good chance it won't work today.
What are you going to do if I'm right and we see housing begin to seriously crumble later on this year ?
What does your highly distorted housing stat mean at that point ?
The price of oil is rising the real health of the housing market is questionable show me your underlying logic and use it to make some reasonable broad predictions say for the next six months.
I'm more than willing to do so since I actually try and understand the BAU claims.
Here are my predictions excepting the claims of BAU
1.) Oil will reach 100 dollars and OPEC will open the taps plus "peak demand" will kick in sending prices back down say to 60 or so by fall.
2.) Housing will continue to slowly strengthen perhaps hurt somewhat by a brief period of higher oil prices.
3.) Unemployment will continue flat to falling.
4.) Economic growth will slowly pick up steam.
Into next fall and onwards extended monetary stimulus will finally kick in and we will see strong gains in housing prices oil prices will remain bounded below 100 with OPEC production and natural peak demand kicking in as needed. Steadily high but not unreasonable oil prices will spur alternative energy development and electric cars will become increasingly available. Wind and solar will see strong growth ensuring the grid can handle growing electric demand. Natural Gas prices will eventually cross the magic threshold of 6-9 mbtu and ample supplies of unconventional NG and LNG will hit the market however increased use of NG will ensure prices remain permanently above the minimum needed to exploit such resources.
All of this takes pressure off of oil and oil demand begins to finally fall in real terms faster than supply and we would see oil prices hovering nearer the lower 50-60 range as economic transitions esp to EV's make it structurally harder to move back to oil in the advanced economies thence in the poorer nations.
This move to electricity esp renewable naturally drop C02 production and world C02 levels moderate and begin to fall. As the entire globe naturally gains in wealth birth rates start falling rapidly as second world economies mature and over time population falls. In the interim advances in bio-engineering create a second green revolution more than capable of handling peak population that approaches 8-10 billion.
At some point fusion power becomes viable and advances in solar cell production and battery technology lead to even more rapid advances than we saw with oil.
Dude I can readily write the rosy story line by line I have no problem doing it and I can write the doomer scenario I don't write these rosy stories since I don't see that the intrinsic logical economic conditions are in place to support them notice I did not mention debt.
You need to at least become as flexible and understand all sides its not impossible to do and it makes it easy to do critical analysis by intentionally blinding yourself to the problem you cannot get the right answer. All your doing is writing a fairy tale just like I did above.
I have to admit, I have a hard time making sense of the Austrian model - it seems to start from a priori assumptions, and create models without looking at empirical data. In particular, as a practical matter what is inflation if not a generalized price increase?
Regarding your BAU scenario - that's rosier than I would project. In effect, that's creating a "straw man", at least as far as I'm concerned. I don't expect oil prices to fall quickly or home prices to rise quickly - I don't think that's necessary for the US to see reasonable economic growth. I do think it's pretty clear that NG production will stay pretty high, but a continuation of the kind of NG price volatility we've seen lately won't prevent that. I agree that EV's will continue to grow, and become entrenched. I don't think that CO2 emissions will fall quickly - we're likely to use coal (which is why there's very little risk of "peak energy"), though wind and solar will continue to grow quickly. I see no need for "bio-engineering create a second green revolution", or fusion. Seriously, fusion? I can see why you think that a scenario that doesn't include collapse seems like a fairy tale.
The thing is, we have all of the tech we need right now. We don't need new batteries, fusion, bio-engineering, etc, etc. Heck, we don't even need wind & solar to deal with peak oil (though, of course, the resulting use of coal would create larger problems later on).
You need to at least become as flexible and understand all sides
That's what I'm doing. You'd do better to not give in to the temptation to make assumptions otherwise (which is unproductive at best, and ad hominem at worst). When it comes right down to it, I suspect I have at least as much useful information about energy issues as you do, and the energy issues are far more important to establish first, before we look at theory of how to manage economic collapse. If you have new information that demonstrates that PO will cause collapse, you need to provide it (with sources), and do it clearly and concisely.
For my view on the research in this area:
Will peak oil force the economy to decline disastrously?
Robert Hirsch is perhaps the most visible advocate of this idea.
He has published several studies. The last one suggests that oil consumption is related to GDP in a 1:1 ratio - in other words, if oil consumption drops by 10%, GDP will as well. Here is what he said recently: "So then if one calculates a range of 2 to 5 percent, some people think the number may be larger, 2 to 5 percent per year increase in oil shortage, one comes up with a rather disastrous indication world GDP will decline by 2 to 5 percent a year in tandem with increasing oil shortages."
Is this realistic?
No. We can see this from economic history: in the US, oil consumption fell by 19% from 1978 to 1983, and yet GDP grew slightly. Similarly, world oil consumption was flat 2004-2008, but GDP growth was quite strong, stronger than for the US (which itself grew 8% 2005-2008, with flat oil consumption). Oil consumption in the US fell much faster in 2008 and 2009 than GDP. Lately, in the 4th quarter of 2009, US oil consumption continued to fall by 1.1% over the previous quarter, while GDP grew by 5.8%.
Hirsch seems to have looked at the relationship between oil and GDP over the last 20 years, noticed that the ratio of oil increase to GDP increase has dropped from the previous 1:1 to roughly 1:2.5 (an analysis which he attributes to the DeutcheBank, but which can be derived straightforwardly from IEA statistics). In other words, in previous decades as the economy grew, oil consumption grew as quickly, while lately less oil has been needed. Hirsch drew the very strange inference that GDP has become more dependent on oil, rather than less.
Continued here: http://energyfaq.blogspot.com/2008/06/there-are-several-studies-by-rober...
No one is at the wheel. The Govt. has committed itself to so many expenditures, there isn't one politician willing to come right out and talk about wholesale cuts. Right now it's a game they're all playing to see who will blink first. Since there seems to be no problem borrowing (or is it printing more?), they just keep going forward, like you say to a cliff.
Here's a perfect example: They steal social security revenue above what must be paid out. I say steal, because it's under the guise they are borrowing the money. Who are they kidding? The only way it can be paid back is by us, the masses, so in a sense we are borrowing our national retirement fund to pay for the things they approved. I never agreed to have my retirement stolen - no one did, and we all get to vote, but it makes no difference.
You'll notice whenever the topic of cuts comes up, they futz around with microbrial things of a few million here and there. Oh, we cut the spores & fungus fund - that's a savings of 1.5 million dollars! But wait a minute, isn't the deficit this year 1.5 trillion?
I suppose we are powerless to do anything about it, except wait for the inevitable point when it no longer works and that forces hard changes.
My 2c.
A couple of years ago I asked if "the future" might be a long declining plateau to a cliff (BAU). Might we already be six years into that plateau?
Regards, Matt B
How much of the liquids growth exaggerates net available liquid energy growth?
For example, a barrel of oil is probably needed to make 1.3 boe of ethanol. So most of the ethanol growth isn't real growth in net energy available. What's the net growth for biomass liquid fuels?
Similarly, how much has energy usage grown in the extraction and processing of oil?
Is it hard to calculate the net available liquid fuels energy? Might it actually be dropping already?
You are definitely on to something. Michael Klare wrote an insightful article on this a couple years ago in "The Nation":
http://www.thenation.com/doc/20071112/klare
How much of the liquids growth exaggerates net available liquid energy growth?
That's partly addressed in Chart 10.
a barrel of oil is probably needed to make 1.3 boe of ethanol.
You're thinking of btu's, not liquids. About .2 barrels of diesel is used to make a barrel of ethanol.
how much has energy usage grown in the extraction and processing of oil
Not that much. The ratio of dry holes has dropped dramatically recently due to better imaging.
Don't forget that the energy used to drill isn't that great - most of the energy input for oil comes later (refining, transportation, etc), so a sharp increase in drilling energy inputs won't make that much difference.
I suspect capex lead time is a bigger problem than rising E-ROI. The bottlenecks for increased production are more in the area of labor and equipment.
What surprises me is that OPEC spare capacity announced by IEA and EIA is published in Oilwatch monthly without expressing any doubts. And this while IEA, EIA and OPEC are not known as being reliable sources.
Are there any reliable resources?
I mentioned the doubts about spare capacity in an e-mail to Rembrandt. He answered that because there is no better information he follows EIA and IEA. In his book (the permanent oilcrisis) he wrote that those agencies year after year are publishing too optimistic prospects. It would be better to mention that spare capacity could be much lower.
Some sources are more reliable than others. Where does EIA and IEA get the information about KSA spare capacity from other than from Saudi Aramco ? The same company that gives KSA reserves at 264 Gb and since several decades staying the same.
Two observations: (1) We saw a large crude oil supply increase in response to the annual oil price increase from $26 in 2002 to $57 in 2005; (2) We saw a cumulative decline in crude oil supply in response to the annual oil price increase from $57 in 2005 to $100 in 2008.
Question: Given this disconnect between the supply responses in the two three year time periods, can we reasonably conclude that spare capacity essentially went to zero in the 2006 to 2008 time period?
According to Robert Rapier, the Saudis observed rising storage levels, and were terrified that high prices were about to crash, as has happened many times in the past. So, they reduced production to prevent the expected price crash.
So, are you interested in buying a bridge?
In any case, good summary of the conventional wisdom, that declining demand drove annual oil prices from $57 in 2005 to $100 in 2008.
Jeffrey,
Obviously, Robert's argument is that the Saudi's misjudged demand, and raised production later than they would have otherwise. He argues that this a logical explanation for the dip in KSA's production, and that there is no evidence that the dip was caused by a lack of production capability.
Now, let me add that I'd be delighted to discuss these things at whatever length you might want - we might learn something. OTOH, ridicule isn't really an effective argument, nor does it enlighten anyone.
They net exported 9.1 mbpd in 2005 at $57 per barrel and 8.4 mbpd in 2008 at $100 per barrel, but if you prefer to believe in non-depleting oil fields in Saudi Arabia, you are not alone.
Well in doing so they get much higher incomes.
It makes sense to limit your production if you are price maker (because it increases the prices), which is their case.
They may have reached their limits in July 2008, but they definitively have some spare production now.
if you prefer to believe in non-depleting oil fields in Saudi Arabia
Again, that's not what Robert Rapier is suggesting. He's suggesting that the Saudi's misjudged demand, and raised production later than they would have, and could have, otherwise. He argues that this a logical explanation for the dip in KSA's production, and that there is no evidence that the dip was caused by a lack of production capability. Obviously the Saudi's have to deal with depletion - that's not what this debate is about.
Again, mis-stating the question that's being debated, and using a disrespectful tone, aren't really effective ways of advancing an argument, nor do they enlighten anyone.