Peak Gold, Easier to Model than Peak Oil? - Part I
Posted by Luis de Sousa on November 25, 2009 - 10:25am in The Oil Drum: Europe
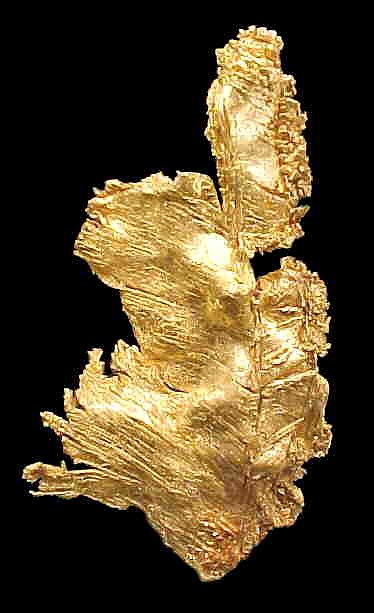 This is a guest post by Jean Laherrère on gold. Although of little relevance to our economies in the present day, this precious metal has been used as money for many thousands of years, and still retains its importance and value. In a two part article, Jean analyses how gold mining is subject to depletion.
In this first installment, an assessment of reserves and a production model is presented for each of major gold-producing countries in the world.
Note: This post contains close to 50 images amounting to 2 Mbytes of data.
Preface
by Ugo Bardi
The question regarding the reasons for the "bell shaped" Hubbert Curve has been around for a long time. Is the curve something that is only associated with crude oil? Does it hold for all fossil fuels? Or is it characteristic of all non-renewable resources? With time, evidence has accumulated that the Hubbert Curve is a very general phenomenon that occurs for all cases where a resource is exploited in conditions of free or nearly free market. The curve is observed also for renewable resources, when the rate of production is much faster than the replacement rate. It is, however, a typical characteristic of non-renewable mineral resources.
In the case of energy resources, the Hubbert Curve is directly related to EROI or EROEI (energy return of energy invested). Declining values of the EREOI reduce the producers' profit and, eventually, lead to a reduction in investments on exploration and development. In the more general case of mineral resources, the curve is still related to energy but, in this case, to the increasing need of energy for exploiting progressively lower grade ores. The case of gold is especially interesting since it deals with a resource whose extraction rate would be expected to be dominated by market prices rather than energy constraints. Indeed, the historical gold production curve is best interpreted in terms of multiple production cycles, each one following a Hubbert Curve. Nevertheless, it is still possible to interpret the curve in terms of an overall Hubbert behaviour which, therefore, appears to be a nearly universal phenomenon in resource exploitation.
Introduction
Natural distributions (size versus rank) seem to follow the same fractal pattern (parabolic fractal) with galaxies, earthquakes, urban agglomerations and oil and gas reserves gathering in the same way (Laherrere 1996).
Mineral discoveries and production in sedimentary basins also seem to follow the same pattern, displaying several cycles trending towards an ultimate value. Production mimics discovery with a certain time lag, because what is produced needs to be discovered first.
However, production is limited both by above-ground and below-ground factors. The main below-ground limit is that the energy invested should be less than the energy returned, or EROI (Energy Return on Investment should be higher than 1). But EROI is very hard to estimate, except by converting expenditures for energy using assumed ratios.
Hall et al (Energies 2009-2 What is the minimum EROI that a sustainable society must have?) propose a minimum EROI (over 3?), when the real limit is 1 (except with subsidies!).
For long, I thought that gold production was different from fossil fuel production, because gold exploration has no energy limit, only cost. Gold concentration can vary largely. The contours are uncertain and the limit (cutoff) is an economic cutoff, whereas crude oil deposits are discrete and the concentration is either almost 100% (forgetting water produced with the oil) or 0%. However, oil supply (to satisfy oil demand) includes much more than crude oil or bitumen: natural gas liquids, refinery gains and other liquids from coal or biomass. Unconventional oil is more limited by the size of the tap (speed of extraction) than by the size of the tank (amount of resources).
Gold is extracted in mines at about 4000 meters deep, while coal reserves for instance are limited to about 1800 meters deep and onshore because of EROI constraints (waiting for a breakthrough on in situ gasification). But looking at the problems in South Africa (which for long was the main producer), it appears now that diminishing grade and high energy needs will set the limit. The world’s main gold mine is gold in the sea and no one is even thinking of that!
As a retired oil and gas explorer (geologist/geophysicist), I am very interested in minerals, but I know very little about gold mining. (I did try to pan for gold in Australia.) I have gathered all that I could find on the web, to present the main facts about the main producing countries.
I found that little reliable historical data exists. The main source of production information since 1933, on a country-by-country basis, seems to be the annual yearbooks of the USGS. Unfortunately, some of the amounts shown are not correct even in more recent editions, because past wrong estimates (especially for the FSU) were not corrected. Data for China is not considered as certain as the data from other countries. However, the USGS provides good maps of the country's gold mines.
I want to thank Gavin Mudd from Monash University Australia, who has done terrific work on gold. He has written excellent papers and provided me with historical values for most producing countries.
The site GoldSheetLinks provides gold production data since 1970 (though the data for Russia is wrong for the Soviet period) showing the main producers, which were in 2000 South Africa followed by US, and Australia in third place. But by 2008, the main producer was China with rising production, while South Africa, US and Australia are at the same level or declining.
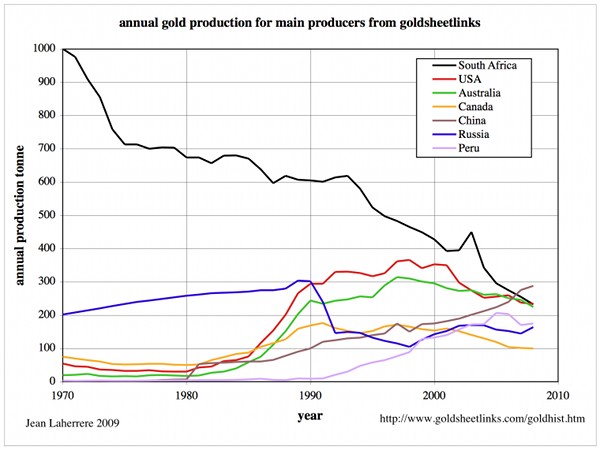 Figure 1: Annual gold production from main producers from goldsheetlinks. |
The same with the total on a log scale:
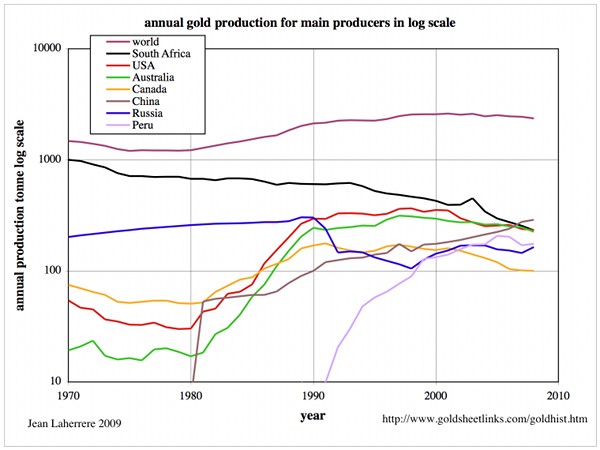 Figure 2: Annual gold production for main producers using a log scale. |
As shown in the previous graph, South Africa was by far the largest producer, but it is not any more. First place was taken over by China, with Australia and the US producing as much as South Africa!
Let’s study the main producers:
South Africa
Gold occurs in many places in Africa:
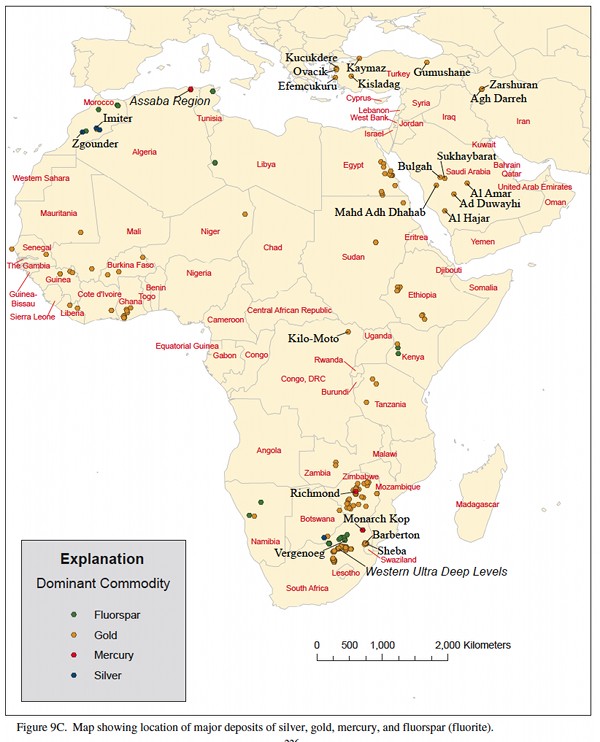 Figure 3: Gold map of Africa |
Gold mining in South Africa started around 1880, and the cumulative production has reached over 50 kt. It can be modelled with two cycles for an ultimate of 58 kt; leaving a yet to be produced figure of 8 kt, whereas USGS estimates the reserves (remaining reserves) at 6 kt and the reserve base (resources) at 30 kt.
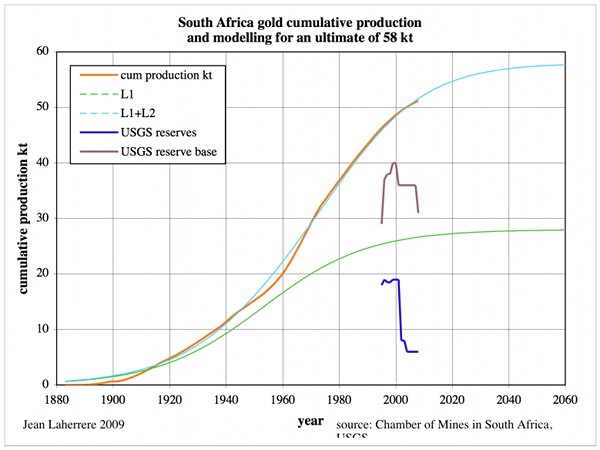 Figure 4: South Africa cumulative gold production & modelling. |
Annual gold production from South Africa is compared to the gold price and modelled with 4 cycles:
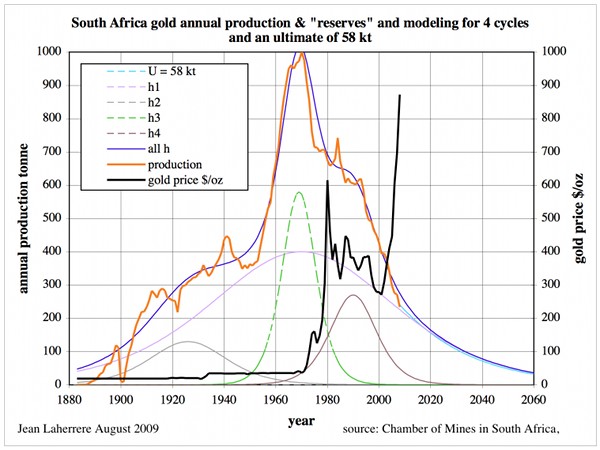 Figure 5: South Africa annual gold production & modelling. |
Gold mine grade is a very important element of the economics of gold mining. The present linear trend of South Africa’s gold grade will reach zero around 2060, which makes our annual production forecast look optimistic with the 58 kt ultimate.
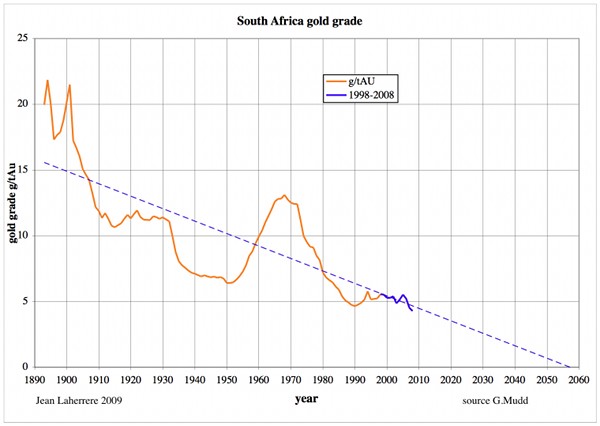 Figure 6: South Africa gold grade. |
South Africa's gold grade decline could be sharper because deep mining consumes a lot of energy. US' gold decline is sharper.
Official gold «reserves» are in fact what is in the banks, and should not be confused with geological reserves (future production).
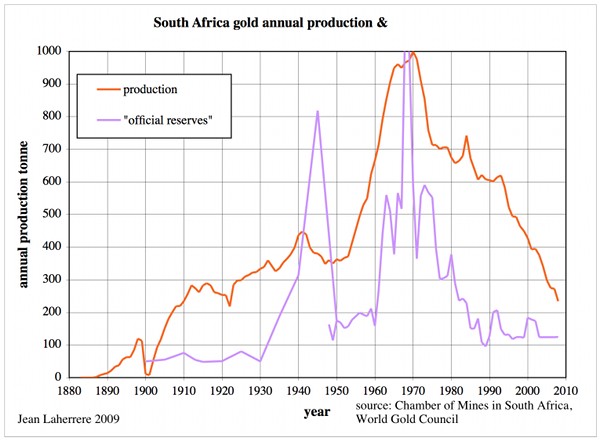 Figure 7: South Africa annual gold production and official «reserves» (in the banks) |
Ghana (formerly Gold Coast)
Ghana has a long history of mineral production, and gold mining has been prominent in the economy of Ghana during the last 2000 years, using indigenous methods. Historically, this method for gold mining attracted Arab traders into the country and earned Ghana the name Gold Coast. Between the 14th and 19th century, the Gold Coast produced about 14 million ounces of gold using indigenous methods. Modern gold mining in Ghana essentially began with Frenchman Pierre Bonnat, the father of modern gold mining on the Gold Coast. In 1895, Ashanti Goldfields Corporation began working in the Obuasi district of Ghana, developing the Ashanti and other mines, which have produced the largest proportion of gold since 1900 in the countries of the Gold Coast.
The cumulative gold production reached 1.7 kt in 2008 and can be modelled for an ultimate of 3.5 to 4.5 kt (USGS remaining reserves being 1.6 kt and reserve base 2.7 kt).
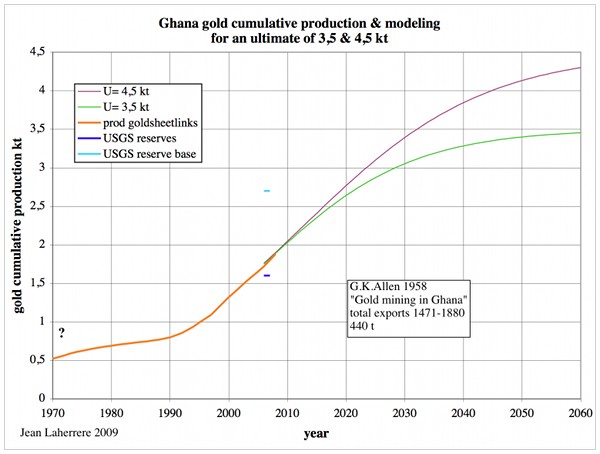 Figure 8: Ghana cumulative production & modelling for an ultimate of 3.5 & 4.5 kt |
Ghana's gold production should peak around 2015 at a level about 110 t/a.
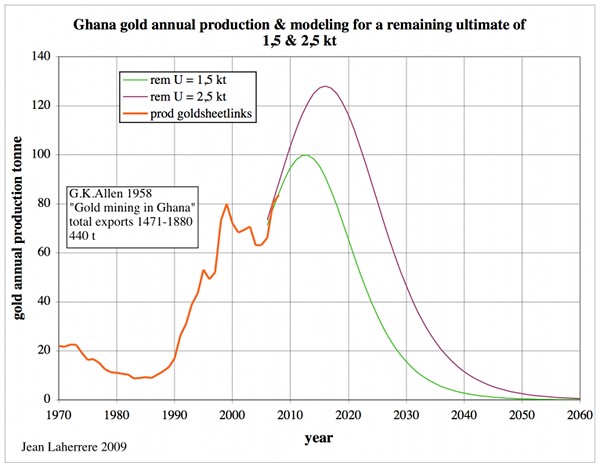 Figure 9: Ghana annual production & modelling for an ultimate of 3.5 & 4.5 kt. |
US
The US are famous for the gold rush of 1849 in California, but gold occurs in other places too.
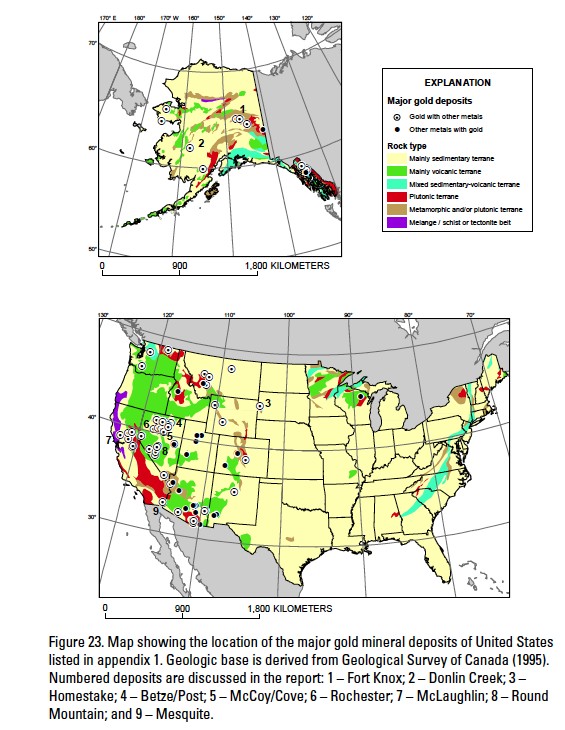 Figure 10: US gold map. |
Despite some production in the Appalachia as early as 1792, US gold cumulative production did not really take off until around 1850, and reached 17 kt at the end of 2007. The ultimate is estimated at 20 kt because the USGS reports remaining reserves at 3 kt, with resources at 5 kt.
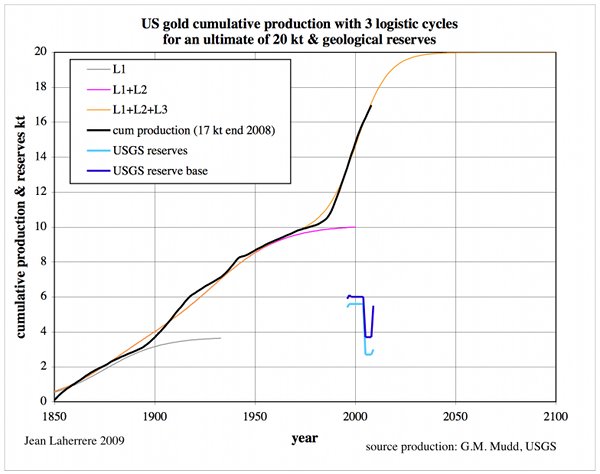 Figure 11: US cumulative gold production and modelling for an ultimate of 20 kt. |
US gold production has shown several peaks: 1852, 1915, 1940 and the last and largest in 1998. It seems unlikely that there will be another significant peak.
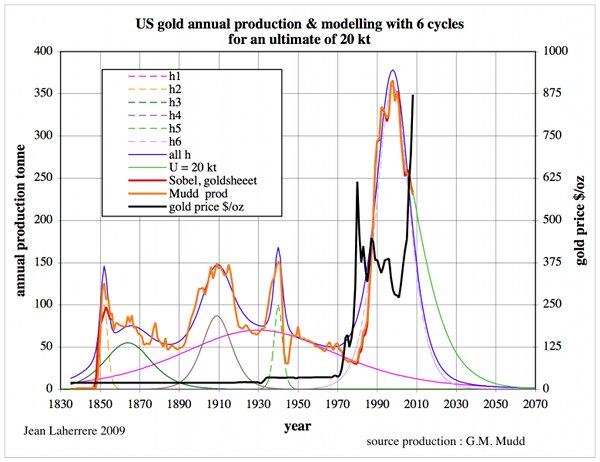 Figure 12: US annual gold production for an ultimate of 20 kt. |
Gold production’s drastic decline is confirmed by the decline of gold grade.
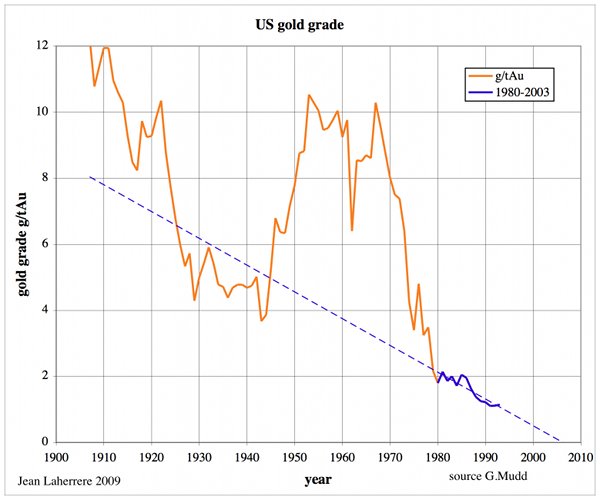 Figure 13: US annual gold grade and linear extrapolation since 1980. |
US gold grade was 10 g/t during the 1960s, and declined to 2 g/t in 1980. In the 1990s the average grade remained just above 1 g/t, which is close to the threshold for economic extraction. The extrapolation of grade since 1980 up to 1993 (last value) leads towards a zero grade around now.
The largest production figure since 1980 was in Nevada: Jon Price Nevada Bureau of mines and geology 2007 The world has changed: minerals in the 21st century [pdf!].
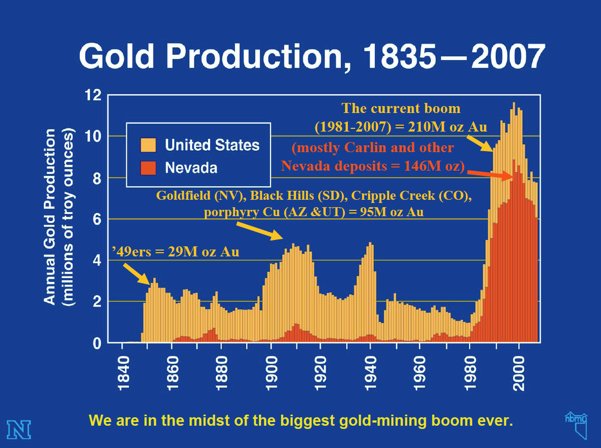 Figure 14: US annual gold production and Nevada contribution. |
Canada
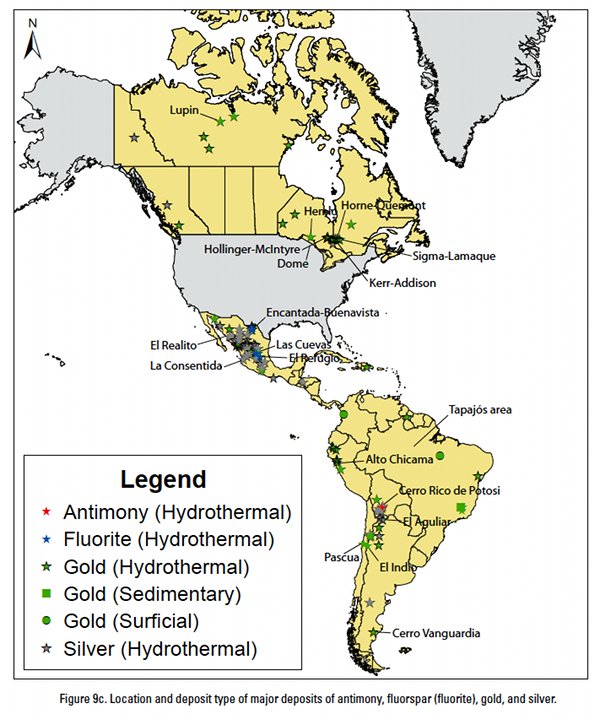 Figure 15: Canada and Latin America gold map. |
Canada’s cumulative gold production reached 10 kt in 2008 and can be modelled with an ultimate of 12 kt (USGS reserves = 2 kt & reserve base 4 kt).
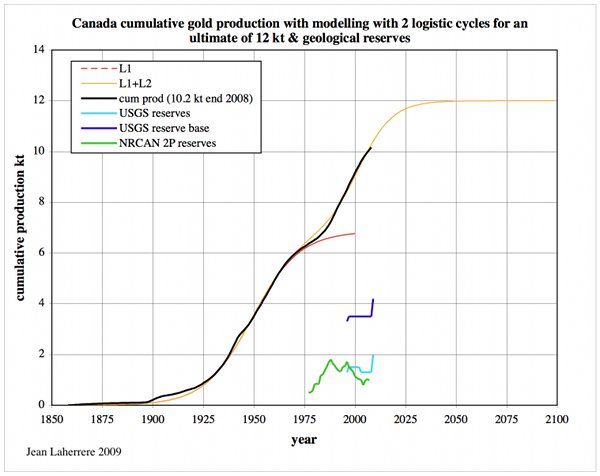 Figure 16: Canada cumulative gold production & modelling for an ultimate of 12 kt |
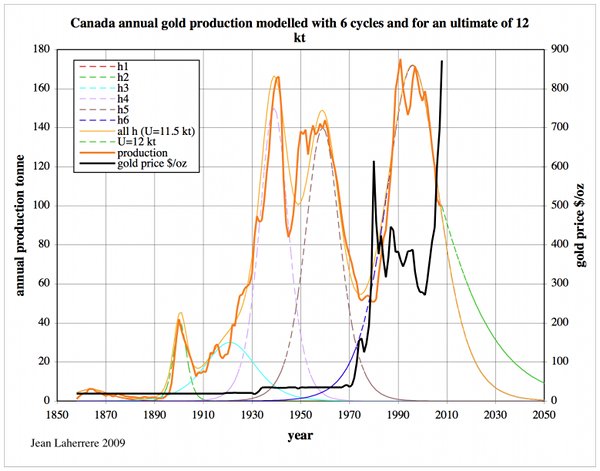 Figure 17: Canada annual gold production and modelling for an ultimate of 12 kt |
Canada’s gold grade trend from 1955 to 2004 can be extrapolated towards 2035, but only to 2010 using the last 12 years!
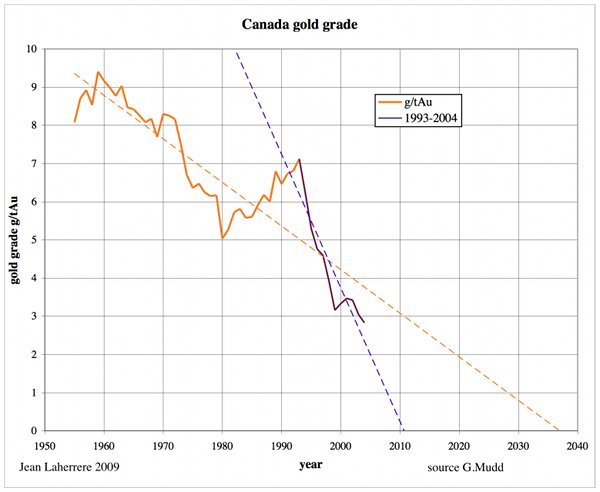 Figure 18: Canada gold grade. |
Australia
The world's largest gold nugget was found in Australia (Victoria) in 1869 weighting 74 kg!
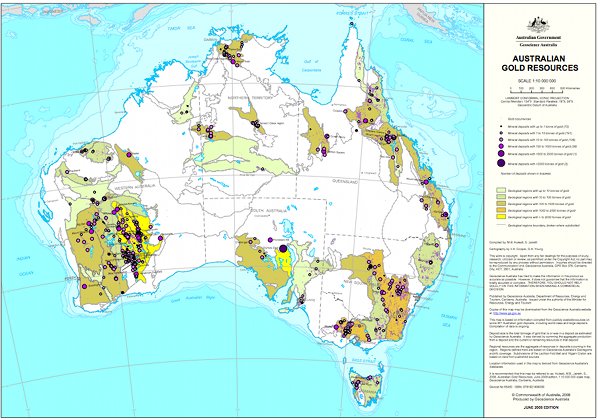 Figure 19: Australia gold map from www.ga.gov.au |
Australia’s cumulative gold production was about 12 kt in 2008, and can be modelled for an ultimate of 17 kt (USGS estimates reserves at 5 kt and reserve base at 6 kt).
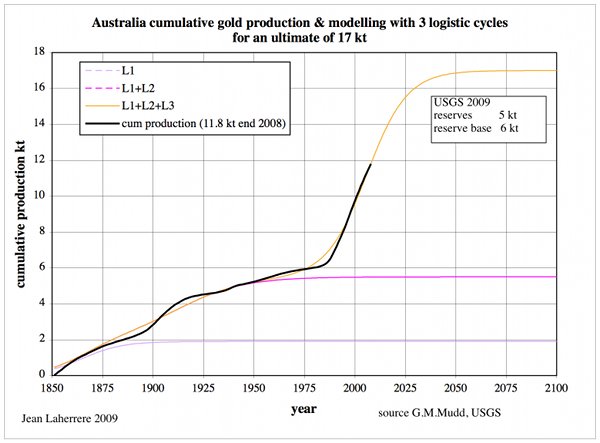 Figure 20: Australia cumulative gold production & modelling for an ultimate of 17 kt. |
Australia’s gold production has peaked in 1997, and its decline will continue until about 2060 if the ultimate is 17 kt.
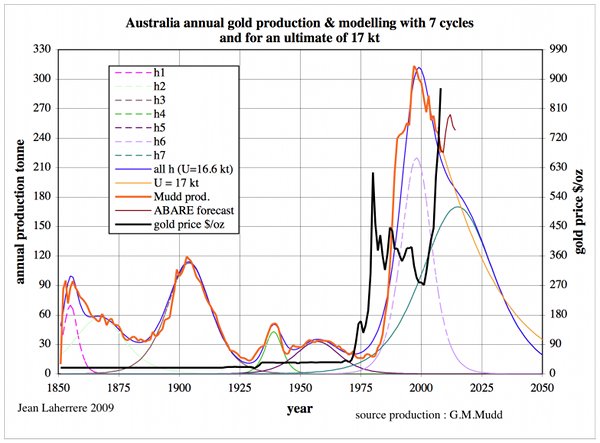 Figure 21: Australia annual gold production & modelling for an ultimate of 17 kt. |
But since 1940, Australia’s gold grade decline seems to trend towards zero around 2035, meaning that the 17 kt ultimate from the USGS is too high! Australia’s gold grade is now at 2 g/t.
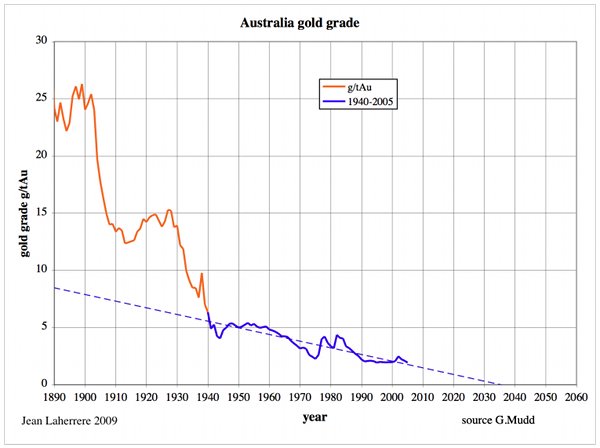 Figure 22: Australia gold grade |
Brazil
Brazil's Gold Rush started in the 1690s, when the Bandeirantes discovered large gold deposits in the mountains of Minas Gerais [General Mines in Portuguese].
Brazil’s cumulative gold production is 3.4 kt in 2008 and can be modelled for an ultimate of 4 kt & 5 kt (USGS reserves = 2 kt and reserve base = 2.5 kt)
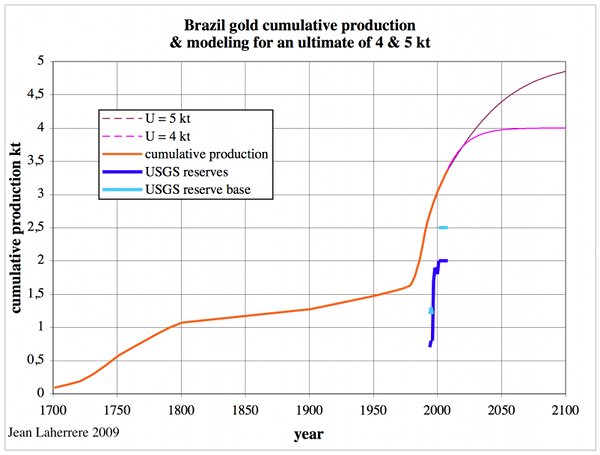 Figure 23: Brazil cumulative gold production and modelling for an ultimate of 4 kt & 5 kt |
Brazil’s gold production peaked in 1990, and will decline until 2050 or 2100 depending on the ultimate.
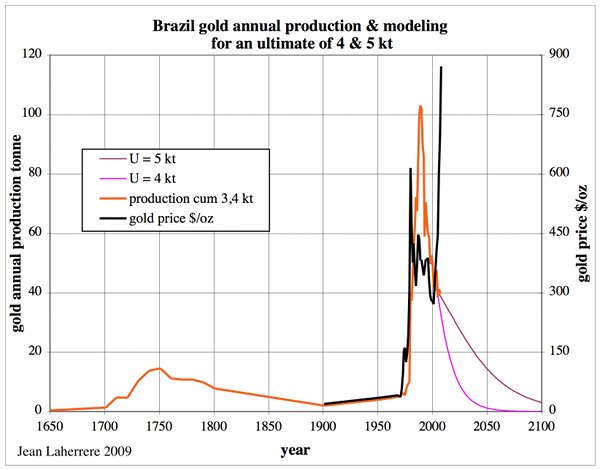 Figure 24: Brazil annual gold production and modelling for an ultimate of 4 kt & 5 kt |
Brazil’s gold grade has been declining since 1900 and can be extrapolated towards zero around 2050, which leads to consider the USGS reserve estimate as too high, only the 4 kt ultimate being likely.
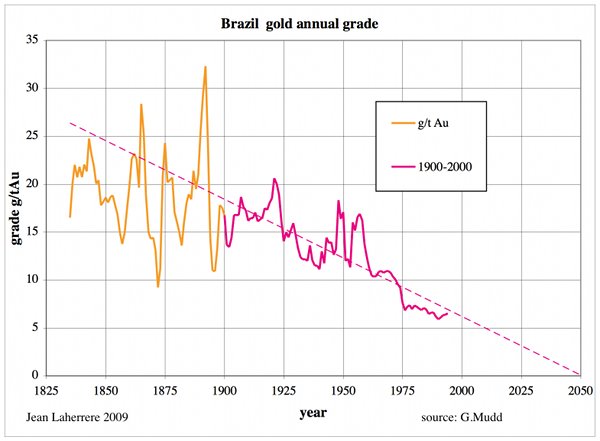 Figure 25: Brazil gold grade. |
Peru
Gold was produced long before the Spanish conquest, but data starts in 1491. Cumulative gold production was 2.3 kt in 2008 and modelled for an ultimate of 4 kt. USGS estimates for reserves were high in 2004 but dropped to 1.2 kt with a reserve base at 2.3 kt.
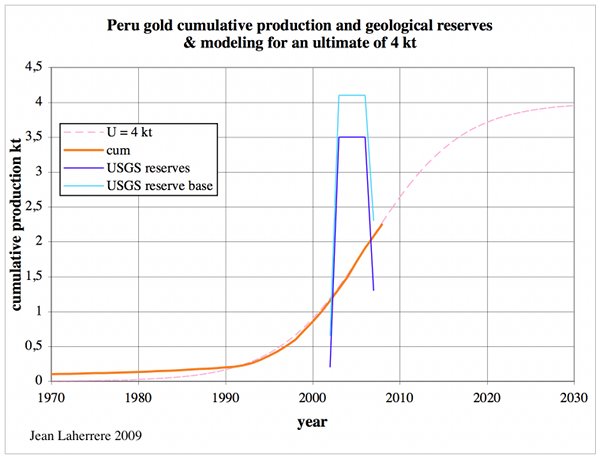 Figure 26: Peru cumulative gold production and modelling for an ultimate of 4 kt. |
Peru’s gold production has peaked in 2005 and will decline until 2020.
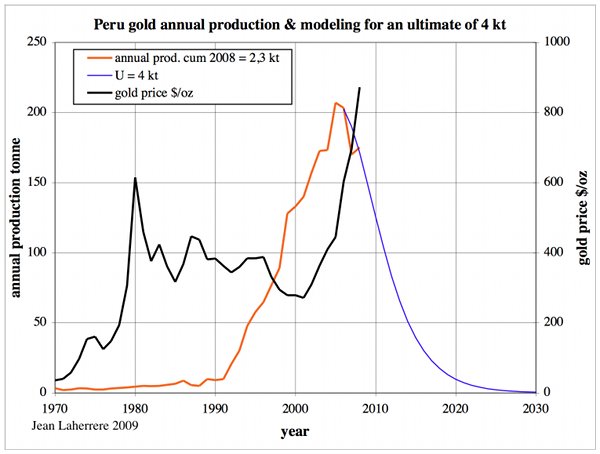 Figure 27: Peru annual gold production and modelling for an ultimate of 4 kt. |
Mexico
Historical gold production is hard to get before 1970 and cumulative production since then reaches 0.6 kt in 2008. USGS estimates reserves at 1.4 kt and the reserve base at 3.4 kt.
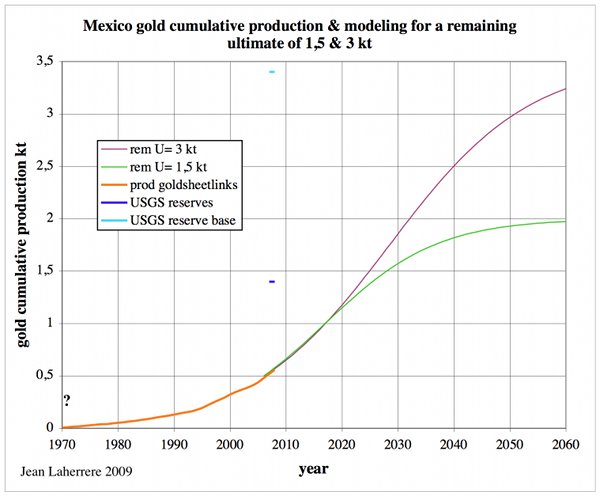 Figure 28: Mexico cumulative gold production and modelling for a remaining ultimate of 1.5 & 3 kt. |
Mexico’s gold production should peak about 2020, at around 100 t/a!
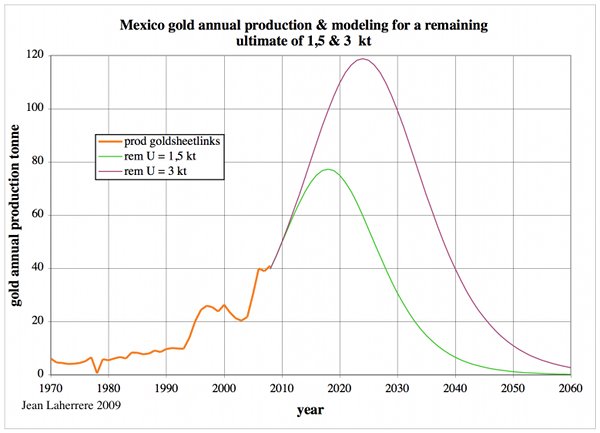 Figure 29: Mexico annual gold production & modelling for a remaining ultimate of 1.5 & 3 kt. |
Chile
Like Mexico, Chile’s gold production before 1970 is hard to get; since then cumulative production is 1 kt and can be modelled with a remaining ultimate of 2 or 3 kt (USGS reserves at 2 kt and reserve base at 3.4 kt).
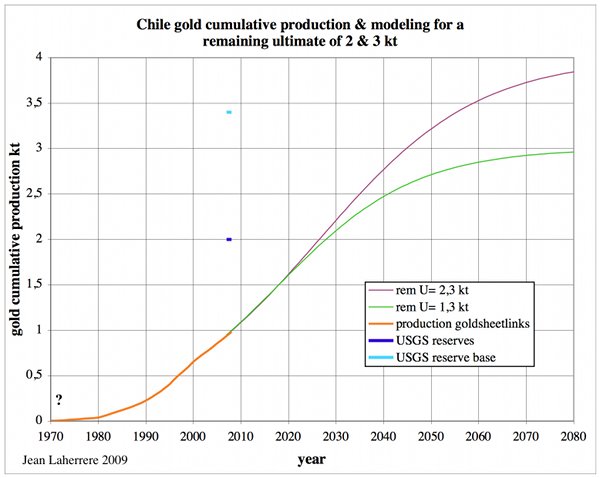 Figure 30: Chile cumulative gold production and modelling for a remaining ultimate of 2 & 3 kt. |
Chile’s gold production should peak around 2025 at 70 t/a.
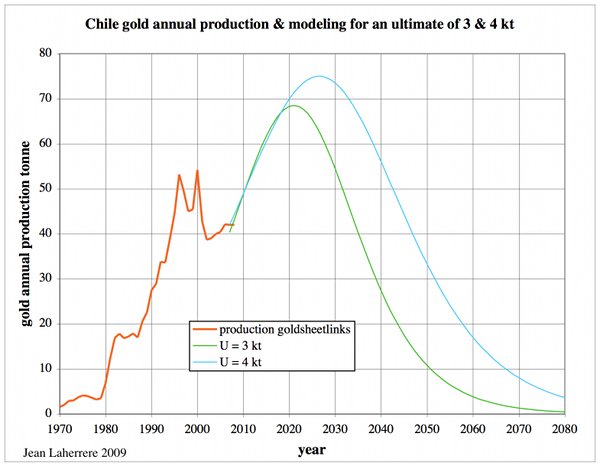 Figure 31: Chile annual gold production and modelling for a remaining ultimate of 2 & 3 kt. |
Russia
Russia’s gold industry started in 1745 around Ekaterinburg and in Siberia in 1823 (Korolenko 2004). Russia’s data was confidential during the Soviet period and CIA's (then USGS) reports were completely wrong. The most reliable source is the recent paper by Russian gold producer NBL CEO M. Leskov «Winning gold in Russia» International Mining May 2009.
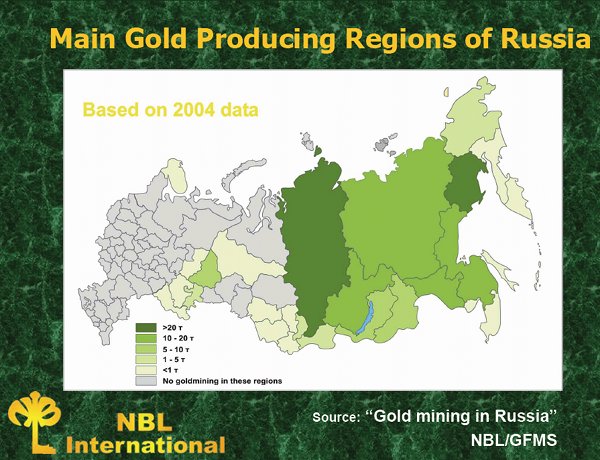 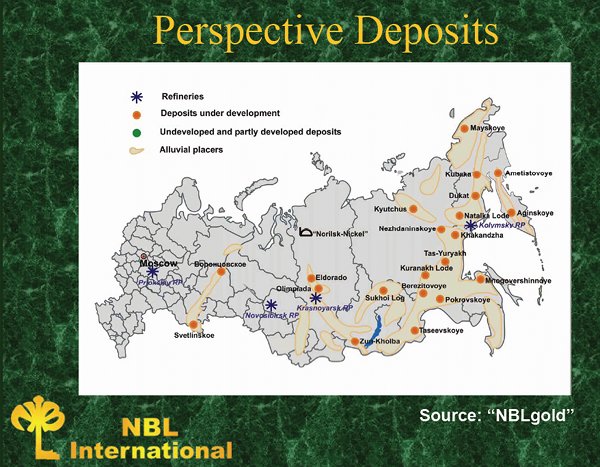 Figure 32: Russia gold map from NBL International |
Leskov was giving completely different data from the past CIA reports, but the following graph is hardly readable to keep data still confidential!
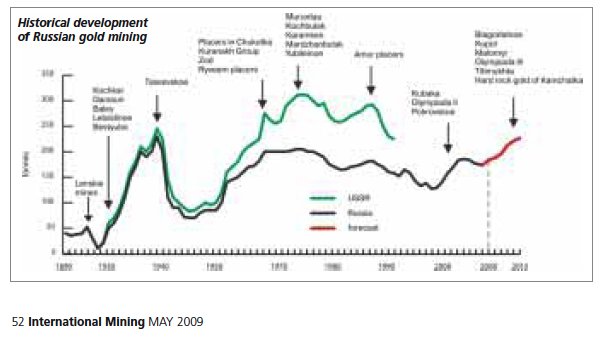 Figure 33: Russia annual gold production from Leskov, head of NBL |
Comparing Leskov data (if correctly read) to previous sources shows that discrepancies were huge (more than double)!
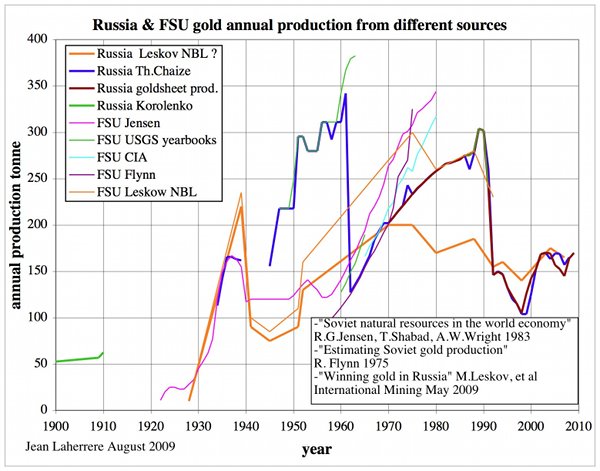 Figure 34: Russia annual gold production from different sources |
Different data sources are:
1. The USGS minerals yearbooks. In the 1963 report, USSR production is reported at more than 10 Moz since 1950.
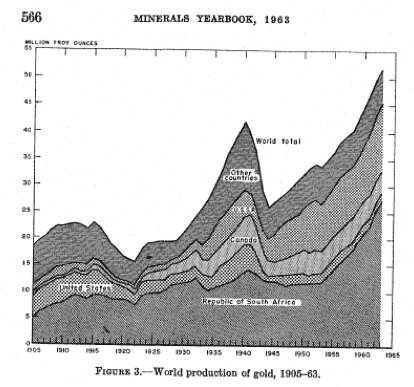 Figure 35: Annual gold production from USGS minerals yearbook 1963. |
In the 1964 report, USSR production is shown as less than 5 Moz from 1942 to 1963 in a new graph for the past, but most researchers kept the previously reported annual data, which was not corrected.
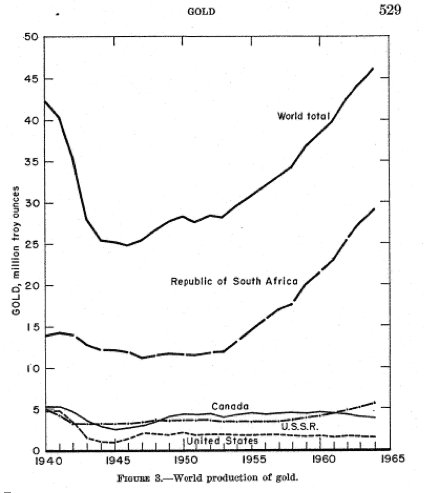 Figure 36: Annual gold production from USGS minerals yearbook 1964. |
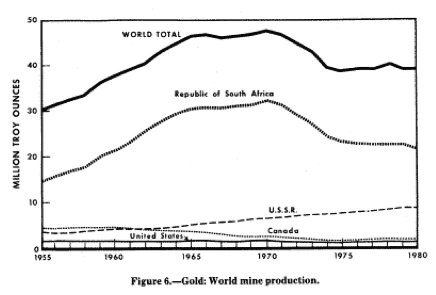 Figure 37: Annual gold production from USGS minerals yearbook 1980. |
2. Robert G. Jensen, Theodore Shabad, Arthur W. Wright 1983 Soviet natural resources in the world economy.
3. Jon Price 2007 The world has changed: minerals in the 21st century [pdf!] Nevada Bureau of mines and geology.
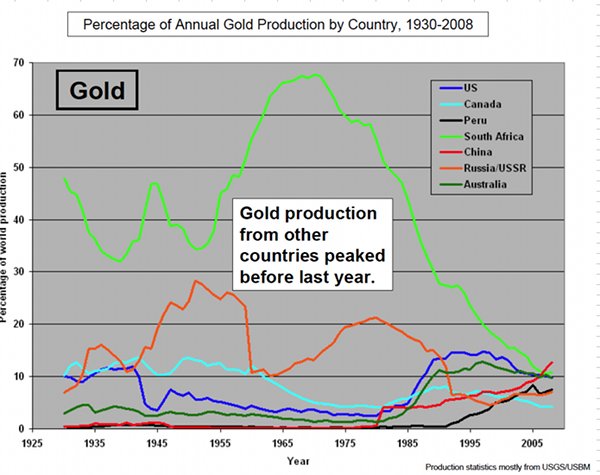 Figure 38: percentage of annual gold production by country from Price showing an incorrect collapse of Russia production in 1961 |
4.Thomas Chaize and his site.
5.V. Korolenko 2004 Prospects for the Production and Processing of Gold in Russia.
6. R. Flynn Estimating Soviet gold production 1975.
Compiling and correcting all the data, the cumulative gold production is at 15 kt in 2008 and is modelled with an ultimate of 20 kt (USGS 2009 reserves = 5 kt and reserve base 7 kt).
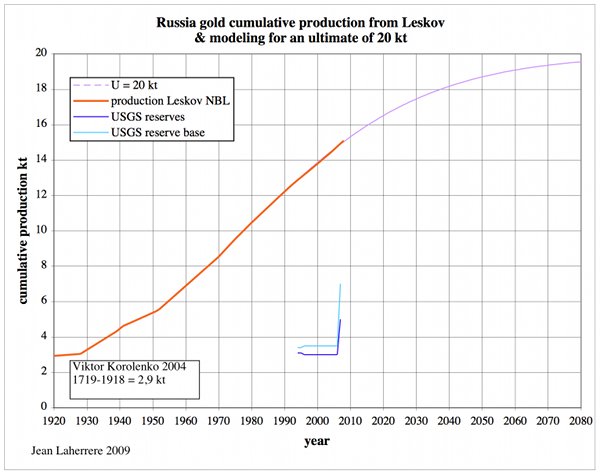 Figure 39: Russia cumulative gold production and modelling for an ultimate of 20 kt. |
Russia’s gold production should peak again around 2015 at 200 t/a and decline until 2060.
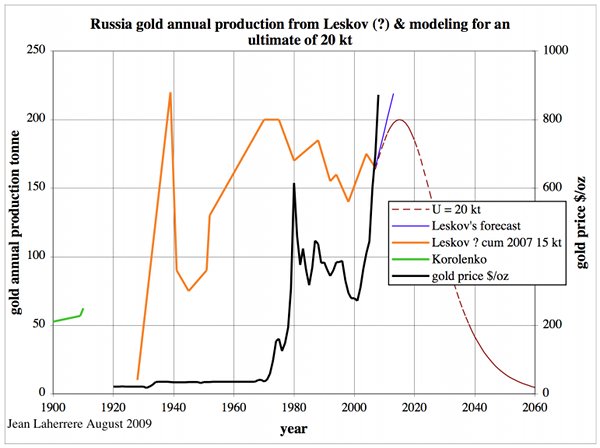 Figure 40: Russia annual gold production and modelling for an ultimate of 20 kt. |
Uzbekistan
As for all USSR countries, gold data is unreliable before 1991. Uzbekistan’s gold production is reported to have started in 1970, but with no data from 1980 to 1991. Cumulative production is at 2.5 kt in 2008 and modelled for an ultimate of 4.3 kt (USGS reserves at 1.7 kt & reserve base at 1.9 kt).
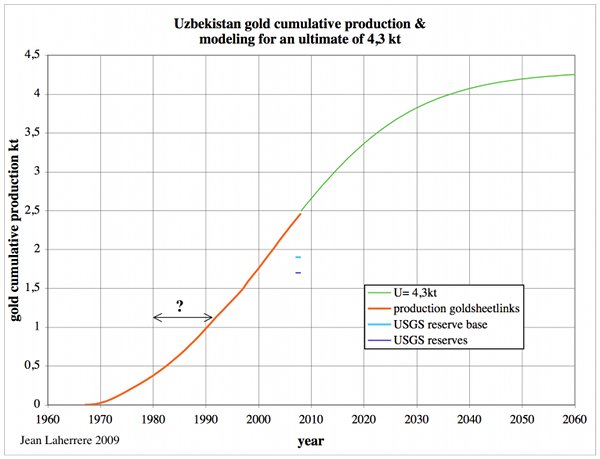 Figure 41: Uzbekistan cumulative gold production and modelling for an ultimate of 4.3 kt. |
Uzbekistan’s gold production has peaked in 1998 and could display a lower peak in 2012 with a decline until 2050:
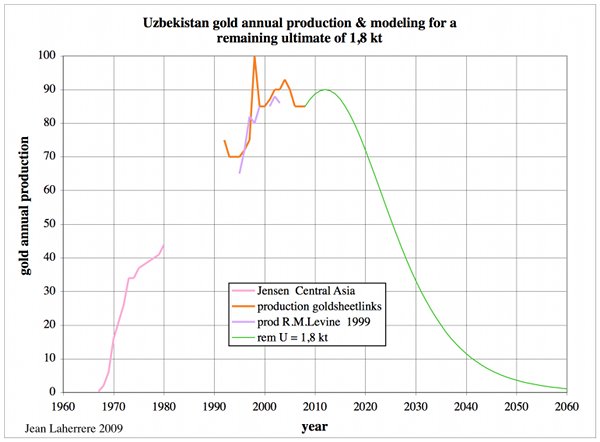 Figure 42: Uzbekistan annual gold production and modelling for an ultimate of 4.3 kt. |
China
There are many gold deposits in China:
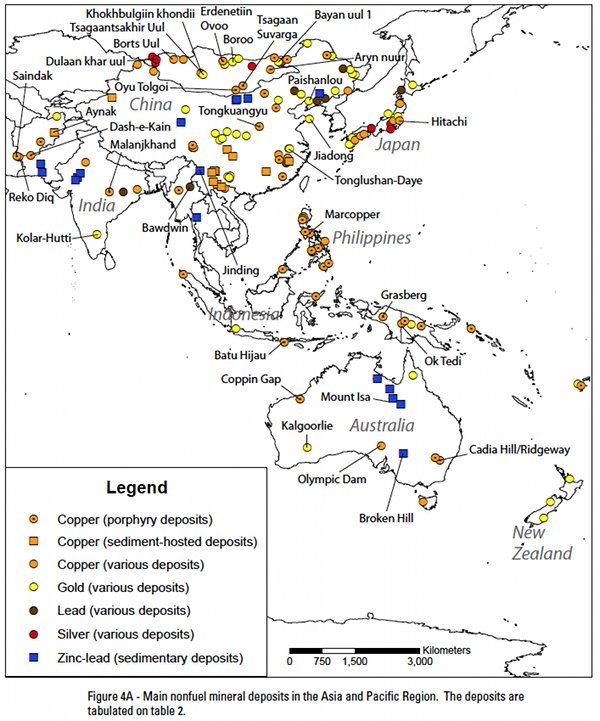 Figure 43: China gold deposits map from USGS 2005-1294. |
China’s gold production was low from 1930 to 1970, but before that it is unknown. Gold has been known in China since 1091 B.C. [pdf!] when little squares of gold were legalized in China as a form of money.
USGS estimates China remaining reserves at 1,2 kt with resources at 4 kt; cumulative production at end 2008 was 5 kt. China’s gold ultimate should be around 8 to 10 kt.
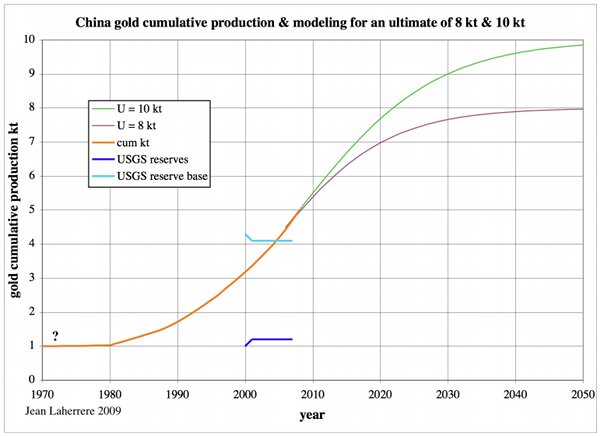 Figure 44: China cumulative gold production and modelling for an ultimate of 8 & 10 kt. |
China’s annual gold production should peak between 2010 and 2015 and then decline sharply.
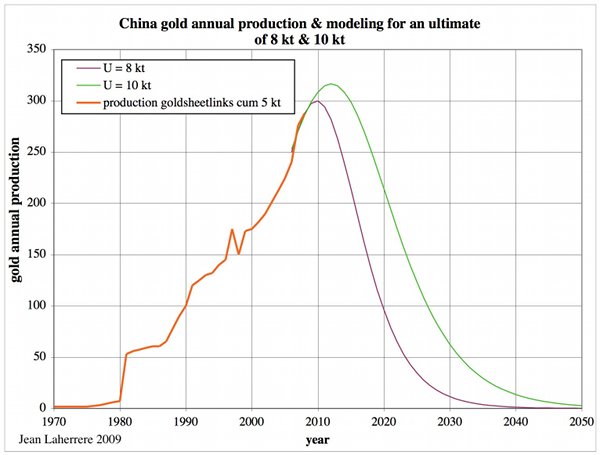 Figure 45: China annual gold production and modelling for an ultimate of 8 & 10 kt. |
Indonesia
Indonesia’s gold production is unknown before 1970 and cumulative production is about 2 kt at the end of 2008. The USGS estimates remaining reserves at 3 kt (but 1.8 kt in 2006) with resources at 6 kt (2.8 kt in 2006).
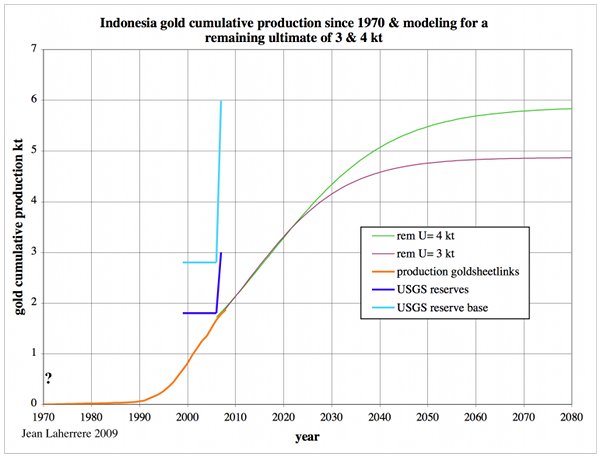 Figure 46: Indonesia cumulative gold production and modelling for a remaining ultimate of 3 & 4 kt. |
Assuming a cumulative production of 2 kt in 2008, the ultimate is estimated at 5 to 6 kt. Indonesia’s annual gold production has peaked in 2005 and should peak again at the same level around 2015-2020 and decline until 2050:
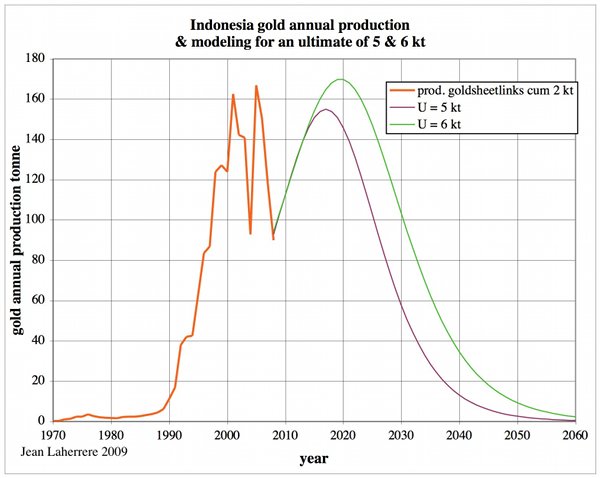 Figure 47: Indonesia annual gold production and modelling for an ultimate of 5 & 6 kt. |
Papua New Guinea (PNG)
PNG’s cumulative gold production was at 1.6 kt in 2008 and is modelled for ultimates of 3 & 4 kt (USGS reports reserves at 1.3 kt and the reserve base at 2.3 kt).
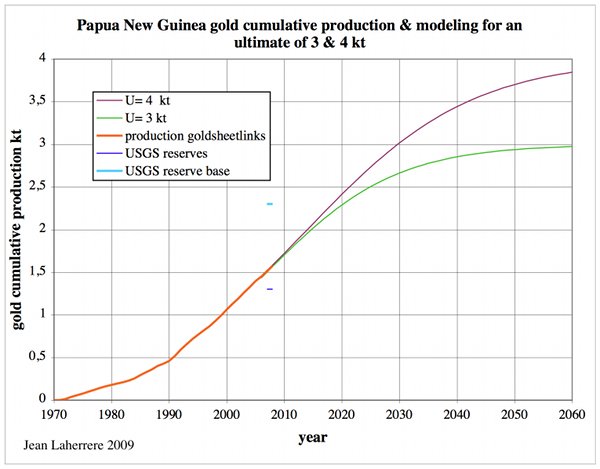 Figure 48: PNG cumulative gold production and modelling for ultimates of 3 & 4 kt. |
PNG’s annual gold production should peak during the 2010s and decline until 2050.
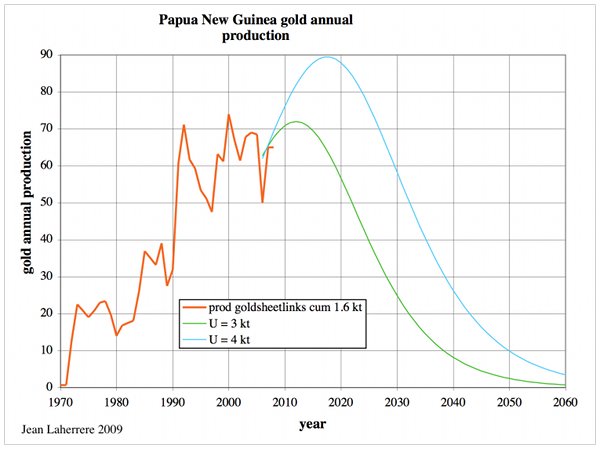 Figure 49: PNG annual gold production and modelling for an ultimate of 3 & 4 kt. |
Synthesis of main producers
The data from the above graphs on highest peak and year, annual and cumulative production for 2008 and ultimates are gathered in the following table, and the subtotal of these 14 producers compared to the world figures. These 14 producers sum to 80% of the world's production in 2008 (as cumulative production) and 66% of the world’s ultimate value.
| Country | Highest peak (t/a) | Peak year | ap** 2008 (t/a) | CP** 2008 (kt) | Ultimate (kt) |
| S. Africa | 1000 | 1970 | 234 | 52 | 58 |
| Russia | 220 | 1939 | 174 | 15 | 20 |
| US | 366 | 1998 | 230 | 17 | 20 |
| Australia | 309 | 1998 | 225 | 12 | 17 |
| Canada | 175 | 1991 | 100 | 10 | 12 |
| China | 288 | 2008 | 288 | 5 | 9 |
| Indonesia | 167 | 2005 | 90 | 1,9 | 4,5 |
| Uzbekistan | 100 | 1998 | 85 | 2,5 | 4,3 |
| Brazil | 105 | 1980 | 40 | 3,4 | 4 |
| Peru | 207 | 2005 | 175 | 2,6 | 4 |
| Ghana | 84 | 2008 | 84 | 1,9 | 4 |
| Chile | 54 | 2000 | 42 | 1 | 3,5 |
| PNG | 74 | 2000 | 65 | 1,6 | 3,5 |
| Mexico | 41 | 2008 | 41 | 0,6 | 2 |
| subtotal | 1873 | 127 | 166 | ||
| World | 2600 | 2001 | 2356 | 160 | 250 |
* ap = annual production.
** CP = comulative production.
In the following installment, Jean will look at the World's perspectives as a whole.
Previously at TheOilDrum: Peak Minerals.


I guess that is a rhetorical question - "Easier to Model than Peak Oil?"
Here are two plots that seem to summarize everything. I don't know how much of a swag they are in terms of historical accuracy.


The ore grade question really puts a wrench in simple modeling. The increasing amounts of lower and lower grades seems to mitigate certain aspects of the peak profile, not to mention the recyclable nature of gold.
Does anybody know how much gold is used in processes where it is lost to eventual recovery?
I do know that some electronic and electrical gear contains small amounts of gold that might or might not get recycled for instance.Some dental gold is laid to rest with it's owners.Doubtless some small quantity is lost every year never to be found again.
OldFarmerMac,
I do not know how much gold is lost due to difficult recovery.
Apart from electronics and dental applications, I think small quantities of gold are utilized in some UV protection lenses and in some luxury chocolate desserts (very thin gold sheets that can be eaten).
In Japan there are some luxury SAKES that contain very thin gold flakes (about 4mm X 4mm but extremely thin) and you
do not feel anything when you swallow the gold flakes in the Sake.
George, Thanks for reminding me of an interesting tidbit of gold knowledge.
The best quality welding lens is made by puttting a very thin layer of gold on a clear plastic lens.
There are two common sizes , about two by four inches and about five by six inches and a few years ago a large one was only twenty bucks.
Nearly every welding supply company keeps them in stock and if you put one in a nice frame it makes a unique gift for the ladies- not every girl has a Cleopatra's mirror.
Oldfarmer, it would be interesting to find out how much gold in wedding bands and fillings is buried each year. Like the kings of Egypt, many like to inter the dead with teeth and rings in place.
The Flex and die that does the printing on Ink cardridges is Gold plated as the Inks tend to be corrosive. Lately Palladium is being used as a cost reduction.
Good reason to recycle your used cartridges rather than bining them. They Also contain silicon( main part of die) and Tanatallum for firing resistors.
Rib
A staggering amount of fossil energy must have been used in the production of that gold, ranging from diesel and ANFO explosive to electricity. Could it have been better spent on clean energy investment? With declining GROEI we could misallocate even more energy.
I note that perhaps unlike platinum every continent seems to have been 'salted' with gold. That could be Mother Nature's teaser to make sure everybody thinks they could make it rich near home. Heavy as it is silver would still take up too much volume to move around. It is claimed that high tech metal indium is about as common as silver. Perhaps that could be the new precious metal, or gallium or tantalum.
I didn't catch mention of the possibility of a gold bubble. If we descend to anarchy tins of baked beans could be more valuable w/w than gold. Some will say you will always be able to trade gold for basic necessities but that didn't help the Incas. Between now and year's end I'll have an each way bet by both growing food and panning for gold.
With a melting point of about 30 C and a low density of about 6.01g·cm−3
gallium does not seem a very good candidate for storage as precious metal in the traditional sense. Compare with silver with density of about 10.5 g·cm−3 and a melting point of 962 °C.
There is no question though about the value of gallium in semiconductors and other applications and like the rare earths it has intrinsic value in industry.
I think gold is waaay overrated. A short while back I did this back of an envelope calculation as a response to a comment about the value of gold compared to oil.
So I'll just take the beans, thank you! The rest of the Midas' of the world can eat the gold...
I'll have to disagree. History is a pretty good indicator that 20 years from now an oz. of gold will still buy a lot of beans. I agree that it doesn't really make sense, except that, after all fiat currencies have diminished in value or failed, golds usefulness as currency will still be there (at least in the relative near term). It's about perception.
ps. Gold's at an all time high this morning. How much did your beans go up? (I know, apples and oranges)
An oz of gold won't buy ANY beans today or tomorrow. You have to convert it into money first.
OLDCHUCK....LOL. That was a good line. Air Force Pilots are given an ounce of gold because if they crash land, THE WORLD KNOWS what a PIECE OF GOLD IS. China just announced to its citizens to save 5% of its savings in GOLD and SILVER. The United States on the other hand, wants its citizens to BUY CASH FOR CLUNKERS and TAX INCENTIVE HOMES with BORROWED MONEY. What a fricken JOKE.
OldChuck...at some point when AMERICANS lose most of their PAPER ASSETS, they will then exchange GOLD and SILVER for things. The US DOLLAR will be used for TOILET PAPER.
GOLD IS MONEY! the paper crap is fiat money built on faith in lies. BTW in WW2 British pilots flying over Burma (and presumably other back areas) were issued silk maps and gold sovereigns in case they had to walk back to allied lines. So half naked tribal people KNEW the intrinsic value of gold.
I have a few cans of baked beans (amongst my food stash) but my gold coin stash is in case I need to flee to another country. What other country? I don't know as the situation after a crash is unknowable at this stage and will be fluid and therefore gold is the perfect medium of exchange. It can be traded for just about any currency, it doesn't collapse in hyperinflation, it can't be demonitized, it doesn't rust or get eaten by vermin, it can be paid to border guards and people smugglers and best of all the amount of gold that I can carry in a descrete pouch (or up my rear if need be)is a small fortune in any country.
Yes, but so what?
What you are saying is true for all investments.
You hand me some gold, and I'll hand you some beans.
(They'd be rattlesnake beans. Not many, but at this time I'd hand you the beans if you'd hand me some gold.)
If you don't, somebody will.
Which goes to show that gold DOES act as money - because money is a way to exchange value.
This is an excellent point....gold is over rated. Nobel laureate, Frederick Soddy, discusses how gold is used as a surrogate for wealth in his book "Wealth, Virtual Wealth and Debt" published in 1926. Soddy describes real wealth as the ability to direct and control energy flows.
My point, exactly. Gold is over-rated. A substance is as valuable as people think it is. How many people have left a perfectly good farm to cross a continent to try and find gold?
yes, as long as people continue to think gold is real wealth they will continue to own it. But, once it is seen for what it really is, people could easily dump their holdings and it would lose value.
On the other hand, having control over useful energy flows will always represent real and lasting value. This value will likely increase over time as these resources and their ability to do work become more scarce.
I am with Soddy on this but still own some gold stocks which, as you point out, have appreciated nicely.
Gold has been a store of value due to the amount of LABOR that is contained in each coin. Oil has taken over the LABOR content of gold for the past century. When the world systems collapse along with the electronic infrastructure, GOLD and SILVER will remain as stores of value.
At some point in time manhind may make a LEAP into new forms of energy, but until then it looks as if the OLD FASHION WAYS will be ones best insurance. All complex systems collapse as TAINTER has stated. The United States infrastructure is rated a "D" by the Army Corps of Engineers. We are literally starting to swim in our own effluent. There is no capital for the USA to invest to fix a system that is really unfixable.
Gold and Silver will continue to be stores of value as other means are not as efficient. Electronic Money will become increasing difficult as daily systems disintegrate. Few see this coming....as always.
You could say the same about iron ingots, houses, cars, etc. too. They are mostly embedded energy in one form or another.
Hope we use some of that silver to help build CSP plants and create that LEAP forward into new forms of energy supply.
Who knows what forms of money will ultimately prevail.
Jim....let me clarify my statement. Gold and Silver have been the universal stores of value because of their rarity as well as the ability to hold up over time. If a person wants to keep 5 tons of IRON in ones pocket....I say..feel free to do so. Also, Suburban homes are not a good store of value due to their NEGATIVE EROI. I would also like to state that within a few years....automobiles will not be a store of value. Small cars that are 3-5 years old and are cheap will have the best market value. The CLUNKER CAR PROGRAM's initial success will become a huge disaster within the next year or two as millions of cars are dumped on the market.
I am really concerned for the typical JOE-BAG-OF-DOUGHNUTS out there with their overpirced SUVS on a 72 month payment, a glorified McMansion that is underwater, and worthless electronic paper assets. This will come down and be felt like a 2X4 across ones forehead.
Gold and Silver will remain as the best stores of value, as many rub their BEN BERNANKE RABBIT FOOT for the FIAT PONZI system to continue so they can still live their carefree SUBURBAN LEECH and SPEND ECONOMY.
SRSrocco
It is my understanding that the "clunkers" that were traded in were all destroyed. Were these the cars you referred to when you said "millions of cars are dumped on the market"?
PriorityX...no, this is not what I was refering. The whole US economy is based on earnings as well as borrowing and money printing. The Chinese were going to dump US Agency Paper (basically worthless Mortgage paper) on the market with the remark, you do with them as you please. If the Fed allowed this to occur, then interest rates on mortages and Fannie Mae bounds would rise....meaning certain death to the present economy. This is the reason why the Federal Reserve now has over $920 billion of worthless mortage paper on their balance sheet. They have taken these worthless mortgage assets and sold foreigners short term US Treasuires....as no foreign country is stupid enough to take teh 10-30 year notes.
In due time, and this might be take place from between now and 1-2 years, the US Dollar will be defunct as a world reserve currency. When that occurs, there will be bank closures, ATM shutdowns, Supply Chain disruptins, empty supermarkets and gas stations for starters. Soon, millions of cars will be dumped on the market due to the fact the most Americans will not be able to afford the Gas or Payments.
As I said, automobiles either small pickup trucks or small cheap cars with high fuel mileage will be the most in demand. It will be the end of the SUV as we know it. The United States as most of you know only provides domestically 1/3 of its energy needs in liquid fuels. When the US Dollar dies, we will lose a great deal of those imports. Rationing and high prices are coming.
Thanks.
sorry, plenty of miss spells and few errors in post above....for some reason I cannot edit. My bad.
Even if a gold coin represents a lot of kJ or kilocalories of physical work, the value of something cannot be
more than that someone is willing to pay for it.
Therefore, in the long term, IMO, gold will lose a large proportion of its current value.
I think it is better to have 3 or 4 steel watches than 1 gold watch.
Yes....I know...people want to try to go against 6,000 years of history. Listen...I am not here to try to prove that GOLD is money...if you are watching the markets right now...GOLD has hit another RECORD. People are just clueless when it comes to money as they are with the EROI. They think those FEDERAL RESERVE NOTES (FRNS)are money....well that's a laugh. Zero Hedge states:
Here Is Why The Dollar Is Now Effectively Worthless
http://www.zerohedge.com/article/here-why-dollar-now-effectively-worthless
NOTE: can anyone give me the correct procedure in posting a picture in here? Thanks.
Anyhow, there is about $920 billion in CIC...currency in circulation according to the FED, and they now have $997 billion in worthless MBS and FHA paper on their BALANCE SHEET. So...those FRN's that everyone has in their pockets are now backed by WORTHLESS FANNIE MAE and MORTGAGE BACKED SECURITIES....eat ya hearts out.
One day...when the US DOLLAR DIES...GOLD and SILVER will become money again. Not because I want them to...but because the MARKET SAIDS SO. If you want to think of a better source of MONEY....be my guest....its a free world. But, going against the world markets and 6,000 years might turn out to be folly in my book.
word......
I agree with you that I don't understand why this is not explained at
http://www.theoildrum.com/filter/tips
"No help provided for tag img."Do the editors want to fool us?
My advice:
Look at the source code, which has examples like this:
(bracket)img src="http://www.theoildrum.com/files/JL_Au_02_AnnualProductionLogScale.jpg" /(bracket)
And most people on TOD would agree that to put everything into gold would be stupid. As for what will be of value after a "fall", something as common as a Bic lighter today could be "worth it's weight in gold". In our just-in-time economy there are many things which will increase in value more than gold. Medicines, shoes, batteries, ammunition of course, salt and sugar, other food preservatives, more, all will increase in value in a big decline because the stockpiles of the past no longer exist. Most of the consumables we take for granted today should be in your stash. I still recommend having some physical gold and silver on hand because it is surely going to increase in value in the near term (as currencies begin to crash).
As for energy, yes! I worry more about someone coming to steal my solar panels more than my gold, because, to be useful to me I have to disply them in broad daylight. I always enjoy seeing pictures of Taliban soldiers treking through the mountains with PV panels strapped to their camels and horses. How much can I trade time on my PV powered grinder for after the grid fails? How much grain would someone trade for an hour's use of my PV powered grain mill, or meat grinder to make sausage, etc. Energy is always of value. A full bottle of propane might cause a riot at your local market someday. And just look how many local economies in Africa run on firewood. People walk miles for a bundle of firewood. And then there's water...................
Ghung...yes correct. To sit in a SUBURBAN HOME with no bulk food and no PLAN B with a great deal of GOLD is not a good idea. Dmirty Orlov spoke about this when he witnessed the collapse of the Soviet Union. Be that as it may, after a collapse, humans will reorganize as they have in Russia. If you just have grain or cattle for instance, these are not good form of trade if you want to buy a farm or small ranch. People will take gold at that point for large transactions.
Gold is heading towards $2500-$5000, unless we have a total collapse of the US DOLLAR (which is highly likely), and then you will have to measure gold in some other way. The LBMA and COMEX markets will probably default by either MARCH or JUNE of 2010 as the physical supply of gold is getting extremely tight and the manipulated BULLION BANKS like JP MORGAN and HSBS do not have the real stuff to back their PAPER SHORTS. This will be fun to watch these folks get a paper enema of a lifetime.
A great deal of fun ahead.
Which brings up the idea of land as a store of value, something that isn't often discussed here. I have a neighbor who doesn't farm but does have property. He maintains several garden areas and rents out plots to others for a small fee( to cover his property taxes). He in turn gets a pecentage of the harvest every year. I have made a deal with a local cattle farmer to use some of my pastures. He will fertilize them and give me calves for the use of the pastures. My sisters sold the family herd several years ago when my mother died and so this works well for me. After a few years I should be able to develope my own small herd. While the monetary value of my land has dropped recently (the bubble burst around here big time), it isn't for sale anyway, so it's value to me hasn't gone down. Those who managed to aquire and hold land in Russia after the SU failed saw that wealth preserved in a fashion that those who held rubles must really envy. If one can hold on to it there is little I consider more valuable than good land because, as they say, "they ain't makin' anymore of it". (I do have about 15 acres of good land for sale if anyone is interested, good survival property. Sorry y'all!)
Standing timber holdings fall into this category and also contain lots of useful embedded solar energy.
Jim, Here, here. Lets hear it for standing timber, the value of which has outperformed the major stock indices for over 100 years.
Yes, it it interesting to think of things that have long term and lasting value such as standing timber and the control of other useful energy flows. The output of a solar PV system or wind turbine are certainly good expamples of this. I would also look at this from the demand side and include bicycles, gardens, high efficiency transport vehicles, living in walkable communities, and other things where energy flows can be reduced as a result of incorporating them into our lifestyles. This is probably the easiest way for most people to control their useful energy flow needs.
However, for the many reasons that have been mentioned here, Gold certainly has its place in an investment portfolio.... at least for now.
I am sorry to say that I do not remember the college in this story but I think it was either Kings College or Trinity College, both in UK, and the time period is the 20th century.
One day an enterprising student of entomology was crawling around in the timbers supporting the roof of the large dinning hall of the college when he discovered some beetles boring in the oak beams. He reported his findings to the Dean and the Dean called the College Forester. The Forester said, "We've been wondering when you would be needing them." He explained that when the College had been founded, 700 years before, a grove of oaks had been planted, and since that time the College Foresters had been passing on the information saying, "One year they are going to need these trees for new beams in the Halls."
That's the way to do a civilization.
About 20 years ago the Danish Forest Service reported to the King and the Danish Royal Navy that the trees planted to replace those burned by Lord Nelson# were now ready for use in warships.
Alan
# He burned the forest to keep the Danes from building a replacement Navy for the one he sank.
Treeman,
Don't you you guys realize that you are likely kicked out of the foresry profession for revealing trade secrets? ;)
If the economy does recover we ain't seen nothing yet in terms of the prices that timber will eventually fetch.Every year the population goes up, nonrenewables get scarcer, and the amount of harvestable forest acreage declines.
A lot of things that are currently made out of petroleum will be made out of wood again before too long.
Whole entire counties that were forty or fifty percent timber have been converted to subdivisions around here in the last thirty years.The trees are still there- quite a lot of them anyway-but they will never be logged off thr two acre lots.
The value of gold, the investment of energy into mining gold, the hoarding of gold, the gold market (with as as far as I understand it is chock a block full of derivatives, in short intermediaries make a lot of money), the turning of gold into ornaments, simply represents the fact that for humans gold is a traditional store of value and a status symbol, with the former and the latter tightly related, be if for my friend X who has a kilo of gold in the Bank Vault, and K., the Indian lady who jangles the bangles. (Setting aside any industrial value.)
Therefore its value, and the effort (investment, energy, cartels, laws, monopolies, deals, etc.) sunk into its mining, refining, transport, transformation, the ‘market’, etc. is solidly part of the realm of human psychology.
Gold bugs like to stress gold’s scarcity or ‘fixed amount’ (?!) as opposed to fiat currencies which are printable at will (ask Bernanke) and are always bound to fail, according to them. The dearth or difficulty of extraction (labor costs, etc.) is a PLUS point.
So Gold is static in a way, compared with oil which is dynamic, as oil is always used for other purposes, be it only driving to the garage to buy beer. As the end-use is so different, it is hard to compare, relate, the two without some ‘metric’ to ‘figure’ or ‘represent’ the value humans assign to various things - gold, oil, flat TV screens, a bobbed nose, Barbies, and so on.
Wonderful top post though. Never thought about gold much. Food for thought.
My mom survived WW2 as a teen - she and her family had some gold left, it proved untradeable. Wood (not to mention petrol so scarce it hardly counted) food, cotton, wool, screws, boots, sex, basic tools (sometimes), socks, an animal (any), yes. Gold, not. Even lipstick - better. ;)
You mentioned "K., the Indian lady", so FYI The Reserve Bank of India may well buy IMF’s remaining hoard of 200 tonnes and is now trying to negotiate an acceptable price. It bought 200 tonnes at the beginning of the month.
That is partly why I thought of her. Also (I have been told) in India bangles and the like do represent a store of value - gold jewelry in Switz for ex. not at all. So the bangles, slim circles, neatly embody of all of gold's value attributes.
Gold Hits New Record High Above $1,190 on Weak Dollar
http://www.cnbc.com/id/34143345/site/14081545
This was an appropriate day to have this discussion
I dunno. Hasn't mankind been leaving their farms for thousands of years to go sack their neighbor empires for loot?
Also, theres some arguments going around about the energy put into goldmining making it valuable, value derived just from relative rarity, or about historical precedent. I'd argue that there doesn't need to be a logical reason why its gold and not another commodity, but its just simply what everyone settled on. Its both necessary and convenient.
The Saudi's need goods for their oil - what are you going to do in return? Settle on 20 tons of fish, 100k tons of fertilizer, etc.? No, you're going to give them gold for delivery and they'll use that to buy goods as they please. I think its a done deal.
Soddy did not live in an era of central bankers printing money like mad to bail out institutions and governments that are saturated with debt.
Gold is not always a good investment. It is a very good investment in today's climate.
You and other gold bashers are completely missing the point. Gold is not be compared to food. Obviously, food has intrinsic value and gold doesn't. But gold is good for investment purposes when people lose faith in central bankers and fiat currencies.
If you have $100,000 to invest (& you are already debt free, have a garden in your backyard, etc.), you cannot invest in things which have intrinsic value like food (perishable), NPK fertilizer or fossil fuels (difficult to store). If you don't live in a sunny climate there is no point in investing in solar panels. If you don't like farming or have no expertise as a farmer there is no point buying farmland. Also, the farmland has to be close to where you live and work and it has to be of a certain size to be viable.
There are numerous advantages of investing in gold at a time like this when Bernanke is hell bent on destroying the US $.
1. You can invest as little or as much as you want. You can buy 1 gram of gold or 1 kilo.
2. It is not perishable; it does not rust or corrode.
3. No need to worry about defaults or dilution or fraud. Unlike paper assets, your gold bullion asset is not someone's liability.
4. You can easily fit a million $ worth of gold in a briefcase. Leave it in a bank locker and unlike investment property you don't pay for maintenance.
A very simple question to gold bashers:
Did you ever invest in paper assets? What is the intrinsic value of paper assets?
If you don't live in a sunny climate there is no point in investing in solar panels.
Bull.
At the point where gold/silver becomes the common money, what chance is there that the electrical grid will be working enough to provide power?
Your labor is worth 90-400 watts (upper body-lower body) Where can you buy a 'slave' who does 600 watts of work when the sun shines over 20+ years for under $3000?
How much mixing/churning/clothes washing/wood cutting labor are you going to buy with the electrical power from the sun via PV VS human labor?
Good points on the solar PV vs human labor! According to Soddy, about 70% of the energy we take in is used to power our bodies and just to get around. This does not leave alot that can be used for physical work. Also see: http://www.bmi-calculator.net/bmr-calculator/harris-benedict-equation/
IMO the electric grid and power plants may eventually become some of our most valued assets and people will go out of their way to keep them running for as long as possible...that is until the second law of thermodynamics takes its toll on them.
I don't think gold and silver will become common money. The US $ or some form of paper money will always be common money. However I expect the value of paper money to drop a lot when measured in gold.
If it ever gets to the point where the grid is not reliable, it would be worth it to invest in solar panels even if you don't live in a sunny climate. But I think that is a long way off if it ever comes to that. In the meantime gold is a better investment.
Even more interesting than gold, in this respect, is silver. Unlike gold, it is used up in many manufacturing processes. Its use could accelerate dramatically in a solar-powered world. Silver’s traditional use categories include coins and medals, industrial applications, jewelry and silverware, and photography. The demand for silver in industrial applications continues to increase and includes use of silver in bandages for wound care, batteries, brazing and soldering, in catalytic converters in automobiles, in cell phone covers to reduce the spread of bacteria, in clothing to minimize odor, electronics and circuit boards, electroplating, hardening bearings, inks, mirrors, solar cells, water purification, and wood treatment to resist mold. Silver was used for miniature antennas in Radio Frequency Identification Devices (RFIDs) that were used in casino chips, freeway toll transponders, gasoline speed purchase devices, passports, and on packages to keep track of inventory shipments. Mercury and silver, the main components of dental amalgam, are biocides and their use in amalgam inhibits recurrent decay.
All of the remaining silver in the National Defense Stockpile was transferred to the U.S. Mint by the Defense Logistics Agency for use in the manufacture of numismatic and bullion coins by the end of 2004.
Probably about the year 2030 World silver extraction will peak and the uses of new silver in technology will have to diminish.
More good news for silver:
Jean, excellent post. The amount of cyanide and energy increases exponetially as the ore grades fall. I believe the EROI of energy will decrease the available NET ENERGY available to the world much more drastically than most are forecasting.
Furthermore, the graph of silver peaking in 2030, looks like it corresponds to the IEA WEO of the world peaking in oil production in 2030. If the peaking of oil production is in 2008 as some have proved in this blog, then SILVER PRODUCTION will peak soon there after. 72% of silver mining comes from BY-PRODUCT mining. KGHM Polska Miedz SA of Polland was the second largest silver producer in the world in 2008 according to the GFMS. Polska Miedz's main production is copper. With the Disintegrating Global Economy, I don't believe base metals will increase in 2009.
Silver production will decline approximately 700 tonnes or more in 2009. I think the year that silver will peak, could have been 2008. Silver has the least amount of RESERVES in the world compared to all other metals.
From a consistency standpoint I have huge issues with the use of multiple logistic curves to fit the depletion data. The world silver extraction curve shown says that it uses a multiple "Verhulst" fit to describe the overall trend. The inconsistency is that the Verhulst is a deterministic equation which results in a logistic, yet we know that the data itself is highly dispersed in time with a random character, and clearly non-deterministic, so we should not use the Verhulst.
All is not lost however, since you can get a logistic shape if you use a dispersive formulation to set up the problem. This may not sound like a huge deal but if you really want to understand this from a scientific, or at least applied mathematics, point of view, but we really have to drop the Verhulst. I can name several other reasons to dismiss the Verhulst from a correctness standpoint (causality, initial conditions, meta-stability, non-composability, no fat-tails, etc), but suffice it to say that the dispersive formulation suffers from none of these problems.
The other aspect of this is that you can fit any curve given that you select enough variables. When that is coupled with no understanding of what provides the fundamental mechanism, we are left with a situation of absolutely no insight in where we have been and no confidence in any kind of projection or prediction. (I suppose everyone wants to make profits on their investments in precious metals so I assume people consider this an important issue.)
I know that I will get some criticisms for apparently not talking in "plain english" on this topic, but don't blame me. Everyone that plots one of these curves with the label of "Verhulst" is bringing it on themselves. They have made the decision to credit an invalid premise (i.e. deterministic equations) that has an even more complex mathematical basis, so I can only fight fire with fire, so to speak.
It is essentially like we have the Wall Street financial quants with their warmed-over physics equations analyzing depletion; and we know what a mess that they created. They never understood or incorporated the "Gray Swan" fat-tail statistics in their formulations, and the depletion folks haven't been working from a valid premise either. Unless we do this right, we have no idea which way the trends will go.
And this isn't directed at you Mambo, but L.David Roper and the other depletion analysts that do the modeling and try to fit the data.
Considering the number of variables and the often questionable data, I usually take the results of models and graphs with a grain of salt (especially where commodities are involved). There is way too much incentive to slant the data. When energy and precious metals are involved I have better results tempering anyone's results with an intuitive evaluation. Not that the work you guys do isn't of value. I just use a foundation of common sense to build my decisions upon. As for energy forecasting, I think that chaos theory comes into play. Maybe some of the very successful weather modeling systems using chaos theory would be of use.
Lots of resent research on chaos theory suggests that randomness in outcomes plays a very straightforward role. It is not always non-linear determinism that causes chaos; in many cases it is just ordinary expected behavior filtered by random or uncertain parameters or conditions. Weather prediction is an interesting case. How about climate change, would you rather believe the outcomes are predictable in a stochastic sense, or totally unpredictable and chaotic?
Thanks WHT. I'll take that as a not. Or a maybe. Weather its the MSM, TOD or Thankgiving with my 5 older sisters, I'm always looking for better ways to extract useful data from the noise.
Happy Thanksgiving!
I share your apprehensions, WHT. None the less, if we think if any mineral extraction curve as bell-shaped, we can take our logistic curves as a set of basis functions to represent the measured curve; ie, f(x) = sum{a_n g(x-x_n)} or something like that (g(x) is a logistic centered at 0); the point is that there are exogenous (non-random) events that give you a non-random set of coefficients a_n and x_n. One such example is the peaking of US oil production in 1970; using two logistics in this case gives a much better fit, and makes sense, since the US was historically so important in the utilization of oil as an industrial fuel. Not sure what a 1920's peak in silver could mean (in any case, it's clear the logistic model doesn't fit the data very well, and doesn't account for the oscillations seen between 1900 and 1950). Just a thought.
I wouldn't use the logistic as a basis or kernel function. A "gold rush" shaped curve works much better and you can generate a logistic from the superposition. That is the basis of the dispersive model in fact. So I agree with your approach, but I want to make it more fundamental it to maximize understanding.
What is a "gold rush" curve? It is a curve that accelarates over time, say in an exponential fashion, and then stops abruptly. This simulates the gold rush behavior of resource exploitation in specific areas. The randomness or dispersion in these micro-gold-rush events leads to a characteristic bell-shaped curve if taken in aggregate. No one seems to understand this fundamental formulation..
WHT is absolutely right. OK, so we used 3 or 4 curves to fit the historical production data, what does that tell us about curves 5,6,7, and 8 in the future?
Much more interesting to me is the trend to much lower grades of ore and the observed fact that, as the grade decreases, the wastes produced and the amount of energy used increase exponentially:
From "Limits to Growth: The 30 Year Update" by Meadows et. al.
Cheers,
Jerry
Peak production of silver in the US was during WWI, almost one hundred years ago. It would be interesting, though perhaps not easy to study silver production from primary silver mines. As noted by SRSrocco, most silver production is byproduct. Its production largely depends on the price and production of copper and other base metals.
Even more interesting than gold, in this respect, is silver. Unlike gold, it is used up in many manufacturing processes
And high density power source used in, say, transport would use either 100+C superconductors (err unobtanium ATM) or silver due to the resistance VS weight.
*IF* the true believers are right about supercapacitors - the buss structure of such units might just be silver.
A thirty percent cost reduction here, a ten per cent reduction there , and another ten somewhere else-pretty soon we will have truly competitive renewable energy if this pace of cost reduction can be maintained.
Plenty of diesel needed in these gold mines to move overburden etc. See details of the Boddington gold mine in Western Australia (page 8&9)
http://www.dsd.wa.gov.au/documents/Prospect_23_June_2009.pdf
Just published:
Sydney doesn't need a 2nd airport
http://www.crudeoilpeak.com/?p=670
It seems like peak metals and peak oil will have an impact on gold extraction--it will become progressively more difficult to get the metals and oil needed to do the extraction, so extraction may fall off faster than expected.
At the same time, peak credit may (or may not) expand the use of gold as an alternative to our debt-based money. This could increase the value of gold as a tradable item.
We are now in a situation where gold is making new all time highs but crude oil is not. Therefore it seems to me that gold producers will not be much hampered by oil prices if this continues.
And it is a little strange that oil is lagging behind when it is the depleting resource that is actually consumed. Except for some wastage the depletion of gold is nearly exactly offset by gold accumulating in storage, in use as jewelery or dentures and the like, unlike oil.
And gold has many substitutes although not as desirable. We can live without much gold and many people do including myself. My gold tooth caps are the only gold I own.
But try living without oil. If gold was $30/oz back in the day when oil was $3 a barrel, it seems to me that with $1200 gold we should at least be seeing $120/barrel oil. Or am I missing something?
Maybe gold in now the price leader since its falling production due to depletion is more advanced than is the case with oil. In 2008 crude was the price leader. Perhaps gold's current action is foretelling the action the crude price will see when falling production is as obvious.
Or it could just be a case of rotating price leadership. Oil led until the 2008 crash when gold took up leadership in 2009. Maybe we will see oil resume price leadership sometime in 2010 when gold takes a breather in a basing pattern again.
I think it more likely that what we are seeing is a speculative bubble rather than a flight to safety. Also, I do not think that there is a wide spread awareness of the rapid fall in world-wide reserves of the glistening stuff - yet.
Gold prices have the nasty habit of dropping precipitously at the drop of a hat.
Invest at your peril.
Speculative Bubble....interesting. I believe the biggest PONZI SCHEME in history are US TREASURIES. Now...if one thinks GOLD is highly speculative, I would advise jumping into US TREASURIES with both hands. I am amazed at the lack of understanding when it comes to GOLD.
Anyhow....we just wait a little while and see if that PHAT WAD of FEDERAL RESERVE NOTES will keep you warm in the winter.
SRSrocco,
While you make some compelling points (I myself am not fully convinced gold has moved into the final speculative bubble phase from the recent "economic melt-down panic" phase), I find myself distracted by your overuse of CAPITALS. It reads as though you are CONSTANTLY SHOUTING.
Gold Bulls’ Three Stages
http://www.zealllc.com/2004/au3stage.htm
HARM....no harm done...aye. This is my style. I have been writing in this style for years. But because it is Thanksgiving....I will do as you wish:
First of all, I don't believe gold is in its blowoff move. There are several factors, but gold is heading towards $2,000-$5,000. If the Comex and Lbma default on their short commercial contracts, then gold will go into permanent backwardation according to its basis. When this occurs, gold will no longer be bought at any price. All future prices of gold in a fiat currency like the US Dollar will evaporate overnight.
Krugerrands and now Gold and Silver American Eagles sales are suspended until the early or middle part of December. The gold and silver basis has been moving in and out of backwardation over the past several days- week.
Krugerrands news here: http://www.numismaster.com/ta/numis/Article.jsp?ad=article&ArticleId=8590
US gold and silver Eagles suspension here: http://news.coinupdate.com/us-mint-suspends-sales-of-gold-and-silver-eag...
My Speculation is as follows:
During the G-20 meetings, the UK and USA central bankers and twits like Geithner are being ignored. That other moron, Gordon Brown the traitor of England had a speech about the central banks having a new tax to be used for future bailouts. That speech was received with as much of a positive response from the other countries as a person with syphilis. What is really taking place is behind the scenes.
I believe China, India and Russia along with other countries have decided to break the Comex and Lbma gold commercial short manipulators. India was choosen to buy the 200 tonnes of IMF gold and now want the rest. Russia's central bank announced that they will buy 30 tonnes of their own countries gold production. China was given the chore of breaking the Comex and Lbma with their huge US Treasury reserves.
During the last delivery month, the Chinese and other Asians asked for phyisical. The big bullion banks offered them "Spot plus 25%" in paper cash. The wise Asians refused and wanted physical bullion. There was a scramble for the bullion banks to get this gold. Well, they were able to satisfy the last delivery, but at the end of Nov and early Dec, another delivery comes around. We may have fireworks when more physical is taken off the market.
Most people don't have a clue about Gold as money. They think those Federal Reserve Notes are money....poor slobs. Central banks are now buying gold, while the commercial traders usually win all the time when they come up against speculators, they have lost twice in history when they have come up against countries. This will be far worse than what happened in 1980. Gold will not come down after its rise from $35 to $850 an ounce, like it did in 1980.
This will get much worse for UK and USA who are the worst economies on the planet...and by far the most manipulated and criminally syndicated. JP Morgan and Goldman Sachs are the left and right hand of the Federal Reserve. Without these two banks, the manipulation could have not been done. Interest rates, the US Dollar, Gold, Silver, Oil and US Tresuries have all been manipulated to allow the USA Suburban Leech and Spend Economy to go on a few decades longer.
Gold is heading higher compared to silver, but that will reverse when the focus moves from gold to silver. China recently told their citizens to take 5% of their earnings in gold and silver bullion. The Chinese central bank realizes their huge stash of worthless US Treasuries should fall on their shoulders and not their own citizens....as many citizens have been acquiring US Dollars in the past. This is very similar to the poor Mexican people who have been hedging their lousy Peso with US Dollars. Oh, what a fricken mess. Of course, the American people will be the last to know as they watch their life savings and retirement plans evaporate due to a defunct US Dollar.
When the US Dollar and US Treasuries die, so will the United States...as it will enter into a third world status. Get yourself ready....or deal with the consequences later.
Happy Thanksgiving
LAST NOTE: blogger Robert Wilson, has a good functioning brain stem. I advise paying attention to his posts....and drillo, thanks for the info on picture posting.
X: What you are missing is that the oil price is far more related to economic strength than the gold price, i.e. the higher the gold/oil price ratio, generally the weaker the global economy. Unlike oil, gold prices have no theoretical ceiling at all (China could singlehandedly drive the price to the moon at will). High oil prices dampen economic growth, creating a natural ceiling on price advance.
Therefore it seems to me that gold producers will not be much hampered by oil prices if this continues.
But if oil is in short enough supply, price will not be allocation method. Food production, transport of goods, emergency transport will get the oil before gold producers.
IMO, in all of the above senarios the trend in gold is up. Two steps forward, one step back perhaps, but up.
I have over $300K in gold. But even I think it's kind of depressing that we're going back to this metal, as they did in the earliest recorded history of our species, for symbolic value. Oh, that it has all come back to this, eh? Now that our futile human attempts at currencies seem to be failing, how frail we seem, once more on the path back to hoarding and trading bits of rare, shiny metal. Sad.
This is an excellent point and one that could upset the world's current "gold standard" mentality. If we get into rationing, which is entirely possible and has been done before, the available useful energy flows could be directed toward more basic human needs.
Let's say we resort to using gold in place of paper currency. Would each transaction require an assay of the gold first to establish its purity? For example, my jewelry won't be the same purity as yours. For this question I'm assuming gold coins are not being minted by governments. Anyone out there with assay experience that can speak to the issues involved in using gold (not in coin form) for financial transactions?
Current gold coins purchased as investments are worth too much for transaction amounts in the hundred dollar range. They would have to be cut up to be useful. When that happens the value of each piece is unknown unless an very accurate scale is available. These scales are not cheap and not readily available.
My point is that the higher the value per ounce the more complicated it becomes to use gold in everyday transactions because accurate weighing becomes increasingly critical as does establishing the exact purity. Plus or minus ten cents is vastly different than plus or minus ten dollars.
This is why many people who buy coins for possible future use as currency buy the 1/10 oz and 1/4 oz coins. Silver will be used for smaller puchases.
Precisely.
Silver was more extensively used during the nineteenth century here in the U.S. "rural" economy. Now with silver being a rarer metal than gold in terms of above ground supply, this could pose problems. In the above model, the assumption has to be that the government would mint appropriate coinage; not that that paradigm is practical even under the assumed conditions.
The one thing that many of the bloggers in here fail to comprehend is the CENTRAL BANK ASSET BALANCE SHEET. Before the US DOLLAR was dropped from the gold peg, Central Banks Balance Sheets did not change all that much. The US DOLLAR backed by Gold was being used to settle GLOBAL TRADE.
Today, Central Banks Balance Sheets are growing tremendously due to the fact they are acquiring worthless US TREASURIES as their ASSETS. Basically, Global trade is not being settled folks....the DEBTS are increasing. US TREASURIES are the next and biggest bubble to pop in history. The reason why GOLD is going much higher presently, CENTRAL BANKS around the world have gotten RELIGION again.
It might be in a few weeks, months or at most a year, and the US DOLLAR will be DEAD. This will be the day the GLOBAL MARKETS shut down, and Bank Holidays are announced. If people are in PAPER ASSETS like 401k's, Pension Plans, IRA's, Bonds, Treasuries and etc....your savings and investments will be wiped out.
Central Banks like INDIA, CHINA, RUSSIA and many others to follow are cutting their loses to the worthless WESTERN ECONOMIES such as UK and USA. The United States is heading towards a third world status. I pitty the yuppies who will have the toughest time adjusting.
I purchased a small cache of US silver and gold coins in 2007 with the bulk of the purchase composed of pre-1965 quarters and one-third of the purchase as 1/10 oz gold coins. I look at this as an emergency cache only and figured that something minted by the gov with known metal content would have some recognizable value as an exchange currency. I am realistic about whether I will be able to buy bread or grain with the silver quarters under a chaotic collapse scenario. We all have to realize at some point that no matter what we do to prepare, it may well make no difference in the survivability outcome. The value is in the present - to know that at least I did something to prepare and feel less anxious as a result.
If there is any food at all for sale I expect you will be able to buy it with silver and gold coins.
Otoh, I expect that many other items will serve just as well-a fifty five gallon drum of diesel treated with fuel conditioner might be just about priceless and the thing a farmer would want worse than anything else.
If there comes a time when food is in very short supply I expect most farmers -if there are any around still working-will take gold and silver as quick as anything.Most of the guys out in the country who grow your food are already well stocked with tools, firearms, ammo, and various other sorts of what most people would think of as survival gear.
But after a year or two boots, coats, gloves, and all sorts of hardware store type expendables will be in very short supply.
Anybody who really believes in an all the way to the bottom crash should get out to the country and ally themselves with some local farmers.This will take some time -building personal relationships takes time.But it will enable you to learn the subsistence game a lot faster and might keep you alive until you have a little experience under your belt.
The Opel Corsa D engines must help. And I'm waiting for them
PriorityX, Simple and accurrate scales have existed for centuries as can be seen in many dusty bazaars. Plenty of bullion coins exist (such as here in Australia) at 1/20 oz. Gold isn't for small transactions and small change can be met with silver coins (from little threepences up to crowns).
Change doesn't have to be money, when I lived in Egypt there was a shortage of small change so i regularly recieved matchbooks or chewing gum instead of 5 piastre coins.
During Germany's hyperinflation, copper pfenning were given in change for silver marks. Minor coins kept their value.
For the USA, nickels and pre-1983 copper pennies should have some residual value, based in part on their metal content.
http://www.coinflation.com/
Alan
It needs to be pointed out that most of the world does not work on US dollars per troy ounce but local dollars per gram. If I recall a troy ounce is close to 31 grams. If the gold price worked out say to $1240/oz that's $40 local currency per gram.
While digital scales carried by prospectors may be accurate to the nearest gram there is the additional problem of purity. If a raw gold nugget has only quartz impurities we can weigh it in water to get a weight difference in grams equal to volume v in cubic centimetres. The weight will be 19.3g + 2.65q where g + q = v. You do the maths.
In the case of an alloy like gold-copper-silver a subjective estimate of the non-gold content may also be necessary. If 24 carat is 100% gold but the gold looks like it has 25% copper that's 18 carat. Then the prospector may ask $30/gram not $40 in local currency for that gold.
Thanks for the informative posting, Jean. A few remarks:
The production profiles in Figure 1 clearly don't look like Hubbert curves.
This is a difference to oil, which has a permanent and rising demand, due to our oil addiction. Thus, with above ground factors playing a minor role in most areas the geological constraints are paramount in oil production - resulting in the Hubbert curve pattern.
However for Gold the demand depends on many above ground factors, e. g. purchase power for ornaments, gold fixed currencies, speculation etc., which overlay the Hubbert pattern. Furthermore psychological herd instincts (gold rush) might be important.
I think this is due to an "above ground factor": the variable gold demand. This may be a good explanation for the "multiple Hubbert curves", of e.g. the South African production (Fig. 5) - each for a different gold price level.
(BTW: The price relevance for gold mining may also serve as a good lesson about peak oil: If consumers can afford more expensive oil then more expensive oil production can be added to the curve, but if purchase power shrinks - like right now - the affordable oil production will be lower.)
It might be a good idea to check the (probably time lagged) correlation between the *inflation corrected* gold price and gold production:
Obviously around 1980 the inflation corrected gold price in 2006 dollars was still much higher than now, and I suppose that it was even higher in the 1930s. So there is still little incentive to invest in gold mines compared to those days. In other words: Gold price will still rise quite a bit before new, more expensive mining will take effect.
To me the gold price pattern (without inflation correction) in your graphs seems to indicate that at least in some regions (e.g. Australia or the US) the gold production did react to the sudden gold price rises after 1930 and 1976 with a time lag of some 10 years. According to this pattern we should expect another rise of gold production in the next few years due to the gold price rise since the beginning of this century. So in a few years will see if this time gold production will be curbed by geological constraints.
Elgin Groseclose wrote about money for several decades, beginning in the 1930's. He noted that money wears several hats. Among other things it must be a store of value, a medium of exchange and ideally a standard unit of constant value over time. Land, timber and stored fuel can function as a store of value but generally not as a medium of exchange. Beans and tools could fail as a medium of exchange if your trading partner already has a sufficient supply. When governments inflate the money supply paper fails as a standard. Gold and silver can be problematic as seen by William Jennings Bryan's "Cross of Gold" speech" and the failure of the bimetallic standard as silver production increased in the American West. Bryan hoped to inflate the money supply. Russia seems to be using multiple monies; Gold, US Dollars, Canadian Dollars and other currencies. Perhaps future safety may require diversification for both individuals and countries.
http://en.wikipedia.org/wiki/Elgin_Groseclose
Robert,
Well said Sir.
There is probably no such a thing as a sure thing anymore and diversification is surely indicated.
Google 'gold inverse pyramid'.
All physical wealth is going parabolic on a global level in the long term. The several quadrillions of paper wealth is starting to flow back into the much smaller amount of physical wealth. The questions you have to ask yourself are local questions? Will my farmland be nationalized, will my artwork be trampled on, will I have access to the global gold market. Gold seems like the best store in the medium term because of its liquidity, mobility, durability until one can answer the local questions.