| Report on ASPO Switzerland, September 26th, 2009, Conference at University of Basel | The Oil Drum: Europe | A Change Coming to the World Monetary System? |
North Sea Petroleum Reserves
Posted by Euan Mearns on October 5, 2009 - 10:32am in The Oil Drum: Europe
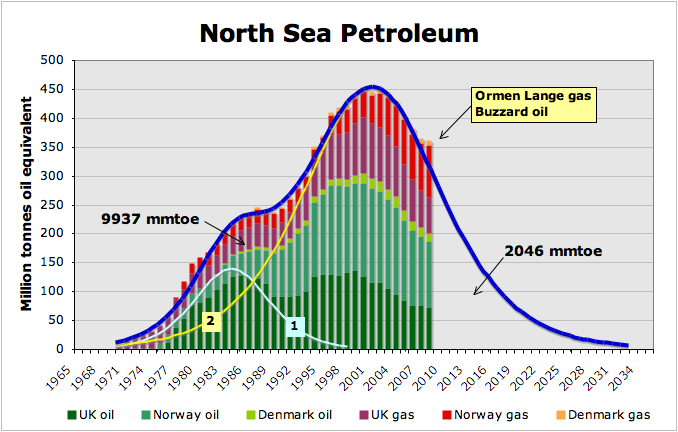
North Sea petroleum (oil+natural gas) production from 1970 to 2008 can be modeled to fit two Hubbert cycles. The first cycle represents surge production from the giant UK oil fields, Forties, Brent, Piper and Ninian. Actual cumulative production was 9937 million tonnes oil equivalent (mmtoe) 1970-2008 whilst the area beneath the two Hubbert curves is 9665 mmtoe - a difference of 2.7%.
To what extent the second Hubbert cycle will describe the decline in oil and gas production is highly pertinent but also uncertain. There are signs that the decline trajectory has already been influenced by a third cycle of giant field development with the Buzzard oil field and Ormen Lange gas field both coming on stream in 2007. The impact of this third cycle is shown below the fold.
In a February 2000 paper, The Hubbert Curve: its strengths and weaknesses, Jean Laherrere advises that the Hubbert curve works best where:
- There are a large number of fields
- Where exploration follows a natural pattern unimpeded by political events or significant economic factors
- Data from a single petroleum province can be amalgamated across international boundaries
Not many data sets meet these criteria, including those for the North Sea and it is clear from the production data that they do not follow a single Hubbert curve. The overall structure is heavily influenced by the double top in UK oil production brought about by the oil price collapse of 1986, that delayed on-going field development plans, and the Piper Alpha oil rig explosion of 1988.
The BP statistical review allows data to be combined from the four countries with significant North Sea oil and gas production - UK, Norway, Denmark and The Netherlands - but combining these data masks the fact that some production comes form outside of the North Sea. The UK has significant production on the Atlantic margin and in the Irish Sea, while Norway has significant production from the Haltenbanken area off mid-Norway. Strictly speaking these are separate petroleum basins.
Dutch production from the giant Groningen gas field is excluded from this analysis for two reasons, 1) it comprises an earlier discovery cycle to the rest of the North Sea and 2) production is capped by the Dutch government, hence it is not exempt from political influence.
Notwithstanding these known limitations, I wanted to see if production data could be fitted to two Hubbert curves in order to see what remaining reserves and future decline might look like. The chart up top is produced by trial and error on a spread sheet, where 4 variables may be changed: 1) start and end date, 2) peak date, 3) peak flow, and 4) gradient [notes 1, 2 & 3]. The chart up top shows what I consider to be a good fit, with the noted exception that 2007 and 2008 data are deviating from the expected decline. Knowing that two giant fields, belonging to a late discovery cycle for the province had just come on stream, it seemed pertinent to model these as a third cycle.
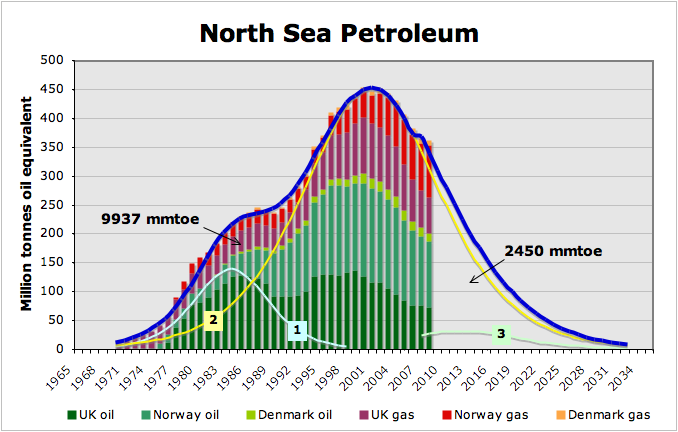
The dark blue curve equals the sum of the three Hubbert cycles. 1) is best viewed as surge production from the Forties, Brent, Piper and Ninian Fields when they came on stream in the early 1980s, 2) represents the main discovery and field development cycle of the North Sea, 3) represents a late discovery cycle, Ormen Lange in 1997 and Buzzard in 2001. Both fields came on stream in 2007.
Ormen Lange is reported to have reserves (gas and condensate) of 381 mmtoe and Buzzard 75 tonnes oil. Peak production at Ormen Lange is constrained by the capacity of the Langeled pipeline (25.5 bcm / annum, translating to 23 mmtoe / annum) and peak production at Buzzard is assumed to be 180,000 bpd, translating to 9 mmtoe / annum. Cycle 3 reflects all of these parameters but is modeled asymmetrical since production peaks will be reached early on in both fields. The chart above shows the impact of this cycle 3 model upon the eventual decline and reserves.
The remaining oil and gas reserves following this analysis are 2450 mmtoe. This is somewhat lower than official reserves for the three countries that amount to 4575 mmtoe, according to BP 2009. [note 4] Over 2 billion tonnes of oil difference is quite a substantial amount. One fly in the ointment is that the giant Troll gas field in Norway has production capped by the capacity of the platform and pipeline. This is in effect a political cap, and this gigantic resource will distort the decline phase of the Hubbert curve, extending it further to the right. I have not had time to look into adjusting the analysis for this.
One feature of the logistic curve is that decline accelerates with time. The blue line has a decline rate of 9% in 2010, accelerating to 15% in 2020 and 17% in 2030. In contrast, the decline on an exponential curve is constant. The decline rate in oil fields in known to increase with time from phase 1, to phase 2 and 3. But rates of 15 to 17% are well above the average current decline rate for the North Sea. So what is going on here?
I need to stress that I do not consider this analysis to be a forecast. It is an exercise to see how combining Hubbert logistic curve derivatives would fit the existing production data. One scenario that may bring about an acceleration in decline is field decommissioning. High oil prices in 2002 to 2008 have delayed decommissioning of many platforms; it remains to be seen if this is reversed in the lower oil price environment. One further consideration: the word on the street here in Aberdeen is that the major drilling contractors are very short of work. This will result in accelerated decline in the years ahead.
Notes
1. Long term readers of The Oil Drum will know that math is not my strong point. This appears not to be a genetic disorder since my younger son Duncan (age 16) excels at Maths. I gave him Laherrere's paper and asked if he could prepare the Hubbert equations and spread sheet for me to use.
2. There are a number of excellent mathematicians who contribute to The Oil Drum: Sam Foucher, Luis de Sousa, Jean Laherrere and Webhubbletelescope to name but a few. If there is a better way to do this then constructive criticism would be most welcome.
3. Sam Foucher modeled global oil production using a series of 7 loglets in September 2006, which is still the best multi-curve analysis of production data that I know of. I'd be interested to know how this model is standing up to the rigors of time.
4. To convert billion cubic meters gas to mmtoe, the conversion factors recommended by BP have been used - 1 BCM = 0.9 mmtoe.
Personnel
Editors
Contributors
Peak Oil Primers
Archives
- November 2010 (3)
- October 2010 (6)
- September 2010 (4)
- August 2010 (7)
- July 2010 (6)
- June 2010 (7)
- May 2010 (2)
- April 2010 (8)
- March 2010 (4)
- February 2010 (6)
- January 2010 (3)
- December 2009 (5)
- November 2009 (8)
- October 2009 (12)
- September 2009 (6)
- August 2009 (5)
- July 2009 (11)
- June 2009 (8)
- May 2009 (16)
- April 2009 (10)
- March 2009 (7)
- February 2009 (10)
- January 2009 (15)
- December 2008 (9)
- November 2008 (9)
- October 2008 (9)
- September 2008 (13)
- August 2008 (10)
- July 2008 (14)
- June 2008 (23)
- May 2008 (16)
- April 2008 (12)
- March 2008 (16)
- February 2008 (9)
- January 2008 (13)
- December 2007 (13)
- November 2007 (16)
- October 2007 (22)
- September 2007 (8)
- August 2007 (9)
- July 2007 (16)
- June 2007 (8)
- May 2007 (7)
- April 2007 (7)
- March 2007 (10)
- February 2007 (10)
- January 2007 (12)
- December 2006 (9)
- November 2006 (15)
- October 2006 (4)
- September 2006 (5)
- August 2006 (5)
- July 2006 (9)
- June 2006 (5)
- May 2006 (10)
- April 2006 (9)
- March 2006 (13)
Vital Trivia
License

This work is licensed under a Creative Commons Attribution-Share Alike 3.0 United States License.
Great Analysis... and since I'm the first poster I'd like to use the opportunity to ask that the Global production loglets post perhaps be updated? Please? :+)
http://www.theoildrum.com/story/2006/9/3/113719/7594
Sure would be interesting to see how it has held up.
Has anyone blurted anything out in the newspapers? We've all read this passage from Deffeyes's book:
A year later this came out in the Bend Oregon Bulletin:
Hmmm: British Oil Production - The New York Times, April 4, 1989:
Can't say you weren't warned - wasn't the UK peak around 2.5 mb/d?
If you look for reports from the late 1990s, it was confidently predicted (EIA et at) that the UK would plateau at around 3mb/day for the foreseeable future..
As far as this analysis goes.. I'm not 100% comfortable when you start adding lots of curves together, simply because the potential number of ways of adding 3 curves to get 1 graph is very large, and hence not very informative. For instance, the initial peak/dip for the UK was as much a result of Piper Alpha as discovery/production factors. Mathematically, I'd prefer to see a single curve with acknowledged error bars instead of attempting to get an unrealistic perfect fit. (Nitpicking, I know).
Back in the mid 1970s I remember Tony Benn the Energy Minister saying we would only have around 15 years of production. Later said how surprised he was by the huge amount that had and was being produced.
At one time he had a glass container that held the first oil to be extracted from the North Sea.
Deffeyes made a mistake in his book. The RRC went to a 100% allowable in 1972, when Texas production peaked. The Texas (RRC, C+C, Blue) & North Sea (EIA, C+C, Black) peaks lined up with each other:
Incidentally, according to Matt Simmons, the industry in 1999 was confidently predicting higher North Sea production. These two regions, which accounted for about 9% of total cumulative oil production worldwide through 2005, are the lands that the industry forgot, or more accurately, that they pretend don't exist--because their story is that regions (such as Texas & the North Sea) developed by private companies, using the best available technology, with virtually no restrictions on drilling tend not to see production peaks.
Mathematically, based on the logistic models, Saudi Arabia and the world in 2005 were at about the same stages of depletion at which Texas and the North Sea respectively peaked. Note that the initial Texas & North Sea decline rates were relatively low, for the first three years, with much higher decline rates in the following six years. The start of the analogous six year period for Saudi Arabia and the world is 2009.
As a well's production declines it must reach a stage where it doesn't make any sense to put the manpower onto it or the energy into it.
The effect of closing down wells before they are totally dry must lead to a premature and abrupt termination in production first at the well by well scale, then at the field scale. Thus potentially for any given field the declining curve will take a sudden downturn to zero as the operator reaches the point where his controlled shut-down costs are close to the cash in hand.
At what point do you think it becomes uneconomic for the operators to continue to work a particular well, and then a field?
I suspect that the effect on individual wells isn't that great - but there is a problem that the cost of maintaining operating infrastructure (platforms, pumping stations, etc) gradually becomes prohibitive, to that eventually even fairly productive wells, and small satellite fields, get closed or left undeveloped because the infrastructure is no longer economic. There is no offshore equivilent of a 'stripper well' afaik.
Right - in the offshore environment, keeping giant platforms operating, that are just producing a trickle of oil, eventually becomes uneconomic and they are eventually shut down. But this just removes a trickle from the production stack. However, the cost of decommissioning is so high that operators tend to do everything possible to delay this and will keep going with uneconomic production simply to delay the day they need to spend $10s millions to dismantle platforms and pipelines.
What kind of funding is in place to pay for the decommissioning? I could imagine an operator selling out to a thinly financed operator, that really doesn't have funds for decommissioning. Oil prices drop from current levels. The operator goes bankrupt, with few barrels extracted and little revenue per barrel. Who would pay for the decommissioning in this case?
Most of the Oil Majors have sold on their rights to the Remaning fields In the North Sea. Shell, BP, Occidental(Piper Alpha disaster)to smaller players. Far as I remember BP sold Forties for £1. New owners have to remove everything including rigs,under sea pipe lines, cap wells And dispose off every ashore. Anyone remember the BRENT SPAR Debacle.
http://en.wikipedia.org/wiki/Brent_Spar
Courts will probaly decide who picks up the final bill when t the Minors go bust.
There is a lot of selling and reselling of assets. Sometimes the responsibility for decommissioning stays with the original consortium of operators, some times it is sold on. Nearly all licenses are operated by consortia, so the cost does not fall on a single company. I think they will also have to allocate funds (in their accounts at least) over the life of the field to pay for decommissioning.
I've not heard of any company as yet unable to pay. The service companies that own big cranes are salivating at all the business that will go their way. CCS and decommissioning are the big growth areas in the UK energy economy.
Euan -- One clever bit the MMS has on its US OCS leases. Even if an Exxon sells an offshore property to Company A Exxon is perpetually responsible for decommissioning etc. So if Comapny A goes belly up the Feds still have someone to hammer. Do the UK regulators have a similar hook?
I think this is the case in the UK also. Decommissioning responsibility can be passed on to a third party as part of a deal, but if they go belly up, the responsibility reverts to the companies that built the installations in the first place - but I'm not 100% sure.
Gail -- On Federal leases all operators are required to carry bonds which cover abandonment costs and environmental liabilities to a degree. Additionally most operations are insured although that cost has skyrocketed since the recent hurricanes. With new insurance limits in place there's an unknown amount of uninsured liability out in the water now.
Insurance companies operate in the financial market place. As the financial crisis gets worse, more and more of them will go under, and it will be up to governments to bail them out. The timing on all of this, relative to the timing of the abandonments, is an unknown. The governments aren't getting in any better financial condition, either.
It's actually worse then that Gail. As a result of the huge claims after the last two blows the insurance companies not only raised the rates but also limited max damages. In some areas of the GOM once they hit a max exposure they'll write no more policies. I can't guess the scale but as a result the is a pretty big uninsured liability of the industry out there. Since it's a "what if" liablity I'm not sure the public companies are even required to carry it on their books.
nigwel -- As you might guess the answer varies widely. One of the biggest factors is onshore vs. offshore is the fied costs. The fixed operating cost for offshore is very high for any given field. That cost doesn't effect an individual well per se. But the cost to repair/recomplete an offshore can readily kill its economic value. The same operation on an onshore well that could cost $30,000 might run as high as $400,000 offshore. Also, relatively inexpensive techniques often used to supply artificial lift to an onshore oil well are not practical offshore sometimes for a problem as simple as lack of space.
Thus as you probably suspected offshore fields tend to be abandoned sooner then onshore fields. But there are situations when an operator will run a field in negative cash for months and sometime longer. They may be planning additional drilling but must wait for a rig to arrive. Perhaps they plan additional seismic acquisition. They might also not have plans for more activity themselves but are anticipating another new player might want to sublease/buy the position. A big benefit therein is not having to spend the many millions it costs to decommision an offshore field. Once an operator stops producing in Federal waters they have to return the lease to the gov't.
"The same operation on an onshore well that could cost $30,000 might run as high as $400,000 offshore. Also, relatively inexpensive techniques often used to supply artificial lift to an onshore oil well are not practical offshore sometimes for a problem as simple as lack of space."
Fortunately, the free market will work its magic and new technologies will develop which will push these offshore decommissioning costs way, way down. This will especially be the case if the minimum wage is eliminated and all unions are busted.
What would be the cost to abandon production on an offshore field but leave the infrastructure in place? Would it be effective to subsidize this over time as a public service?
I get your point toil but for the record in 34 years I've never run across a union worker offshore. As far as wages go I think the lowest paygrade (roustabout) I've seen was 2 or 3 times minimum wage. Not to belabor the point but the vast majority of US workers wouldn't handle the duties for that pay. On the high end, blue collar workers can do $70,000/yr and much higher. Unfortunately you have to have that job to get the check. These days it's not low pay hurting oil field hands but the lack of jobs. Thus, given your sympathy for US workers, I'm sure your hoping for the return of high oil prices so all those no longer getting a paycheck can return to their trade.
A note to Dr No - I've hidden / deleted your comment because it was so far off topic. I may do a post some time soon on 19th and 20th Century mortality.
By eye, we are looking at a fall to half the current level by 5 years time. At the current rate, that corresponds to a loss in tax of £3-4Bn.
So in addition to the cuts in services and rises in taxes we can expect to pay for the financial 'industries' incompetence, we can expect an extra £3-4bn for this decline.
Tell me again where the investment in alternative energy and energy saving technologies is going to come from?
If production follows the logistic down (and I'm not convinced that it will) then 50% of peak by 2015 certainly looks possible.
Service are going to take a hell of a hammering in the years ahead. Education is already sinking, health and social services will be next
Based on the EIA data, the observed North Sea crude (C+C) production decline rate from 1999 to 2008 is 4.8%/year (from about 6.0 mbpd to 3.9 mbpd). At this decline rate, the North Sea would be below 3.0 mbpd in 2015 (they would be at 2.8 mpbd, down about 53% from the 1999 peak).
That looks like there is only 20% left. Maybe we should start running faster in circles.
Some interresting articles have been published by Upssalla university in Sweden. Based on data provided by the Norway.
http://www.fysast.uu.se/ges/
Offtopic: At above site there is also a report about american coal. What puzzles me, is what happened around 1920. Coal production at plateau and declining energy content. ;-(
Limited time is all I have.....
ERR07 asked: "What puzzles me, is what happened around 1920."
That would have been the end of WW I. Use of coal during the war by the military was endemic. Naval vessels were all coal powered, as were our factories.
The next dip is accounted for by the rise of oil.
Mr. Mearns,
You commented that capacity was capped on the Troll Field by the platform and pipeline capacity and that this would change the Hubbert Curve.
I would contend that most if not all large fields are constrained by capacity. If there was no capacity constraint the decline curve would start from a maximum and continually decline. In the real world no one has the capital to drill all the wells in a field at once and build a pipeline and platform system sized to handle the maximum physical production from the field.
This combination of physical declines with the economic effects is in my opinion what make the Hubbert curve such a powerful tool.
Political or economic constraints can change the Hubbert Curve but it already contains normal economic constraints.
You have an interesting analysis-scary but interesting.
Fair comment, but Troll is in a league of its own, will produce on current plateau for decades, and because of its size, it can distort the whole picture. What I'm saying is that IMO it is more likely the decline is less severe than indicated.
I believe that Alaska (Prudhoe Bay) began pumping at a high rate because much infrastructure was put in place while the pipeline was being built.
That was the only way I could explain it.
http://mobjectivist.blogspot.com/2006/12/alaska-peak.html

One criticism I'd add, that applies quite widely to all the Hubert curve models, is that they all are shown ending symmetric with how they began. Natural resource exploitation would usually be quite different in the end than in the beginning.
For example, it is quite likely that the use of a resource will drop quickly when it becomes too expensive for large groups of users, resulting in one or more market collapses as the user system responds to the resource system, and it becomes of marginal utility for many prior users. They it would end in being available to the highest added value users, but for a long time probably. I think the strict "bell shaped" curve more likely applies to resources for which the exploitation effort is constant, rather than variable.
So, showing that is a problem when you don't know the future, and what the fallout will be for users as resources approach their points of vanishing returns for different groups. Wouldn't it be better to be as truthful as possible and show something that would prompt the better questions as those thresholds approach? Maybe this one would be:
It would let people ask more and better questions about the response dynamics, for example.
pfhenshaw -- A valid observation for sure. I recently re-read Hubert's work and he points out that he does not intentionally predicts a symmetric curve on the down trend side. I think he specifically states that the shape of this second half of the curve can only be constructed as the data comes in. It's also my observation that the smaller the population (anything less than all global production) will tend to show more irregularity. As was just pointed out Cantarell will be very asymmetric. But if one were to include all Mexican production it would still be so but not to the same degree. Backing off to all production in the western hemisphere dilutes the effect even more.
I'm not sure the US Hubert curve on the downside would be a good approximation for a global Hubert. Due to the huge class of private entrepreneurs in our oil patch we've bleed our old fields for a much longer extent than would be seen in most parts of the world. Again, PEMEX is a handy goat. Had the Mexican gov't allowed private MX companies into the oil biz they probably would be in much better shape today. But even the generic course of NOC's isn't easy to model. While PEMEX suffers from a lack of capital (thanks to the gov't stripping them of most of their cash flow) consider Petrobras. The BZ gov't is funneling hundreds of billions of $'s into their operations over the next 10 years. Just my guess but I suspect a BZ Hubert 30 or 40 years down the road will look quite different then a Mexican Hubert. And the KSA downside might not be as steep as other NOC's given their efforts at pressure maintenance and secondary recovery in their big fields. Then try adding the political and consumption variables to the global downside model and I'm not sure if you just don't end up with a "I don't know answer" to the shape of the Hubert backside . Which, of course, is much different than the "Yes I have a model that will predict the backside of the curve. As long as my assumptions hold true" answer.
I concur with your collapse path of oil production, but go one step farther. What leads you to believe there will be sustained low levels of production far into the future? We're talking North Sea and state of the art extraction, not Kansas.
This seems to be a persistent optimistic bias in a certain subset of doomers. I'm not saying you are wrong, just that you provide no logic to support that sustained plateau. Better would be if you merely erased that horizontal line.
This is not a quibble because others who haven't thought deeply might perceive that plateau as a period of relative stability and safety, and hence only prepare for collapse-lite.
Cold Camel
Responding to both you and Rockman, Yes it's clear that when you open up the discussion to what the real future path of production will be it's "defensible" throw up your hands with uncertainty and not discuss what contingencies might arise. It's also easy for some to focus on one favored scenario as "incontrovertably possible" and go off on some tangent that way too. I guess my suggestion is that if you try to draw all the scenarios you can it will raise more of the valid questions and make decision making more competent in the end.
In this case there seem to be two general reasons for non-symmetric depletion paths. One is the actual shape of the resource, and the reserves-to-EROI curve. While it's true we won't know that till we reach that, it's still a valid question. Once you have a curve then you can watch for the inflection points to give you the longest lead times in planning for it changing directions possible.
What we seem to have found so far is that the low cost and quick access reserves of oil are quite limited, and that the economy that relied on them being limitless is in for a rather big shock. I think that will be easier to understand if put in the context of realistic questions about what will follow.
What about the reserves of medium cost oil, or of high cost oil. How big are they? Are there discrete cost jumps for having access to each volume? For example, could we pump in viruses into depleted strata and in 100 years have a reliable trickle of low cost energy? What kind of economy do you get if it can't grow and has jettison it's expensive overhead costs to adapt to ever lower EROI resources?
That certainly does not help us much with our current straights of having planned all our finances and institutions on having ever multiplying access to cheap energy... Still, discussing the "far flung" possibilities for how we find and use oil in the future would at least help create subjects to discuss beyond the question of whether the supply of cheap oil is infinite or not. ;-)
You are suggesting that state controlled Statoil, controlled by one of the wealthiest countries in the world, is going to collapse, and that we will no longer be using gas for central heating or power generation in the course of a few years.
I'm not sure I follow you about "state control". What I think we're all talking about are the limits of control that natural systems present and over ride politics and technology, etc. What I'm suggesting is tat a likely path for economic decline due to resource depletion would be successive collapses of weaker sections of the economy to leave a residual sector that is so productive it can afford the expensive remains of the resource.
It seems to me that the high priced "dregs" of the earth's oil supply might last nearly forever, considering how small a group of users would be able to afford them. That's saying the sustainability threshold is in the user system, not the natural resource in this case... or so it looks to me.
Hypothesis: Worldwide continued debt issuance, especially in last decade, gave the economy and the markets inflated price signals with respect to continuable real economic activity. In effect, we borrowed from the future as much as we possibly could via fractional reserve banking system worldwide. If so, then many oil producing regions would have been incentivized to produce all out, using expensive technology, not caring about where oil might come from in 20 years other than new fields, discoveries elsewhere etc. As such, in certain(many?) regions, the ultimate distribution shape would not follow a logistic but some sort of skew. But by definition we can't know the end shape of an oil field/region until it's done (or nearly done) producing.
Question: What would be the geologic qualities of fields/regions that would be more prevalent to resulting in a negatively skewed distribution (i.e. where less than 50% of URR remains after passing peak in production, potentially much less - Cantarell is one example) or positive skew (>50% of recoverable is post peak but at accelerated decline from peak rate - Vigdis being one example). To what extent would different global oil regions be able to be pulled in the negative skew (early peak)? Are there some type of oil fields that have different geologic properties that would NOT be conducive to changed production profiles due to exaggerated price signals? In effect, this question might underly the increasing IEA decline rates over time on pages 220-222 in WEO 2008, even though they assume observed decline will be much less due to other factors.
The first point is that the Hubbert curve has progressively increasing decline rates built in - see text. If the distribution were to be skewed I'd go for +ve skew , that could be brought about by high oil price and indefinitely delayed decommissioning, also Troll and Ormen Lange are giants. They will have a looooong plateau before they begin to decline.
The negative skew would come about only with a collapse of society - Statoil, Shell, BP, Exxon ceasing to exist. Not likely IMO for the foreseeable future. This scenario would mean no gas or electricity - and the energy industries would be nationalised long before that would be allowed to happen. Statoil is already mostly state owned.
Sorry -I wasn't clear - what are the geologic differences (perhaps offshore vs onshore, giant field vs smaller, tight formations, etc.) that would account for price incrementally affecting positive skew. Im basically asking if ALL fields in production have the ability to depart from a normal extraction profile to accelerated extraction that would create a peak and then long decline at lower production levels, or if some % just aren't conducive to such technology, in general.
And - perhaps this was covered long ago (gawd knows alot of other stuff was), but what % of all oil fields ever discovered and produced/producing are totally or near totally finished? Less than 10%? 30%? I have no idea.
Gaaawd, those are hard questions. If you recall the CERA report, 40% of production comes from brand new fields in build up phase. Id guess that 90+% of all fields ever produced are done or near done. But that matters not since the ME OPEC supergiants are not.
There is no such thing as a normal extraction profile. But your +ve skew is probably near enough - a rapid rise to short plateau then a long slow decline phase.
I'll point out right here that your "fact" has no basis its a claim.
The fact is the one super giant field that we have good data on produced by a NOC Pemex crashed.
Others such as those in Russia did not crash but followed production pattern closer to Texas and even here data is not fully transparent.
It pays to be very careful with your facts esp for the super giants the truth in my opinion is much simpler we don't know the time evolution of these fields. Historically on land the largest fields spend most of their productive life watered out produced with stripper wells but we are just now reaching the point where horizontal well technology deployed in giant fields will begin to show its decline pattern.
Certainly aggressive measures such as initiating secondary recovery early in the life of the field with peripheral water injection followed by use of horizontals and targeted vertical wells taking advantage of the latests imaging technology will keep oil production high for a long time but if anything the decline should be steeper and potentially sudden in onset.
Show me a model that incorporate early secondary recovery and later horizontal well use and aggressive in field drilling for bypassed oil and results in a slow decline and I'll believe you.
As of right now my belief is that technology keeps production rates high until it does not.
No magic on the backside of the curve just simple aggressive extraction. Certainly bypassed oil is being produced that may have not been produced otherwise but why was the oil bypassed in the first place ?
To aggressive in production geological issues etc ...
The problem is if you start trying to assign "extra" oil to advanced technology its hard to beat your good old stripper well. Ignoring production rates outside of very tight formations I've not seen convincing evidence that more oil is produced vs running strippers for 50 years.
We have a best case scenario in the form of the US where many fields where abandoned after initial production and secondary and further recovery methods where only applied after technology had developed to extract them indeed the technology was developed to solve the problems in US fields. Its produced a symmetric production profile. But its critical to understand the timelines and history of how US fields have been produced to understand the interaction of technology with oil. Fairly long abandonment with the resulting gravity induced changes in a quiescent field are ignored for example. Even though resting of fields is known to improve production. Its technical its complex and if you look you should find that many factors worked to give the US the best production profile possible. Our early entry into oil production actually worked to ensure significant quantities of oil remained to be profitably extracted later as technology improved and as economics changed. Surprisingly for the US greed worked to our advantage as we damaged our fields and later managed to develop technologies to recover. And of course on the economic side regardless of technology US fields had to be profitably produced in competition with and influx of cheap imported oil. Even the North Sea was produced under this economic constraint for most of its productive life.
All of these factors are simply dropped in our models which is not correct at the very least a simple economic model needs to be included for regions that peaked early while oil was relatively cheap. Dropping it is really not and option.
However outside the US as the same technologies where deployed they where not used in fields that had been produced under primary extraction then often abandoned for long stretches of time instead as technology advanced it was introduced as needed to keep production up. Its simply not the same problem and not clear in the least if the production profile will follow the US indeed Mexico hints that this US may well not be the norm.
So overall global production should be asymetric with a steeper drop off or more probably a combination of the two curves that Nate has displayed. Its both.
You have a steep drop initially as production rates are no longer maintainable using advanced technology however your good old stripper well keeps chugging along so you also have a very long tail period. And of course assuming we continue to produce oil and its expensive marginal new oil fields will also fall in the tail region.
The biggest mistake I see in every single model of future oil production proposed on the oil drum lies in the period of peak production and initial decline. This area is very much a technical problem and related to how we produced the oil. Its simply wrong to backcast the long tail back through the peak with a single equation as peak and post peak oil production is controlled by two radically different forces.
The peak production rate and initial decline is almost purely technical with the time that we spend in this region determined by how long technology can keep production levels up before depletion forces them down.
Now whats the real model for oil production well we have it already and its been presented on the oil drum.
Its the shock model however its not in my opinion been formulated correctly.
In the real world what happens is initial production is under discovery control and generally exponentially increasing however from this point on the real world diverges from a single function and falls increasingly under the influence of an large number of functions which can be grouped together as shocks. The critical and vital point is that these cumulative shocks actually control oil production rates across the peak production profile and into the initial decline, Initial discovery dampens out and continued discovery is itself influenced by existing production and is no longer a pure search function. The time line for bringing fields online etc etc. Technical factor political you name it its a rich set of functions.
Its best to simply assume that all of these functions will eventually result in a simple economic equation i.e supply will meet demand at a given price as long as possible. Despite the complexity the overall driver eventually becomes a simple economic problem of course the demand side is not a simple function of supply as supply is itself not a simple function.
What we do have is a blatantly obvious signal in oil production when production levels switched over from being controlled by discovery and production to a rich set of economic political and technical functions.
Now when things get fiendishly complex you have a choice either give up or search for a simple function that can act as a model. Obviously we have a hint as to the form of the function since by definition actual production is being controlled by outside factors.
We happen to know exactly the perfect function to use to fit this sort of problem.
http://en.wikipedia.org/wiki/B%C3%A9zier_curve
Its the Bezier Curve and its perfect for our needs since small movements of the control points wiggle the curve but the time change of the control points is simple even though the curve itself is complex.
Thus instead of attempting to apply complex shocks to the direct production curve you have a very elegant out to move your functional form to a bezier and concentrate on the control points and even more beautiful is you can assign simple economic/technical etc etc real physical quantities to these points. They are not theoretical but map directly to the underlying economics. Thus these parametric equations are the true solution for resource extraction not constrained but fundamental constraints of scarcity.
Until they fail :)
Now given this its trivial to assign the most important controlling factors for as long as this equation holds.
Ours are as follows.
1.) Demand or economic side.
2.) Spare capacity i.e supply is ample given a price.
3.) Technical advancement ensuring spare capacity remains in the system.
Now I'll just jump to the conclusion its obvious that as long as the economy or demand side is revved that demand for oil across a wide range of price points remains ample. We know this happened because or economy is based on infinite growth certainly we had recessions so its not perfectly vertical but the demand side is a upward moving control point that wiggles and from historical data flattens its trajectory over time.
The technical control point is similar wiggling upwards and flattening. To use a example these are creaming curves if you will.
The spare capacity curve is the only one really tied tightly to geology and it moves as a guassian peaking then declining over time however its a very fat curve with wiggles itself at the top maybe a sort of rounded square wave with a wiggly top is a better description. Its actually the least defined curve we have as on the production side we only see what was produced not the height of the curve. The control point is a complex function of spare capacity not the absolute value as it need only be sufficient to ensure that any shortfall in demand can quickly be remedied by bringing existing capacity on line long enough for the other control points to not diverge from their trajectories. Of course sometimes this failed to happen and we have our oil shocks.
Whats important to recgonize however is the intrinsic nature of the curve demand was being goosed and by holding oil off the market prices where kept artificially high. The reality is all along this curve oil was more expensive than it needed to be and expanding debt ensured we paid the price. However this came at a real cost as it allowed us to aggressively extract oil in advance of the natural price curve if you will.
What it did was keep the differential between extraction costs and net profits artificially high allowing all but the worst sources of oil to be extracted at agressive rates and the largasse and excess profits allowed subsidizing the research and underwrite the production costs.
Of course these control points have their own shocks and it was not perfect but in my opinion the shocks don't matter the entire system effectively had the pedal to the metal for decades. The forcing function is huge and if you write it in this form you can see that even though prices where kept nominally low the actual amount of force in the system from moving the control points using financial games is immense.
Not only is it not small but in fact the entire economic system itself developed to control the control points. They are one and the same.
How does this end ?
Well its fairly obvious because the amount we have over pushed the system is pretty much identical with the overall debt in the economy. This debt is in reality oil we stole from our children and their children well out into the future that debt is really oil that was burned before it should have been if the curve was symmetric.
Thus the result is obvious oil production and the financial system will collapse simultaneously until the pressure on oil production is removed and it reverts back to a simple function controlled by geology.
And we know we slammed through the critical control point which was spare production capacity. Once we did that its over we are toast now its just a matter of watching the collapse unfold. We blew out the least well defined control point in a spectacular fashion so its actual value is now zero feel free to draw the evolution of a bezier curve when a positive control point falls rapidly to zero.
Of course now this curve is not pure but interacts directly with the real production levels so we are already on a fundamentally different curve which is the backside collapse but the bezier actually works well during the initial decline and I'd argue a new virtual control point is forming as the economy replaces spare capacity with a more planned economy. Shocking it obviously failed as real production is crashing.
However we are so far over the edge it does not really matter.
I just realized that it might not be clear whats happening now.
However it should be blatantly obvious that TPTB have desperately tried to reintroduced spare capacity as a control point using any means possible including crashing the world economy. And it should be just as obvious that OPEC spare capacity is a myth.
Its gone for good. The myth won't last much longer.
Jeezus Mike...
That is a key insight.
This is my fear/suspicion as well though I don't think its overall debt, just excess debt in relation to natural capital (which is 50-80% of overall debt). I'm trying to internalize how this happened mechanically. I think the concept is hidden in the same way that our economic system doesn't get proper signals of long term scarcity via futures prices, which are essentially arbs between current prices and storage/interest. Look at NG and CL prices last few years - which price represents future reality? The "it's copasetic until it's not" dynamic could be a doozy. Also somewhat explains stealth EROI decline, something I suspect we'll never have a chance to prove..
The longer we stay in this central bank induced levitation the quicker we run out of spare capacity as well.
Nice hypothesis but too long and unfortunately unprovable until very late in game. I got surges of both dopamine and stress hormones reading your comment. I hope some math folks here can assess possible use of Bezier curve which is over my head.
**Edit: I'd recommend parsing your comment into 2 paragraphs as best as possible -most folks won't be able to read through your comment
Details :)
No its a very broad brush and see my reply to Euan the cold war played a huge role in why the system was set up the way it was.
The only question is who really lost the cold war as near as I can tell it was our entire planet that eventually will become losers. The Chinese part of the game is fascinating I'm not sure that they will be willing to quit when we tell them its time for them to stop playing.
In fact the role Asia and Europe play as supporting partners in the cold war is itself fascinating.
Now that its over the former bit players are a bit of and issue.
Esp given we seem to have managed to run out of oil in the process :)
Its pretty awe inspiring that we reached the point that human warfare fought at a number of levels wrecked the global ecosystem and stripped the planet of resources. Never before in history has this been accomplished and hopefully it won't be repeated.
And what I find even more amazing is how so many people bought into the situation I guess after decade and decade of war you don't really know what normal is. Theoretically the "war" has been going on for almost 200 years at one level or another no wonder we can't really see what we have done. Its morphed over this time period but the intrinsic driving force of permanent war based economics has been the new normal for a very long time.
No wonder people have a hard time grasping what happens when its over and we can no longer rape the planet to support this economic model of continuous war and permanent war style economies.
We simply don't know anything else.
One more thing Nate. As technology advanced the intrinsic economy was very deflationary i.e prices should have fallen steadily for all goods and services and real wealth steadily increased. The need for debt financing should have fallen overtime as wealth accumulated. This is assuming steady exploitation of natural resources.
Even a move to renewables would have simply transitioned the economy to accumulate wealth in a more stable way.
This is the future that was seen in the 1920's and again in the 1950's. So the baseline economy actually drifts steadily downward overtime so the debt load was on top of this natural deflation.
Hopefully that gives you a idea of how much the real push was it had to overcome the natural decline in debt and then some.
I think one of main reasons that the downslope is likely to be steeper than the upslope, is the impact of debt.
As production was increasing, there was more and more debt in the world system. This had a three-fold impact:
1. It tended to hold up oil prices, so that there was a greater margin between sales price and costs, leaving more funds for reinvestment.
2. The higher prices tended to make fields that were marginally economic, economic thus opening new areas for production.
3. Debt could be used directly to fund investment.
In the years ahead, the world economy is likely to be in decline. Based on my analysis, default rates are likely to rise, and debt is likely to be harder to obtain. The resulting drop in debt can be expected to bring down production, in pretty much the opposite way that increasing debt increased production:
1 and 2. With less debt, demand will be lower, thereby lowering the price. Some fields may be rendered non-economic. Other may still be produced, but will generate a lower profit, to be plowed back into reinvestment.
3. With less debt, it will be difficult to borrow for new investment.
I agree completely but there is another side to this.
First consumer debt i.e easy debt for consumers helped keep the demand side high from personal debt to consumers in developed countries to the famous national debt often defaulted on in third world countries.
So the debt engine worked for both production and consumption.
Next the National Oil companies setting on infrastructure and relatively cheap to produce oil held back existing capacity to support prices and also and over the long run where slow to invest in replacing much less expanding capacity taking most of the profits of the NOC's. They also benefited from high priced oil while the bring online of marginal reserves generally off shore where profitable they also dampened the desire to invest back in the infrastructure in the NOC's. Thus the cheap oil or easy oil was metered out with significant substitution from more expensive sources. From time to time of course above ground events resulted in a flood of oil and collapse of prices but we can save these for a later time. Its obvious that if you simply ignore the mounting debt that everyone was a winner over the short term which lasted for decades.
Whats important about the periodic flooding of the market with oil and price collapses is it shows that this claim that oil was actually not cheap but significantly overpriced vs real supply is true. Sure it was often only 20-30 a barrel but if you where going at maximum capacity it would have really been 10 dollars a barrel thus for decades we paid and artificial 50% or more premium for oil. Now why was it considered cheap ???
Well inflationary forces aka our debt money machine was driving up debt and the illusion of wealth at a furious rate.
Overall if you look at capacity not production you see the real situation as one very long smeared out period starting at some point in the 1980's into the 2000's. Actual production levels had more to do with the interplay of global economics and politics than any intrinsic capability to produce oil as in general at least 2mbd or more of drilled ready to tap capacity was shut off at even given time.
This artificial situation is in my opinion one of key drivers of oil production for several decades.
The mistake that was made by most was assuming that because the NOC's where not maximizing production like the public companies was that at any point in time you could just jump in and dramatically boost production.
The truth is year end and year out the fields were steadily being depleted and although the investment rate was slower it was far from zero just because it was not done at a furious pace leveraging debt does not mean they stood still. They did what was needed to keep production relatively flat to slightly growing against the underlying depletion curve. They were not quite the turtles predicted. For example Pemex gets slammed all the time for lack of investment yet they put in a state of the art nitrogen injection system into Cantrell to keep production up. Its all relative and the freely flowing debt distorted the situation dramatically.
Ignoring for a moment the claims of large reserves I leave it to the reader to deduce how this race between the tortise and the hare ends when the debt driver fails to produce more oil. How much oil is left when the race is over and spare capacity is zero and dramatically rising production costs erode profit margins ?
I'll give you a hint 50% will be marked incorrect without looking at your reasoning as its certainly the wrong answer. And another hint more than 50% could theoretically be correct there is a reason for the industry claims. We only know beyond a shadow of a doubt that 50% is wrong.
I don't recall stating any facts, unlike you. Please provide the backup data to support such a sweeping claim as the one boxed above.
Personally I don't believe you have a clue about what you are talking about.
€
PS I've read on a bit further form the quote above and now know you haven't a clue what you are talking about.
LOL well probably the very first thing you need to do is forget completely about oil and think about why things are the way they are. Oil was and is a tool and the real driving force for a long time was the cold war.
With any war you have little choice but to ensure and overall planned economy to drive the war machine.
Given the stalemate caused by nuclear weapons the war moved to other less effective means of fighting.
This war set up the economic environment and structure that continued past the fall of the soviet union.
With any war a lot of dubious decisions where made along the way to win.
Whats interesting is how this military industrial complex smoothly morphed to fight a drug war and a war on terror and of course always the Iranians a secondary enemy through most of it.
Once you get that part i.e why the economic structure was created then you look at how oil fits into it.
And fit it does.
Look at it this way during most of the period the world had significant spare capacity for oil production. Obviously at any point if this capacity was brought online oil prices would crash. The amount of spare capacity actually needed to crash oil prices is almost trivial 500kbd of excess production would quickly overwhelm our oil support infrastructure until the economy grew to absorb it. 1mbd or more is devastating.
This is a critical knob to turn in a planned economy and the ability to turn this knob is what really supported the creation of the fiat currencies in the first place.
Eventually although it took a while this structure succeeded in its the entire reason for its creation which was the destruction of the Soviet Union. After this of course its had a hard time finding a valid enemy to carry on the fight and I suspect its ravaged our oil reserves in the process but its mission accomplished so who cares. We should have demobilized after 1990 but for whatever reason the system took on a life of its own and was at that point unstoppable. We chose freely to continue on war footing since we had profited handsomely in the process. All I'm saying is eventually we lost the ability to control the oil supply getting us where we are today. I can guess that the system continued because of the rogue states of Iran and North Korea and of course our self made rogue states such as Iraq. Regardless its history now.
Hold on a second Euan,
Please have a glass of your favorite Yeasty Beverage to jumpstart a synaptic wildfire, do the half-glass Peakoil Shoutout, then deeply ponder where Memmel is trying to take us in Advanced Modeling.
The 'peak & decline model' is very hard, no, it's Damn Hard to visualize and/or describe, but I think it has some merit and future utility. WHT, Memmel, my Rogue Wave Theory, plus other TODers have been thrashing this possible sharkfin model out for some time, but progress is very, very slow.
IMO, Memmel is trying to math describe/refine the many components of Sam Foucher's [Khebab] Large Seventh Loglet somehow, so that all of us can get an intuitive feel for the downslope path. It is going to take some real math & statistical wizardry to flog this dog.
You even mentioned this as a huge concern of Yours:
http://www.theoildrum.com/comments/2006/9/3/113719/7594/63
-----------------
Euan Mearns on September 9, 2006 - 10:39am
I too think Khebab's work is great - has he got this 100% right yet - I think he may be getting pretty close. I find it very useful to see different approaches and iterations of the data - but I lack intuitive feel for why the big loglet should be telling the truth - more on that later...
-----------------
Maybe your math-proficient son [kudos to him!] can help you understand what new modeling advances Memmel & WHT are striving for.
Bob Shaw in Phx,Az Are Humans Smarter than Yeast?
edit: Memmel & WHT, please correct me if wrong as I don't seek to put words in your mouths. I just think we are trying to figure out some method to incorporate below ground tech advances & above ground politics to figure out what % of the 7th-loglet is realistic and what % is juiced upward to raise production earlier; ie, left-shifted, then faster decline thereafter. I sure wish I had the math chops to pursue this further.
I would be curious to see Memmel's math myself. I know he has a theory but I have never seen the direct evidence. I would like the chance to help work out the details or review his model, but the charts he shows are usually from indirect sources that I don't think he authored. He might have it all worked out in his head, and if that is the case, all the power to him -- but conventional math does involve putting symbols or plotting charts on a piece of paper. Putting the ideas down on paper is the key, just like Euan's son has so professionally done.
To both as I was writing the post it hit me that control points for drawing complex curves and Web's shocks where the same thing mathematically. Both push and pull the underlying curve.
The problem or the difference is really a matter of which variables your watching. Getting the shocks right for oil is esp if you try to include technical advances etc etc is a nigh impossible task.
I haven't done any math because modeling the shocks with real values is for all pratical purposes impossible.
What is the magnitude of a "technology shock" ?????
I have rough guesses that are alarming but there just that rough ball park figures that seem about right.
However if you think about control points of a complex curve moving overtime following a very simple basic function. I.e creaming curves or more likely their own dispersive forces then you can model them.
The key is the time evolution of the control points can be fairly simple yet the curve itself looks complex and defies direct anaylsis.
Instead of shocks you have simple continous curves for the control points with some noise and coupling equations and of course the shocks are still there but they are shocks on the control points which then move on the basis of there coupling equations.
But all these control points really are are economic/technical variables with the addition of spare capacity which ties them to the physical world.
One is GDP/Debt per capita
One is Technology
One is spare capacity.
Two move in a simple arc and spare capacity is a sort of very fat guassian or rounded square wave.
The coupling is not super tight i.e there is "slack" and oil production moves up and down as these variable evolve.
Probably the most important thing to realize is oil was not actually cheap !
A significant amount of oil was held of the market for a long time for various reasons keeping the price of oil artifically high. Starting from when texas was a swing producer on till KSA took over the role the price of oil was kept artificially high for decades. The various above ground events like the embargo and Iran/Iraq war etc etc also boosted the price as shocks but even the base price was significantly elevated.
As far as I can tell only two times was oil released on the market at its natural flow rate up until recently the double shock coincided with the end of the soviet union right when they peaked.
That was and act of economic war not a coincidence.
Keeping the price artificially high allowed early exploitation of resources such as Alaska and the North Sea which would have simply not been economic at the time if oil had been allowed to flow freely.
There is a lot more but the role of the swing producer is critical in the paremetric model as physial oil really only enters directly there aka they have significant control over price which is the economic variable. Technology driven by artificially high prices puts a upper bound on the price but its a weaker connection.
Sure discovery etc play a role but in a system with a serious amount of spar capacity generally held offline they whole system is warped away from fundamentals.
My best guess is oil probably should have been around 5-10 dollars a barrel for several decades into the 1990's probably before it even started rising in price. More and more aggresive technical approaches would have been put in place as it rose past 20-30 a barrel. And of course this is hard to describe because overall the economy would have been growing but with monetary deflation not inflation.
A purely natural production curve and naturally advancing economy would have behaved very differently.
Right now my only real question is what the heck are the units on these control points. Economic potential barrels ?
Do you simply convert GDP to barrels of oil at the prevailing inflation price at the time ?
And its not just GDP but debt and the growth rate i.e I don't think the economic controller is the GDP itself perse but the rate of change.
What is the "GDP" equivalent to a barrel of oil. Obviously we take it out of the ground burn it up and make stuff but what is that measurement ? Is it really just the headling GDP I don't think so because that also bring in debt and inflation which is wrong since the growth in natural wealth is based on what we do with a barrel of oil to create products. Plastic in a computer or car is intrinsically more valuable because of the product its in than a cheap plastic garbage can or toy.
The point is the embodied energy of oil is related to the GDP outside of its physical energy content and or its use in materials. Or maybe not really.
These are questions for Mr Nate Hagens to answer if he is interested :)
Showing these are identical with the true direct shock model is the next step.
I have to show its just a simpler way to solve the shock model.
Its the same model but anyone that knows math knows coordinate conversions are immensely powerful
turning intractable problems into simple algebra. Effectively all this is is a slick change
of coordinates. The simple solvable trajectories of the control points gives a complex curve as their
relative relationships change over time. Yet the complex curve defies analysis.
There is a killer encryption algorithm sneaking into my brain as I write this :)
I bet I could use the same trick with some twists to make one hell of a encryption algo.
In fact as usual someone has probably beat me to it and this math is already embedded in someones
encryption algorithm.
Of course I had to look and as usual in Math I'm always the last one to the party :(
http://www.sciencedirect.com/science?_ob=ArticleURL&_udi=B7RKT-4PJDVHM-1...
It should come as no surprise that the "real" solution to the oil problem is closely related to known encryption methods sniff thats why I hate math some other bastard figures it out first :(
The moment you see some simple way to generate a really complicated looking curve your playing encryption games.
At the moment I'm going to bask in the insight of using a parametrized curve and following the control points vs trying to directly model the complex production curve :)
Thats enough for today even my head hurts after a while :)
In the past I've said the shark fin curves result from the system lying about its state now I can restate this in a clearer way.
Its not really lying what it has done is encrypted itself via moving the true state of the system off to some external control variables that are impossible to deduce via simple measurement of the physical state of the system. In effect systems that follow a collapse scenario undergo a natural or in this case man made encryption of their state. Certainly out right hiding the truth i.e the real state of OPEC and its reserves and spare capacity plays a role in this but as you can see to get real encryption a number of control variables are needed not just one. So instead of my very unscientific term of lying I can now say the system becomes self encrypted via the application of external control points.
This suggest that a investigation of converting the logistic to bezier form should be instructive.
http://mathworld.wolfram.com/LogisticEquation.html
Thats trivial but what would be the physical values assigned to the control points in this case ??
Same problem as above I see in a general way what they are but taking this simple function what are the units if you will you need to assign to the control points ?
Its not obvious to me yet what they are we don't have and esoteric economic model to identify the units.
Obviously they are a sort of money/wealth in a sense but what does that mean ?
And this is basically a static problem at first glance the control points are fixed to generate a logistic curve they are not even moving. You need a bit harder problem to really see their meaning.
In any case it seems they are effectively a measure of wealth/money or resources etc so the basic idea seems sound. So instructive but to trivial hmmm.
Egad, a reference to Wolfram. I was talking to a coworker today about Stephen Wolfram and he said the first chapter of Wolfram's famous book was all about himself. Apparently his ego is so big his head can't fit through a normal sized door.
His site does have a useful interactive symbolic integral solver though.
Affine transformations and parametric substitutions are my secret weapons. Everyone is totally hung up on the Logistic as a solution of a differential equation. Not the case, as the exponential search is actually a parametric substitution into a generalized growth function. The Verhulst equation drops out of this as a curious yet completely coincidental mathematical identity that has turned into the biggest canard and red herring since Hitchcock stopped making films.
Egads I got the same result :)
Yeah with the way I'm looking at it now its obviously wrong and not important. I just used it as a simple example and your exactly right its of no interest :)
Well my track record of rediscovering something someone else already knows remains intact :)
I seriously thought once of starting my own journal that only published independent discoveries of algorithms that had been known for hundreds of years for poor saps like me :)
However since your really already doing this it sounds like why convert to shocks what I'm saying is leave it in parametric form and associate the control points with physical parameters as apposed to conversion to shocks. Not that you can't do the conversion its just for me at least staying in parametric form seems a lot more powerful. I'm not surprised I'm just following in your footsteps on this but I hope this different viewpoint works.
Btw I already worked out the general solution for oil its three bezier curves.
The initial one is logistic like yes I know you hate it but the logistic along with a bazillion other growth curves fit it I'll just use logistic here since at least people have a understanding of it.
Its impossible to fit a single bezier past 1980 you can't do it and in fact you have to introduce a new bezier to describe the evolution of production this "proves" that two functions at a minimum are required to fit world oil production. Or in effect only the shock model is valid of the existing models since it is effectively identical to using multiple bezier's to fit.
Now this second curve I'm calling the economic growth curve and Nate can pull a ton of charts clearly showing how all the economic data has all kinds of inflections around 1980 its slam through every single piece of economic data we have.
Now of course this is a sort of gently rising curve the exact shape is not that important at the moment what matters is it heads off to infinity so any fit of the post 1980 data give a result that goes to infinity exactly like our economic model does. Like I said they are effectively one in the same.
Obviously this is not physical so you have to finally introduce one more bezier to get the decline side so no matter what eventually geologic peak will force oil production down.
Now of course this curve at first has no constraints except it goes to zero at infinity as apposed to infinitiy at infinity.
However you can quickly rule out results that say require more oil than the entire mass of the earth etc etc.
Next a lot of them that are even remotely close to physical require a total URR or area of 3T-4T barrels i.e almost all the smooth decliners generally need us to be below 50% URR right now to fit.
Next we assume your right and the finaly profile has a fat tail i.e a lot of future production is in a long fat tail we can think about that later but for tons and tons of reasons it makes a lot of sense for oil production to probably remain over say 15mbd for decades to come 30mbd for a while also makes a lot of sense.
So we eliminate any solutions without a fat tail.
Now however we have a bit of a dilema the problem is these fat tails move a lot of the total URR out into fairly low levels of production for decades assuming we are at least at 50% URR or the best case is symmetric then we have at most 1T barrels to partition in the tail. At least 500GB or more is in the tail region so to finish the decline curve you have to close the gap between current production levels and your fat tail.
Obviously you know what I use to close the gap a basically strait line :)
However I think this way of viewing it is very consistent with the shock model and also allows you the freedom to discuss constraints on the parametrized form without getting into the physical shock problem.
Your free to drop out the required shocks as needed to see if they are sensible. And it looks like I have a todo of converting between the two forms and I'm sure you already know how :)
But you can see how using this method we can fairly easily focus on the interesting part which is how to close the infinite economic curve and how many solutions make physical sense. Then your left eliminating
these down to a small set.
I think the price curve also comes into play to i.e you should be able to generate or incorporate price using this parametric form. But simply agreeing to two curves for the production up till lets say 2000 and ??? for a few decades followed by a fat tail is a good place to start. The economic data itself suggests another transition starting sometime after 2000 so from there until your in the fat tail region the right answer is probably wide open. The double peak of the stock market and massive expansion of debt alone singles the onset of the possible need to generate the post peak curve and fit as infinite economics was already failing at this point. It could be two but just nailing one would be a feat.
And last but not least by elimination of the need to generate the physical shock directly I feel I gain a lot of freedom in using ill defined shocks that I drop out as a solution instead of trying to do them from first principals like you do. Its just to hard for me :)
Please show or link to your results. I appreciate being able to use a second approach as a verification.
...
Same request, could you please show or graph some of your results?
...
When you say this, it sounds like you are actually doing more of a hand-waving exercise than anything else. If you don't start from some first-principles foundation I can imagine any arbitrary fundtion that will run through the points on a curve.
Thats the problem you can't construct very many shocks from first principals.
Construct a technology shock or deduce the effect of horizontal drilling or 4D seismic on oil production then your right if your model is unable to define these shocks then its not good enough. Sure you can add some shock and call it the technology shock but prove you formulated it correctly i.e your shock was derived from first principals. Horizontal drilling adds lets so 20% to reserves as it allows access to oil that could not be produced by other methods. How do you know ? Certainly initial production rates are higher for horizontal wells vs and individual vertical but what about one horizontal vs 10 verticals ? Any attempt to include how the oil industry has matured overtime as a fundamental shock is handwaving.
That does not invalidate the shock model its the correct fundamental model but without being able to easily include factors that may be important to the overall evolution of oil production its utility is limited.
Heuristics like HL are also obviously limited and arguably more error prone multi curve HL as presented in this paper probably compounds the errors intrinsic in HL in the first place. The obvious one for example of and end to discovery and the steady loss of production from shutin wells is not included in HL in effect its assuming a very steady discovery curve. I'm not going to go into all the problems with the method your well aware but my point is its limited.
Now to step away from "science" and move to engineering generally if your confronted with a problem thats not readily solved via first principals you develop a set of equations which although wrong i.e the fail at certain limits are correct within the bounds of the problem even if they need to bring in fictional forces which in truth don't exist. You find a way thats good enough. This engineering handwaving approach has turned out to be very useful.
Its great to have a good fundamental model aka the shock model I'm happy to have it. Without it I would be unwilling to even attempt handwaving but given the shock model and the fact its difficult to formulate the correct solution from first principals then its sensible to create a "handwaving" solution that is more flexible and can be recast into the shock model. This means guess first and then solve for the shocks.
How do you generate a set of equations that allows you to effectively solve for the shocks in the shock model ?
Intrinsically all I'm saying is that parametric curves can be used noting that the control points can be mapped to a sort of dimensionaless force or one of unknown dimension thus they can be mapped onto external parameters aka money or finance. This generates a curve thats simply scaled to overlap the resulting production curve. Nothing magic its "handwaving" as you say but its handwaving using a real system constraint thats practically impossible to model via first principals. Given the shock is in terms of physical oil its easy enough to see if its valid i.e possible given the underlying assumptions of dispersive discovery. If the synthetic shock is reasonable using the data and if the constraints are reasonable the its a good guess at a hard to define from first principals shock.
Better to do a bit of handwaving then to simply drop a term you can't define and can't even put a magnitude on. Trying to directly use the shock model to formulate shocks for complex economic conditions offers no easy way to even bound the shock even if you figure out a way to convert some economic number to oil.
Heck you can't even easily show the impact of Chinese coal consumption on overall increase in oil demand subsidized for coal or for the US via natural gas. I.e substitutions for oil over the last several decades have replaced many former uses for oil and still allowed demand for higher prices oil to be robust.
The substitution of coal and NG for oil in electrical and industrial usage is certainly not small yet completely missing from your shock model because its difficult to determine.
Before you completely give me hell for resorting to tricks to figure these out show me the shock model with substitution effects correctly integrated.
I looked on your site and unless it buried not once do you ever consider if something as simple as substitution has and effect on oil production and if so what that effect is. And here we have a trivial conversion using BTU's or boe to oil. The relationship is very simple.
I should have known you would post a post like this its typical and yet I still treat the shock model as the holy grail since its correct. But if nothing else before you attack me consider you have not even brought in some very basic issues. At the very least show me how you include substitution effects.
And yes its trivial to show they are important as simple example is take a resource that becomes scarce that has a perfect cheaper and more abundant substitute the future production of the first resource is directly impacted by the availability of the substitute ignoring it is not and option. Its a real shock and cannot be dropped simply because you chose not to model it.
Perturbing the discovery curve with minor short term economic shocks is simply not good enough there are other larger terms that are valid and need to be brought into the model.
In this case since you have chosen to take the high and mighty route at the minimum answer my concerns about substitution then we can discuss further if your unwilling fine but before we can even discuss what I'm trying to do lets focus on one issue thats amendable to both approaches.
You of course don't have to do anything but given your post lets start poking some holes in the shock model as formulated by all of your posts that I can find. Starting with substition show me how the term can be simply dropped given you never included it.
WHT, Memmel, Euan, Sam,
I sure hope some Hari Seldon types in the NSA/CIA, Sandia & Livermore, etc, can weigh in here to help kick this can down the road, or please go to WHT's blog to help clue him in on possible math paths. Yep, encryption, packet sending/receiving/analysis, and other esoteric skills could be off great value in this discussion to help weld some equations, error bars, and other values to the Loglets and Shock Modeling, plus maybe help kickoff modeling in a new direction.
From Sam's earlier keypost:
http://www.theoildrum.com/story/2006/9/3/113719/7594
----------------------
The Loglet Analysis
Posted by Sam Foucher on September 7, 2006 - 9:37am
..One Loglet [the Seventh] dominates the production and contains nearly 73% of the total URR and is due to peak in 2012 (see Fig. 3). The rest of the contributions come from 6 Loglets and has peaked in 1975. I wonder if this component represents the early "easy oil" from the super-giant fields.
...Compared to other curve fitting results (Fig. 4 below), the Loglets give a better result on the left side but is much more pessimistic on the production decline...
http://www.theoildrum.com/uploads/28/predictions.png
----------------------------
As Memmel mentioned upthread: essentially two halves to oil production so we might need two or more models combined to delineate the whole of Hubbert, especially for reasonable predictive probabilities for the downslope. So let's say the Six Loglets do a fairly good job of the tracking the easy-oil upslope; a smooth math Foundation of Predictive Growth & Directed Advance.
The Seventh Loglet, and the hidden components in its makeup is where things start to get very messy & confused. We might consider this the 7th Loglet as the primary 'Wave of Translation' whereby much happens at the Peak as time goes by:
http://www.ma.hw.ac.uk/~chris/scott_russell.html
In packet messaging and control techniques: repeated advances and packet forwarding start getting into algorithms for bandwidth optimization/packet reception/ lost packet minimization--IMO, no different than oilfield tech advances, then somewhat delayed incremental 'packets' of resulting production ramps over and above the underlying 'normal' production resulting in the left shift, plus offsets from production delays.
This can possibly be seen by examining the Fig 4 again: picture the topmost area between the Green Logistic and the Blue Loglets curve as a component of the tech-packet left-shift. Of course, the corresponding packet 'hole' is identified by the right side difference between the blue and green curves again; ie, this helps the sharkfin model come into fruition.
Nate's Biodynamic Discount Model; the "I want it All & I want it Now" theme is another packet component to induce left-shift again by debt-leveraging. Again, complex societal algorithms come into play for Hubbert Bandwidth determination, packet routing and contention schemes, control points, production optimization, and so on. But what I am trying to create for the reader is how the 7th Loglet has a decline-half component that shifts left in time to 'backload' it shape even higher.
The Shock model might be analogous to bandwidth perturbation and recovery; it seems to greatly help fine hone the analysis, but I am pretty weak here knowledge-wise, but it seems to have a math 'packet component' that applies to the makeup of the 7th Loglet, peak point, and curve inversion. The 'Late & Great' Samsam Baktairi's T1,T2,T3 phase transitions could be applicable to some degree here for other self-reinforcing wave, left-shift, and total historical bandwidth aspects of the Hubbert Curve, too. As I said: it is messy and confused, or maybe it is me that is messy & confused. :)
http://en.wikipedia.org/wiki/Topological_soliton
If one imagines a series of self-wave reinforcements, pulse compression, and wave shift transitions over time to the Hubeert Curve [Rogue Wave Theory, again]:
**************
Please see the animations in these links to get a visual:
**************
http://strangequarks.ca/node/1159
http://www.rp-photonics.com/higher_order_solitons.html
IMO, the first six loglets and early oil price history seem to map out 'primary' wave shifts that also help set up the power of the 7th Loglet:
http://www.priceofcrude.com/images/oilprice1869big.gif
Could one argue that this long period of median prices was the 'front-loaded' phase shift?
Again, it would seem that a Foundation of advanced math modeling would need some kind of 'new loglets' that could be useful for the decline phase of Predictive Collapse & Directed Decline.
If the Loglets method works well as a model for the 'advance of the upslope', can we create a better downslope model to probabilistically rule out the worst paths of steepest descent for Optimal Overshoot Decline?
http://en.wikipedia.org/wiki/Method_of_steepest_descent
Bob - the analysis I've presented is inspired by and is a variant of the loglets analysis, using here 3 curves to describe the somewhat simpler production history of the North Sea compared to the more complex production history of the world. Doing this creates a much steeper decline projection for the main production phase than would be the case if just one curve were fitted to all the data. If North Sea oil and gas production is all but over in a decade then this will not be good for Europe or the UK.
Before posting this I sent it off to Sam with my spread sheet and he conducted a loglets analysis with everything ranging from 2 to 7 curves fitted. Loglets is a purely statistical approach, and I actually prefer mine since it is rooted in what I know has been going on in the real world of North Sea oil production.
If one were to create a mathematical model for global energy linked to economy, debt, population, resource depletion etc, then it would have to incorporate adaptation. This of course has already been done to some extent using system dynamics and Limits to Growth scenarios.
Hello Euan,
Thxs for your reply, and Kudos for advancing the discussion. I am sure Sam will have a fascinating set of graphics to share with us using your data and suggestions.
I hope you and others can ponder my Rogue Wave Theory & 3 weblinked animations, especially the first of Topological Solitons [scroll to very bottom]: "A soliton and an antisoliton colliding with velocities ±sinh(0.05) and annihilating."
I think this maps out nicely to illustrate [efforts at future growth] =[soliton] Thermo/Gene Collision-ing head-on into [cascading blowbacks and limits]=[antisoliton].
If one visualizes a future series of static snapshots: notice how the ramp, plateau, then decline shrink from compression. IMO, this is could be roughly analogous to future oilfield discovery cycles and production rates as ever smaller fields get smaller. It could also be time period indicative of:
1. Shorter life expectancies
2. Aquifer depletion
3. declining crop cycles
4. how adding more MRCs & ESPs will have shorter lifespans
5. Your idea here
The hard part would be relating this with math and statistics to real-life data. But the summation, integration, or whatever term is best, could help better model the stacked composition and transition of the 7th Loglet, and could help us better understand/model how fast things will be statistically or really changing. It could further enhance system dynamics and newer Limits to Growth scenarios, and the final, but feeble oscillating series could help demarcate undershoot phases and later attempts at regrowth again.
As mentioned far upthread: progress on the topic is slow. Hopefully, what we TODers have sketched out can be advanced further by some math & science wizards moving this along. Time will tell.
In terms of signal processing theory, the Shock Model falls into the class of problems known as Infinite Impulse Response (IIR) filters. Its actually a series of IIR filters corresponding to the phases of oil production, nothing really sophisticated.
I have an undergraduate background in the EE side of things, but Sam Foucher is the bona-fide expert on all advanced signal processing topics so I defer to him on the loglet analysis (which derives from wavelet theory).
Look Euan I'm sorry all that spew is about why I think that multiple curves are required to fit.
At the end of the day all I'm saying is at least two and very probably three curves are required to mode oil production a single equation of any form is not sufficient.
Ignoring the reasons why the simple statement is a one curve fit is the wrong approach.
Nothing intrinsically wrong with that viewpoint and you need not agree with why.
I very excited because the economics of depletion are in my opinion not well understood.
I find the interplay of and economy based on infinite expansion interacting with a finite resource fascinating.
Maybe I did not make a strong case for two curves who knows. But before I could ever follow on with the sharkfin model you have to start with at least something justifying two curves in past production.
The real production data has a rather obvious change in slope in 1980 I don't think thats a point of debate.
I attach a lot of significance to this change and thats wide open to debate. But regardless saying two curves with the inflection or switch point at 1980 is not I hope something you find impossible.
Does it matter ?
Is this a reasonable, qualitative, condensation of your hypothesis? If it is, then I see little point in trying to model it, one day we'll wake up to a crisis and by the end of a month we may have blackouts and the army is drafted in to provide services to energy companies and utilities.
Its impossible to discount completely this happening. The real question is how likely is it to happen within 12 months, 36 months etc compared with other outcomes. The longer the current system survives then the longer it has to adapt via a series of changes.
I would also never model something that way (i.e. Scenario 1) and agree with Euan that it would be a pointless exercise.
We have to treat oil as a concrete constrained resource to the first-order. That is the only path forward if we actually want to manage depletion. After all, you don't manage your own wealth by assuming all sorts of calamitous things will occur. Instead, you manage by assuming a budget. An oil budget thus is nothing more than what we are trying to do in estimating reserves.
This seems to me so obvious.
Euan -- I'm a little perplexed by that statement also. No source for the numbers but I can add a lot of anecdotal evidence. I drilled my first hz well in the GOM in 1994. We were a little late getting to this technology. At that time it was a fairly well advanced technique overseas esp in the N. Sea. Most of my initial directional drillers were Scots in fact. It didn't take long for hz tech to be deployed in all major fields where it made sense. BTW: hz tech is not a universal savior. In the last 15 years I've spent twice as much effort talking operators out of going hz as I have talking them into it. It is not a "cure-all" approach by any means.
Back to the subject: most of the big/old heritage fields have been redeveloped horizontally. And that's not to say the KSA won't drill a few more at Ghawar et al. But the bulk of the hz redevelopment in the KSA (based upon chats with expats working over there) was done in the late 90's. New field discoveries will have their share of hz wells but I don't believe that was the point of the statement. IMO anyone waiting for a jump in oil deliverable from new hz in old giant fields is in for a huge disappointment. I LUV HZ WELLS! But like a few others here I have the tech background to appreciate their limitations. I'll make a bold and wholly unsupported statistical claim: IMHO horizontal tech will have a insignificant impact on PO.
I tend to agree with that.
From what I'm aware, horizontal well technology has been deployed in Haradh, Shaybah and Khurais in KSA. In the case of Haradh and Khurais, this is to maximise flow from poorer quality reservoir. I'm not aware of widespread deployment in fields in UAE and Kuwait.
There are multiple reasons for deploying horizontal well technology:
Improve flow rate from poor quality reservoir
To target thin reservoir zones
To target thin oil columns
Step outs from fixed off shore drilling platforms
Some of the best examples in the UK
Claire field, crap Devonian reservoir and 18 api oil, would not be commercial without hzt tecnology. Its now our biggest producer
Troll field, thin but massively extensive oil rim to gas. This was Norways biggest oil producer for a while until the gas / water hit the wells.
Wytch Farm (S coast of England) shallow offshore developed by drilling wells up to 10 km long from shore.
None of these fields would / could have been developed without hzt tecnology. This is getting reserves that could not have been got any other way. I've worked reservoir geology / geochemistry on 2 of these fields.
Hzt wells will continue to be deployed where the reservoir engineering / economics dictate. Some fields will water / gas out as others are brought on - but as we know the larder is rather bare and new capacity will likely struggle to fend off decline.
Euan -- And if I didn't state it clearly for the other folks I was specifially referring to future hz work in the grand old fields. In new fields high recovery rate techniques will only produce a bigger decline shock then many folks will anticipate IMO.
I've watched development at Witch Farm from afar with utter amazement. Here's a trick question: drilling a 10 km long near hz well is one thing but how to you push million of pounds of steel casing down that hole? You don't. I read how the put oil-filled rubber bladders inside the casing and essentially float the csg down the hole. Where there's a will (and oil) there's a way.
Maersk has another huge hz project in Quatar (Al Shahene (sp?) Field). I was up for the contract a couple of years ago but a conflict prevented me from taking it. They were to have 6 offshore drilling rigs with 2 geosteering geologists aboard each rig with plans to drill upwards of 600 hz wells with a typical length of 26,000'. Would have finished out my career rotating every 28 days out of the field. But, as it turns out, I'm in a much better spot now. And I don't have a 10,000 mile commute to work.
I'll grant that it may simply have been rumour, but there was quite a bit of talk floating around in 1991 that a large part of the reason Saddam invaded Kuwait in 1991 was to stop them from horizontal drilling across the border into Iraqi oil fields and stealing the oil. Think there was anything in that?
Nate -- A complex answer for sure. I'll toss in a few pieces but not the whole story for sure. I'm not sure the varying geologic controls are having as much direct impact as the operational aspects. The time element also complicates the answer to a degree. Were Ghawar being developed today with horizontal technology the backside would likely be much steeper and would have peeked much earlier. The big Deep Water discoveries, as many have pointed out, will have relatively short tails due to the high rate extraction methods used to optimize the rate of return combined with high fixed operating costs.
How many fields are finished? I can answer for the Gulf Coast (as well as the rest of the US probably): we're toast. I can look at maps of this region with ten's of thousand of wells that have produced many billions of bbls of oil. And they are all plugged and abandoned. In a few months I'll be drilling a deep well in S. La. targeting 100 bcf and 24 million bbls of condensate. That location is surround by many dozens of highly productive wells. Or were at one time. They are all plugged and abandoned today. When I close my eyes I see that seen from the old Tarzan movie with the legendary "elephant's graveyard". I've worked little globally but I'm sure it's a similar landscape. The giant fields like Ghawar and new trends like DW Brazil so skew our vision of the global oil patch in general that most would be shocked to realize that 90% of all oil/NG wells drilled have been plugged and abandoned. Of course, I just made up that 90% number. But who can prove me wrong? It might be 70%. Who knows? But I'm fairly confident that the vast majority of all wells ever drilled have been abandoned. And the great majority of the remaining wells produced relatively little oil on an individual basis. At last count I think the US was still the third largest oil producer in the world. But our average well produces less than 20 bopd. The oil patch, domestically and globally, is very old and worn out. New plays like the DW GOM and BZ are great but are relatively small flashes in the pan compared to out 100 year old history.
I am shocked - I guessed 10-30%. If your number is close that means there must be data for all those old fields - in theory one could test both the skew and the % of oil post peak, and the average decline rate post peak etc. I would guess that this data resides in thousands of pieces though...
Nate -- The US has a fairly extensive production base but gets a little thin for production over 30 or 40 years. Not sure about the UK and EU. But for most of the rest of the world there's very little data available. About the only source of any depth globally would be waht individual companies supply. And I believe that's been spotty at best. Perhaps 10-30%? Not even close in the US anyway. On a personal note I've worked on hundreds of wells in my career and I'll guess only a dozen of so are still producing. I'll dig around for some hard numbers as time allows.
DOE - Fossil Energy: DOE's Marginal/Stripper Well Revitalization Programs
2006 had 355,537 operating oil wells, the 124k figure would be 34.9% of that total. Did we P&A 20k wells in one year? Actually that DOE page gives a total figure much higher than what the EIA provides: United States Total Distribution of Wells by Production Rate Bracket.
Great find Dude...mucho thanks.
For those who didn't want to dig into Dude's chart here's some detailed that even surprised me:
% of US oil wells making less than 100 bopd = 97.8%
% of US gas wells making less than 150 mcfpd = 94.2%
I've made the point before that the US is the third largest producer of oil in the world thanks mostly to the small and very small independent producers. The Exxon's and Shell's can't function at these low production rates. The core of US production is not the majors. It folks like Bobbie D. and his wife who live outside of San Antonio and have been producing the same 20 or so little wells at 2 bopd each for over 28 years. This is the main reason why I feel the tail end of the Hubert curve in the US will not look to similar to those of almost any other region on the globe.
Total system collapse is just around the corner.
Euan - what do you mean "total system collapse" .. I find this a bizarre comment .. Not saying u are wrong but can u expand pls?
(iPhone)
That was a touch of sarcasm.
€
Ok I get it. So u are saying that the US chart shows a decline but that is ok because total systemic collapse is not going to happen?
Please forgive my style - I am using my iPhone on a ferry - but are you aware that the entire financial system of the west - and the complexity of our civilization is built upon expanding energy supply and it's fiat based monetary system? I don't know what you mean by total systemic collapse but I would be hard pressed to believe that we could revert to an energy consuption/ lifestyle akin to the 80's without experiencing total collapse... We live life now at the margins there is no buffer, a slight reduction in available energy ( and the right type ) and I could very easily see chaos..
Not sure your position on this issue.. Are you saying all is fine and dandy and nought to worry about? Or wot? After all u just bit the head of Memmel (?) above...
Hugh
http://europe.theoildrum.com/node/5261
http://europe.theoildrum.com/node/5495
Hope your ferry doesn't sink and that we don't get hit by an asteroid tonight - no doubt there are sites that will give you the probabilities of such catastrophic outcomes.
Sorry for this rather cheap reply but its midnight here - the shewolf tells me its time for bed.
€
Euan - I really don't get your position on this topic. I'm sorry but this has been the least transparent and slightly bizarre topics on TOD. Are you a proponent of PO/PG or not? I imagine that you have been vetted by the TOD staff in order to post and indeed it appears that you post under your own name but I must be perfectly honest you are giving mixed signals. Tell us something about yourself and your background, otherwise I can't place your thesis. The flippant way you dismiss the charts below (about UK gas production) doesn't show you in a good light IMHO!
I'm sorry but the credibility of TOD (again IMHO) rests in the fact that we punters know who the article writer is and what his position is. That is not to say that there shouldn't be different opinions.. Just to say you can't write an article and then resort to punterish posts! Leave that for us punters! We come here to learn from all the fine 'lecturers'....
So what is your position,? And what is your CV?...
Cheers, in good faith,
Hugh-never-been-near-an-oil-field-in-my-life (!)
Im gonna intercede here.
A)because Euan is sleeping now and more importantly
B)because if Euan reads your post I fear for his dogs.
If you click on his profile you would find:
euan, and many scientists here, are used to science based discussions, based on facts and figures. I suspect he was frustrated by lack of such in this thread and tried using humor, which you didn't recognize.
Many here have been round and round these trees for years and are just sussing stuff out at the margins that might seem esoteric to people not following along since 2005. Its a major problem that may result in shutting down the site.
Briefly, Euan is in the early peak camp, but not convinced that we are already past peak (e.g. economic recovery could produce slightly higher peak in next couple years). I disagree with him on many things, but agree with him on many more. In any case, this is a volunteer site and his contributions have earned him right to punt if he so chooses. But the post on North Sea decline was not a punt at all, and dead serious. World production is not collapsing but UK production is.
Searching the Google News Archives (favorite hobby of late) for the keywords 'Total system collapse' :) I get the following:
LA Crime Rate Could Collapse Justice System, Computer Says (1970)
Must Social Security Collapse? (1977)
Or this: US must utilize its own energy sources (1980) which contains the following:
I'm sure Euan would welcome a subforum here that is sans hysterias. Or an entirely new site; Rapier was talking about needing more room for comments on his blog the other day, having hit 200 posts in one thread; a venue that is free of imminent warnings of human dieoff next Thursday would be IMO a good thing, as many very knowledgeable people find this sort of thing nothing short of fanaticism.
I'd certainly second that.
You can find all the articles I've written (going back 3 years and 3 months) here:
http://www.theoildrum.com/user/Euan%20Mearns/stories
This slide is from a year ago:
The Global Energy Crisis and its Role in the Pending Collapse of the Global Economy in a talk delivered to the Royal Society of Chemists in Aberdeen,
Slide 25
http://europe.theoildrum.com/node/4712
Right now I'd say that option 2 is winning the day and option 1 is receding for the time being.
You are perhaps not aware, but the scenario I've published for the North Sea up top is at one end of the doom scale in terms of very high decline rates and low reserves. This alone should be enough to scare the pants off anybody, (like Jonathan's charts). We will hopefully have another article in a few weeks looking at the same problem but from a bottom up perspective (that is building a model based on data for every field).
Neither distribution adequately fits US oil & Gas production.
No it doesn't. But I would bet that many of the underlying fields look like + skew graph, given that 97% of wells produce under 100 bopd.
I wonder if there were no money at all, everyone stayed at home and the government delivered groceries, heat and water kind of like Netflix, and government planners were all robots and therefore treated 1 Joule in 2030 with the same value as 1 Joule in 2010. IOW they wouldn't care a whit about how much money they got from producing oil, but how much oil they got in return for previous oil, natural gas, water, food, production etc. and that the budget of how much "Foodflix" they could provide the population could not depend on imports but on US flows only. Would overall observed decline in US provinces increase or decrease over next 20 years in this situation?
Nate -- it easy for me to visualize (but not quantify) the misfit: it's the combination very old and very slowly declining onshore fields with the surge of production from the OCS (the GOM for the most part) since the late 70's. Those OCS fields brought huge volumes into play in a relatively short time. But for reasons others have already documented the logistics of operating in the water couldn't support the decades of low flow rates seen in onshore fields. Now add the impact of the Deep Water GOM. Several years ago I shocked to see how the balance of offshore production had shifted: 40% of all OCS oil now coming from the DW. But the half life of those new DW fields will be much shorter than their shelf brothers. High extraction rate technologies and the high fixed costs of DW operations will guarantee that fact. I'm sure some of clever modelers out there could construct a base that depicts such complexity in a recognizable form.
But that's just the "US Hubert". It's difficult to imagine any other region looking very similar to us. Maybe the UK but perhaps only slightly.
In any case, our simplistic export model and several actual case histories, show that increases in consumption*, along with single digit production decline rates, tend to produce an accelerating net export decline rate that looks a lot like a (edit, probably more like the negatively) Skewed Distribution. Sam's best case is that the (2005) top five net oil exporters shipped almost 20% of their post-2005 cumulative net oil exports in just the three year 2006-2008 time frame.
*Although the current record holder for fastest net export decline rate, the UK (-55.7%/year, from 1999 to 2005), had almost no increase in consumption over the decline phase.
Alberta conventional oil production matches the positively skewed distribution curve, as contrasted with Cantarell's negatively skewed distribution.
The difference is a matter of government policy. Cantarell's production curve is determined by the short-term need of Mexican politicians to get reelected. They instituted a massive nitrogen injection program to maximize production with the intent of generating money to spend on government programs. This produces a lot of oil at its peak, followed by a spectacular decline.
On the other hand, Alberta's production was managed to maximize long-term recovery of as much oil as possible out of the fields. One of the reasons is that Albertans all vote the same way and continue to vote the same way until the government does something stupid.
If a government doesn't screw up, it can stay in power for generations and heads of governments can run things for decades. The premier who was in charge when the first big discovery was found was head of government for 25 years, from 4 years before the big one blew in, to 21 years afterward. This sort of thing results in extremely long-term planning horizons.
However, Alberta's production curve is complicated by its vast reserves of non-conventional oil. There are really two different curves. You have to segregate conventional from non-conventional oil because, while its conventional oil is mostly gone, its oil sands may last for centuries.
Among exporting countries with a production peak in 2004 or earlier (may or may not be final production peaks), Mexico does have one of the higher total liquids decline rates, at 4.7%/year, from 2004 to 2008, but Denmark, Yemen and the UK have higher decline rates, and Norway has the same rate as Mexico.
And it is interesting that rising tar sands production in Canada failed to offset the decline in conventional production last year, resulting in more than a 2%/year decline in both production and net exports in 2008. Canada is one of the seven case histories that we looked at, with a production peak in 2005 or later (again, may or may not be final production peaks).
Thanks for reminding us that Cantarell is a one off, and because of this it is at one end of the scale when it comes to describing the decline in super-giant fields, and as such should not be used to shape our expectations of decline in areas like the Middle East.
How do we know that? It is the first of the super giants to hit steep decline. Are you very certain that Ghawar and Kirkuk and Burgan etc will not show similar declines? This all gets to precautionary principle. I don't KNOW the math on how one would model the introduction of debt-as-wealth into national system of exchange and oil production but I do know that 'with debt representing wealth' and 'without debt as representing wealth' will create fabulously different results. I am posting such interdisciplinary neophyte hypothesis here in hopes someone smarter than I can quantify it.
Because Cantarell was a nitrogen gas flood. The N2 provided both pressure support and was a form of miscible gas flood - mobilising oil that would otherwise have been left behind. It was always inevitable that when the N2 hit production perforations that production would collapse. What's more Cantarell is not a single accumulation but a series of pools - all developed at once. This is all quite unlike the ME supergiants that will follow a more gentle decline when the day comes.
Huh?
Isn't Ghawar like 30-50% water injected to push the oil column towards the center? How do we KNOW that won't result in collapsing production when water hits the column? Injecting 7 million barrels of seawater per day might not be N2 miscible gas flood, but it certainly accelerating production at cost of future decline. I don't think you nor anyone can state with confidence that Ghawar won't one day exhibit similar decline rates to Cantarell.
My point is that no one knows - by assuming the future will be like the past we are taking on far too much risk. But that's just one mans opinion.
Here's the reddit and SU links for this post (we appreciate your helping us spread our work around, both in this post and any of our other work--if you want to submit something yourself to another site, etc., that isn't already here--feel free, just leave it as a reply to this comment, please so folks can find it.):
http://www.reddit.com/r/reddit.com/comments/9r04w/north_sea_petroleum_re...
http://www.reddit.com/r/energy/comments/9r04q/north_sea_petroleum_reserves/
http://www.reddit.com/r/Economics/comments/9r04u/north_sea_petroleum_res...
http://www.stumbleupon.com/url/europe.theoildrum.com/node/5836
Find us on twitter:
http://twitter.com/theoildrum
http://friendfeed.com/theoildrum
Find us on facebook and linkedin as well:
http://www.facebook.com/group.php?gid=14778313964
http://www.linkedin.com/groups?gid=138274&trk=hb_side_g
Thanks again. Feel free to submit things yourself using the share this button on our articles as well to places like stumbleupon, metafilter, or other link farms yourself--we appreciate it!
First, your son did a great job. Kudos to him for his work.
If you look at some of the field by field declines in the past several years (I'm thinking specifically of the UK fields, I have the data for Norway and I've been too busy to play with it), they have been dramatically steep. This is not becoming an unfamiliar pattern for newer offshore wells drilled and constructed to reach quick peak flows and then to die a quick production death).
I recently looked at the individual field data for the UK, which something I had not done for a couple of years. I was absolutely stunned at some of the decline rates.
It seems strange to me that an intelligently managed private enterprise would produce any wholly controlled oil field in the shape of a bell curve, eg. production rises quite rapidly to a short sharp peak, then drops off again quite rapidly. Given that each unit of production-per-day requires a significant amount of capital investment (platforms, pipelines and pumping, tanker ships, etc.), and the infrastructure placed has a significant if not unlimited (with good maintenance) lifespan, it would seem more economically rational to rapidly ramp production up only to a level which can fairly certainly be maintained by the field for the economic life of the infrastructure. Availability of skilled manpower would also argue for same. That would imply a fairly long period at a flat-topped peak, at least for individual fields. Perhaps someone more experienced could explain to me the problem(s) either above or below ground, with that speculation?
lengould -- Your speculation is more valid with respect to deep water fields being developed today. Also holds true to a less degree for most older offshore fields. Onshore it's a very different picture. In this arena production rates tend to be limited by the wells' actual ability to flow and not on above ground contraints. Another historical fact is that a great many fields were not developed by a single operator. Depending on what state you're in if an offset operator can produce oil off of your lease with his wells then it belongs all to him. Competition has more then a few times driving field development/production rates at near insane levels.
Infrastructure life can be a factor offshore but not to the extent you probably feel. Steel is slat water begins to degarde on day one. Mainteneace will handle those problems as long as you can pay for it. Onshore it's a virtual non-issue. As far as your "intelligently managed private enterprise" comment over the last 34 years I've seen few truly stellar examples. Companies, especially publicly owned ones, are usually driven by the economics du jeur. I've seen more than one operator flow wells at such high rates that they hurt ultimate recovery. But their option was to max cash flow or die.
The logistic curve is a poor predictor of anything, IMO.
y(x) = C*e^(-x)/(C*e^(-x)+1)^2; (C just shifts the curve along the x axis).
You can make it look right by scaling tricks but it doesn't work.
The simple logistic equation is pretty inflexible.
For example, according to the curve between 50% peak production going up and 50% peak going down you produce 70% of the whole area under the curve.
The amount of 'x' between the inflection points(50% production) is only about 20% of the life of the logistic curve.
If the life of world oil is from 1920 to 2100 and 2010(?) is the peak then 70% of world oil production will take place between 1992 and 2028.
50% of world peak production was reached in ~1970, not 1992.
In 1956 the logistic curve was a brilliant means to look 40 years into the future, but now it's an impediment to understanding.
Great analysis and graphics. Thanks.
I understand the importance of excluding Holland's carefully managed natural gas production from the analysis. But comparing their production profile with the UK's natural gas production profile raises an interesting point. From the Energy Export Databrowser:
While Britain enjoyed the natural gas party, doubling their own consumption since 1980 and even briefly exporting, the Dutch with their polder model decision making have taken a more conservative approach.
The Groningen field is a truly giant field with reserves estimates of 100 TCF. Yet the Dutch have managed to restrict both production and consumption such that production and exports have remained fairly constant despite huge price variations over the last 30 years.
From a mathematical perspective, the British production curve is more interesting because it is "exempt from political influence" and thus subject to modeling. But from a social perspective I would argue that the Dutch model is much more likely to best serve the interests of the populace for the longest period of time.
And I wouldn't be surprised if this sort of resource nationalism -- restricting production in order to lengthen the period of production -- catches on if we end up with permanent contango in the futures markets. Even free markets can understand the wisdom of holding back production if it will sell for more tomorrow.
-- Jon
This UK chart frightens the hell out of me. Even more so than the oil one. The rate at which we are increasing our imports y/o/y is truly scary. And we haven't even begun to switch the coal and nuke power stations off. Let alone electrify the car fleet. Where is all this gas going to come from and how much will it cost us with our falling pound? What are we going to trade with them to balance the payments. Playing deficit with crap plastic toys from China is one thing. Basing our country's very civilization on a current account deficit is about as dumb an idea as has ever been had.
Agreed. But how do we use this information to affect policy changes.
To my mind, getting good information out to the public in a digestible form is job #1.
If you really wanted to be subversive you could use the "pdf" link underneath the databrowser plots and print off a few uncommented copies to leave in your local pub as conversation starters. Just like those advertising campaigns that engage the public interest before they even identify what it is that they're selling.
My experience is that people turn their brains off as soon as I try to engage them with words. That's why the databrowser contains essentially no commentary. Interesting graphics can sometimes get people to turn on their brains for a brief moment as they ask themselves first "What is this?" and then hopefully "What does it mean?".
We need to lead people to the realization that "the party is over" rather than force it down their throats. And I believe that is best done by providing easily accessible information so that the public can come to that realization themselves.
Happy Social Monkeywrenching!
-- Jon
HAcland I don't have a University education or the technical background of many of the posters here on the Oildrum. I am though quite capable of listening to arguments, considering analysis, checking claims and verifying data before making decisions and forming opinions. The charts and much more point to the fact that the UK is well and truly in serious trouble. But where are the political classes in all this? There is such a lack of political leadership that it is truly frightening. I see it, understand it, and at best prepare. Are the Oxbridge political elite so blind in the UK? or are they aware? Will they sacrifice the populace as lambs to the slaughter? Whatever the truth the future of this country becomes more frightening by the day.
Hacland,
I trust you saw my apology posted a couple of days after I made an xxx of myself a couple of days ago.
The charts scare me too-mostly because we on this side of the pond are in my estimation not over five years behind you guys,and maybe less.We probably won't run short of natural gas but the employment problems will still ruin us.
But my guess is that when tshtf and some considerable number of your fellow citizens are sleeping in school buildings because there is no heat fothier houses and a greater number are rioting the environmental regulations will be tossed out like last weeks newspapers.
Whether your country survives the coming crisis without a revolution of some sort is questionable in my opinion.
In your boots I believe I would consider moving to Canada if I could.
Hello Farmer Mac - yes I did see your apology! Thanks but not sure it was necessary!
I have to say, the most bizarre thing at the moment here in the Uk is the complacency and lack of debate. Every now and again a broadsheet newspaper will run an article about 'the lights going out' but it never seems to take traction and foster debate.
I am not an oil/gas industry insider. I have no idea if the charts are valid save for doing my research and being as disinterested as one can be. As a software developer I have a keen logical mind and using my undergrad physics I can work out that if the charts and available FF going forward are correct then we in the UK are in serious trouble. I have a good understanding of real economics and our monetary system too and all the links are in place for trouble. The only part of the chain I need help on is the actual production/decline of FF and from what I can determine from the many hours of research I have invested the facts are not good.
So, there we are. Is it possible that I might be the biggest most gullible mug in all history? Maybe. Sometimes I catch myself thinking that it can't possibly be that we will face an energy crunch in the near future.. And then I go back to the facts, re- analyse them and check their origin and credentials, ask the all important question 'who gains' and still I come back to the same conclusion.. The UK is in deep trouble. Perhaps the lights won't go out like in the 70's but sure as eggs is eggs there ain't going to be enough energy to fuel an economy growing at 3.5% pa for the next 20 years (one doubling) which is what the UK Treasury has said we will do and that at such a rate the yearly deficit will be brought back to a 'manageable' 40% of GDP. It is all frankly nonsense.
As you can probably tell, I am more than a little bit tired of all the dumb-assed nonsense in the way we are governed. Where is the vision? Where is the leadership?
I think reviewing how people dealt with the energy crisis in the 70's is a good place to start if you want to imagine what might happen. Society didn't collapse but things weren't very pretty then either.
As for vision? Expect it to come from the ground up. "Be the change you want to see."
I'm still of the opinion that many individuals can reduce their consumption of fossil fuels by half and still lead a relatively modern, Western existence -- insulate and weatherize your house; turn down the thermostat; wear a sweater; take short showers; unplug most of your gadgets (Heck, just give them away!); don't leave the lights on; walk, bike or car-pool; take in a boarder if you must. You'll be doing this stuff anyway once energy prices start to rise. I don't think any of these constitute a collapse of society no matter how unpleasant they may seem.
The part of the picture that I can't figure out is what kind of economy we will have and how long it will take to transition some of the retail/consumption jobs to energy-conservation jobs.
We may also have a large and unhappy 'mob' that feels they've been lied to and wants to know what went wrong. Their anger will be justified. And the stories spun to answer their questions will no doubt be very interesting.
-- Jon
Some more posts for you to read:
A State of Emergency
http://europe.theoildrum.com/node/4188
Daddy, will the lights be on at Christmas?
http://europe.theoildrum.com/node/3401
UK Energy Security
http://europe.theoildrum.com/node/3130
Euan - thanks for putting me right. Sorry if I came over a tad grumpy last night but the ferry had run out of beer ;)
I am getting really concerned about how the next decades will pan out. I have been running my own business now for several years and absolutely know how much emotional effort is involved to turn a decent living/profit. I guess I am getting stressed because I don't know what the future holds, but it sure doesn't look great here in Britain. I am just about young enough to start over again in a foreign clime such as Aus or NZ. I'm just trying to get the facts, the whole facts and nothing but the facts.
I just can't see how the country's economy can 'grow' (aka BAU) - make more stuff, consume more stuff and provide more services - with out continued increase in the demand for energy. This must be a given! Then as you point out the NS is declining and the Treasury will be getting less and less from oil/gas at a time when the country is all but insolvent anyway we then go and start importing a big wedge of our energy from overseas competing in a market which is only going to get busier with other countries which are richer than us. And all the while the monetary system requires growth to keep it going, otherwise chaos.
Any how, thanks for all your posts and shared expertise.
Australia has some serious climate, soil and water issues that don't bode particularly well long term, though its natural resources and access to Asian markets may balance that in short term. You might consider substituting Canada for the island continent in your search, especially if you believe it is going to warm up around here.
No problem Hugh. From my perspective the UK is in a dreadful mess - totally trashed by New Labour. I'm glad I'm not running a small business today. The only thing certain about the future is uncertainty. I believe we are in a terminal bear market (the FOOTSIE and S&P500 both shaping up for that), but that doesn't have to mean everything crashes down tomorrow. IMO there will be ups and downs in the economy, with the general direction down. Some sectors may flourish whilst others all but disappear.
My younger son (Duncan) is now final year at school, and when he is finished we seriously consider upping sticks and leaving - both Norway and France have great appeal.
Try New Zealand. The South Island is basically unpopulated (but prone to bouts of Antartic weather). NZ is getting all our topsoil at the moment, anyway... :|
I like your charts too -they're very effective, especially showing how UK gas consumption climbed with production, and now we're.......
******
€
Russia always dreamed of having a giant naval & airpower base in the Atlantic for easy free-range movement. Beats the chokepoint of the Bosporus Straits by a long shot. Is the UK ready to trade lots of land for FFs? Don't all bears speak Russian?
Makes me wonder if the KSA royals will exchange their country and FFs for a postPeak Hawaiian paradise?
Yep, a sad sarcastic remark.
Well there wasn't any sarcasm intended here at all. Jonathan's charts are very effective, especially in showing how UK consumption tracked production up. The UK economy is well and truly f*d. But IMO there is a world of a difference between acknowledging this simple fact and doomcasting the imminent collapse of industrial society.
My apologies for the confusion. I was self-referring to my reply. Perhaps "Yep, my words above convey a sad sarcastic remark" would be more accurate. My heart goes out to all for what lies ahead postPeak.
I believe that there are five countries with North Sea oil & gas production: Norway, Denmark, UK, Netherlands & Germany.
Norway and Denmark are still net oil exporters (from all sources), with respective 2008 net oil exports of 2.35 mbpd and 0.11 mbpd (EIA), for a combined total of 2.46 mbpd.
The other three are net oil importers, as follows UK (-0.13 mbpd), Netherlands (-0.89) and Germany (-2.42), for a total of -3.44 mbpd, as of 2008.
So, we have combined net oil imports of -3.44 mbpd versus net oil exports of +2.46 mbpd, for a Net/Net of about one mbpd of net oil imports.
The observed net export rates of change for the two net oil exporters, Norway and Denmark, are as follows:
Norway (2001-2008): -5.1%/year
Denmark (2004-2008): -16.4%/year
BTW, in 1999 the Net/Net calculation for the five countries showed net oil exports of +1.5 mbpd. So, in only 9 years, the region went from combined net oil exports of 1.5 mbpd to combined net oil imports of 1.0 mbpd, a swing of about 2.5 mbpd.
Incidentally, the three closest major sources of oil exports to the US are Canada, Mexico & Venezuela. Their combined net oil exports fell from 5.0 mbpd in 2004 to 4.0 mbpd in 2008, and all three showed production and net export declines last year.
I have compared Peak Oil to a commercial airliner doing a gradual descent for landing, while Peak Exports is more akin to a terrifying near vertical dive into the ground. So, IMO, from the point of view of importing countries like the US & UK, focusing on the total production curves versus net exports is analogous to having a pleasant chat with a seat mate about your dinner plans--as your aircraft is doing a near vertical dive into the ground. I think that the Net Export numbers are so scary that a lot of people, even Peak Oilers (including myself) are in some degree of denial.
Unless I am missing the mark, I thought the P/R ratio (i.e. the decline rate) for the Logistic is a constant on the down side of the curve, just like an exponential.
It asymptotically approaches a constant k as k*exp(k*t)/(1+exp(k*t)), when exp(k*t) is much greater than one. So maybe what you are seeing is the decline that sets in before it reaches its asymptotic decline? Is it more accurately a decelerating increase?
I simply calculated the decline on the downside [d = (p1-p2)/p1, where P1 = production year 1 and p2 = production year 2] and was surprised to see it accelerating to values that are currently much higher than present. I'm far from convinced this is a valid model, but it can be rationalised in the real world since decline rates do accelerate in fields and we can look forward to an acceleration of decommissioning, and we are experiencing deferral of investment.
Yes, that is an alternative way of looking at it but you get the same result -- the Logistic turns into an exponential as you go down the tail. What you are seeing is a transition from the shoulder of the peak into the tail. This makes the curve steeper with time, yet it is not accelerating in its increase, at best it is increasing as a decelerating pace as it merges into the exponential asymptote.
I am not arguing the effect just the technical definition of an accelerated increase and the definition of an exponential.
The logistic curve has a linearly declining 'growth' factor r from the beginning, NOT the depletion factor. This causes confusion.
The depletion rate past peak is steadily increased to a certain limited amount, a bit more than 50% of a curve 'growth rate' less than 10%.
So if the growth rate r is 6%(US lower 48) then the depletion rate from a peak of 0% depletion at peak would grow to a little more than 3% maximum depletion rate.
The linearly declining growth factor only exists if you look at it from the perspective as a solution to the Verhulst equation. If you want to model rabbits and foxes, that is fine. However, the Logistic sigmoid itself can be generated by another process. In that case, there is no linearly declining growth factor. If you don't believe me, look at the Fermi-Dirac distribution function and then try to convince a physicist that the F-D has a "linearly declining growth factor". The Verhulst equation is a McGuffin and that is what is causing the endless confusion.
In general the cumulative is defined as R=1/(1+1/f(t)), where f(t) happens to be an exponential for the Logistic. If f(t) is anything else, even an exponential plus a constant, then the Verhulst equation fails. The thing is a brittle little sucker that just won't go away.
So I suggest never look at the dR/dt=r*R*(1-R) Verhulst equation because it is nothing more than a mathematical identity, and that r factor is very misleading.