DrumBeat: June 20, 2009
Posted by Leanan on June 20, 2009 - 10:14am
Study Shows Expense of Finding Oil, Nat. Gas Soared in 2008
The U.S. oil and gas industry's costs of finding resources rose 35 percent last year amid the wild rise and fall in commodity prices, an Ernst & Young study released Thursday showed.The three-year average cost per barrel of oil equivalent, excluding acquisitions of proved reserves, was $27.22. But in 2008 that spiked to $51.96.
"This validates that finding oil and gas reserves is very, very expensive," said Marcela Donadio, oil and gas sector leader for the Americas. She noted that cost also demonstrates why some companies have delayed final investment decisions on costly expansions or new projects, such as those in Canada's oil sands or deep-water exploration.
The ruins of Detroit are no less spectacular, no less heartbreaking, than those of fallen ancient capitals. A beaux-arts railway station, its 18 stories vacant for the last two decades, crumbles under the tread of scavengers and vandals, its tracks pulled up, its windows punched out. A once-grand movie palace, on the site where Henry Ford built his first automobile, lives on as a derelict parking structure. Marvels of industrial architecture bleach in the sun, disappearing under urban prairies, green and garbage-strewn meadows that line the city's major avenues.
Despite Relatively Low Demand, Oil Prices Spike
The more people use oil, the more the price goes up. When supplies are limited, the price goes up even more. In the oil market, however, the law of supply and demand is just one of the factors affecting the price. For one thing, it is not just the users of oil who buy it; it's also people who play the market."This has much more to do with oil seen almost as an alternative investment," says Daniel Yergin, chairman of IHS Cambridge Energy Research Associates.
Iran protesters defy warning, clash with police
TEHRAN, Iran (AP) — Witnesses said police beat protesters and fired tear gas and water cannons at thousands who rallied in Tehran Saturday in open defiance of Iran's clerical government, sharply escalating the most serious internal conflict since the 1979 Islamic Revolution.Eyewitnesses described fierce clashes after some 3,000 protesters, many wearing black, chanted "Death to the dictator!" and "Death to dictatorship!" near Revolution Square in downtown Tehran. Police fired tear gas, water cannons and guns but it was not clear if they were firing live ammunition.
'Piracy' as Yemen fuel crisis surfaces
SANA'A (Saba) – Surging piracy off Somalia has paralyzed the movement of fuel tankers in Yemen, causing a grave fuel shortage across the republic.Long queues of cars have been seen even in the capital amid insufficient diesel quantities at filling stations.
Russia, Netherlands Discuss ‘Serious’ Energy Plans
(Bloomberg) -- Russia and the Netherlands have “serious plans” to extend energy projects and “enhance” European fuel security as Royal Dutch Shell Plc seeks a role in the gas-rich Yamal region, President Dmitry Medvedev said.
How IT can better manage energy in a time of dwindling resources
The drivers of the next generation of information technology services are the teeming millions who will avail IT services to address their fundamental needs and improve their quality of life. We have the opportunity to transform the world by deconstructing conventional value chains and replacing them with sustainable IT services that have a lower environmental footprint than the conventional infrastructure. This transformation can be delivered by an IT ecosystem made up of billions of service-oriented client devices and thousands of data centers.
Feds probe bird kill at Alberta base
CALGARY -- Environment Canada has confirmed it is investigating an oil spill that killed 200 sparrows and ducks at Canadian Forces Base Suffield last September.
Switch from oil to biomass won't happen overnight, says expert
I think that biomass shouldn't only be seen as the raw material for energy supply, but more broadly as a renewable material. It can, for example, replace metals or other raw materials - not just oil or gas. The potential is fairly large, but is also limited. No one should think that we can just switch from an oil-based to a biomass-based economy right now.The potential is particularly limited when we're dealing with fuel - also because there's one thing that cannot be questioned: that feeding the world has to have a higher priority than producing or using biomass for energy purposes.
Wind Could Power Europe Many Times Over
A new report from the European Environment Agency has concluded that wind power's potential in 2020 is as much as three times greater than Europe's expected electricity demand, rising to a factor of up to seven times demand by 2030.
Learning to Live With Climate Change Will Not Be Enough
A leading environmentalist explains why drastically reducing carbon dioxide emissions now will be easier, cheaper, and more ethical than dealing with runaway climate destabilization later.
Peak flow rates, not peak oil?
Neil McMahon at Bernstein Research says it’s not peak oil, but peak well flow that is the problem. He does however touch on similar themes advanced by peak oilists; namely that remaining oil reserves are becoming more difficult, and expensive, to recover. He recounts the phenomenal flow rates of some of the most famous ‘gushers’ of bygone days, notably the Lucas I well at Spindletop, Texas.Finds such as this were ‘drilled to death’ and flow rates fell, especially as pressure subsided. High flow rates had something of a renaissance thanks to the North Sea and other offshore discoveries of the 1980s and 1990s, and McMahon writes that these flow rates were critical for the expensive and difficult engineering required to develop the fields.
Today, however, he writes that the industry is not coming to terms with the lower flow rates that newer discoveries will provide.
Jeroen van der Veer: The race is on to create a new world of energy
We stand at the early dawn of a new energy future. It will be powered by alternative energy and cleaner fossil fuels. If governments adopt the right rules and incentives, by the middle of this century renewable sources will provide nearly 30 per cent of the world’s energy. Society will be on the road toward sustainable mobility. The world’s highways will rumble and whir with vehicles powered by all manner of energy: petrol, diesel (yes, still there), electricity, biofuels, natural gas and hydrogen.In the years ahead, conventional diesel and petrol cars will go increasingly far on every litre of fuel. Biofuels will account for up to 10 per cent of liquid transport fuel in the next few decades. Our Shell scenario-makers think that by 2020 up to 15 per cent of new cars worldwide could be hybrid electrics, such as Toyota’s Prius, some of them capable of plugging in to recharge their batteries. After 2030, fuel cell vehicles powered by hydrogen will be a small but growing part of the fleet. By 2050, more than a billion extra vehicles are expected on the world’s roads, more than double today’s total.
The study’s executive summary ends with these two sentences:“We conclude from these reviews that the most alarmist of the peak-oil claims are likely false. Still, we see some convincing reasons to think that global oil production could peak within 20 years, with demand outstripping production indefinitely.”
I wish that Fisher had related the 20-year time frame to the warning of the Hirsch Report (2005) that an intensive mitigation program will need to be in place at least 20 years before peaking if we are to avoid serious economic and social consequences.
Mexico oil production down 7.9%
Mexican oil production fell 7.9% during the first five months of this year to an average of 2.65 million barrels per day.The low production during the first five months will make it more difficult for Pemex to meet this year’s goal of 2.7 million bpd on average.
Pemex saw exports fall 15% on average to 1.24 million bpd from 1.46 million bpd during the first five months of last year.
Russian oil export down 1.3% to 80.5 mln tons in Jan-Apr
MOSCOW (RIA Novosti) - Russia exported 80.5 million metric tons of oil in January-April, down 1.3% against the first four months of 2008, the country's statistics service said on Friday.Oil exports accounted for 31.2% of Russia's aggregate exports, and for 48.5% of the country's energy exports in the reporting period, a slight decline from January-April 2008 (35.5% and 51.2%, respectively).
Risk rises on Iraq oil deals after industry revolt
BAGHDAD/DUBAI (Reuters) - A revolt in Iraq's state-run oil sector and rising domestic pressure on its oil minister have added more risk to deals for the super giant fields that big oil firms plan to vie for later this month.Winning bidders may find they are hamstrung by partnerships with unwilling and uncooperative Iraqi counterparts in both the Kurdish north and Arab south following criticism of the deals.
Barnett Shale is top U.S. natural gas producer, Chesapeake CEO says
Chesapeake Energy Chairman and CEO Aubrey McClendon said Friday that the Barnett Shale has surpassed the venerable San Juan Basin as the biggest natural gas producer in the United States.He also said the Barnett, which has speckled North Texas with roughly 10,000 natural gas wells, "will be producing at least 50 years" and "probably" for a century.
EU leaders warned about emerging 'major' gas crisis
European Commission President José Manuel Barroso warned EU leaders at a summit today (19 June) that European nations must avoid sleepwalking into another gas crisis, which he said could hit Europe within weeks as tensions between Ukraine and Russia resurface.
Oil Strikes Could Lead To UK Black-Outs
A row over jobs at an oil refinery has turned into a bitter dispute that could threaten Britain's electricity supply.
Saudi Aramco awaits more Yanbu refinery bids in July
RIYADH (Reuters) - State oil giant Saudi Aramco will invite contractors to bid in July for seven packages of a 400,000 barrels per day (bpd) joint venture refinery with U.S. ConocoPhillips (COP.N), the Middle East Economic Digest weekly reported.The two firms halted the bidding process for contracts to build the refinery in November due to uncertainties clouding financial markets and after a drop in input costs.
Saudi May Inflation Speeds Up for First Time in 2009
(Bloomberg) -- Inflation in Saudi Arabia, the Arab world’s largest economy, sped up for the first time this year on higher global oil prices and housing shortages in the kingdom.
Obama still concerned about oil speculation
WASHINGTON (Reuters) - President Barack Obama remains concerned about speculation in the oil markets even though he has not proposed concrete steps to rein it in, White House spokesman Robert Gibbs said on Thursday.
Are sky-high oil prices ahead?
Veteran oil analyst Matt Simmons says we are. Simmons, founder of Simmons & Co., argues oil's price plunge from record-highs last year to below $50 took many oil fields out of production. The low oil price forced many oil companies to delay projects, decrease the number of rigs deployed, consolidate operations/lay-off staff, and above all, to abandon expensive projects. That deceased production, plus aging oil fields and the credit crunch's impact on oil exploration, help set the stage for the current price rise. What's more the price rise will continue, Simmons argues, because producers will not be able to increase global oil supply fast enough to keep up with soon-to-be rising global oil demand. Simmons believes the average daily price of oil in 2010 will be $200 per barrel (in 2005 dollars).
Kuwait-China mega refinery eyes approval in six months
BEIJING (KUNA) -- Kuwait and China are currently in the phase of reviewing candidate locations for a mega refinery and petrochemical complex project in south China's Guangdong Province, and gearing up for construction approval this year, a Kuwaiti diplomat said Saturday.
Aging Oil Terminal Vital To Iraq's Economy
The most important cog in Iraq's economy is a rusted hulk in the Persian Gulf, 30 miles off of Iraq's coast.The bulk of Iraq's crude oil flows through the aging Al-Basrah Oil Terminal, where oil pumps run around the clock, 365 days a year filling giant oil tankers.
Airlines renew call for rules on oil speculators
CHICAGO (Reuters) - U.S. airlines, fed up with volatility in oil prices, are renewing pressure on the government to curb market speculation.Oil prices, up 115 percent from a January low, directly influence jet fuel prices. Surging oil prices can be catastrophic for an industry that seems always on the brink of financial meltdown.
The stakes are especially high for airlines with the economy mired in a deep recession and travel demand off sharply.
World's airlines in fight for survival
Faced with thier biggest crisis in history, airlines from throughout the world gathered in Kuala Lumpur to take stock and swap survival strategies.
The mainstream media can't seem to portray anyone with concerns about the future in anything but a condescending, unflattering, off-the-deep-end light. Why is a desire for independence and self-sufficiency – some of the founding characteristics of this country – now considered to be offbeat, weird, or even un-American?I find it ludicrous that some apartment-bound critic who would be hungry, thirsty, cold, in the dark and unable to use the toilet during a natural disaster has the gall to criticize someone for growing tomatoes in his backyard and stockpiling canned corn. Those of us who will be warm and well-fed during a disaster are called "nutjobs," "wackos," "dumb" and the ever-popular "right-wing extremists."
Cows are getting much greener, thanks to not-so-green methods. How do we know what's best?
Exxon's Brazen Greenwashing, on the Front Page of The New York Times
Exxon's new ads tout the idea that car emissions are 95% lower now than in 1970. But not so fast, says one scientist.
Tibet drought worst in 30 years: Chinese state media
BEIJING (AFP) – A drought in Tibet has intensified into the region's worst in three decades, leaving thousands of hectares parched and killing more than 13,000 head of cattle, China's state media said Saturday.The report by Xinhua news agency follows a warning by China's top weather official last month that the Himalayan region faced a growing threat of drought and floods as global warming melts its glaciers.
Cost blocks global clean air, study says
WASHINGTON — Finding an economical way to capture carbon dioxide from existing coal-burning power plants is key to getting China to reduce its greenhouse-gas emissions as well as for U.S. efforts to combat global warming, says a study released Friday.
Contact
- Content: editors at theoildrum dot com
- Tech support: support at theoildrum dot com
License

This work is licensed under a Creative Commons Attribution-Share Alike 3.0 United States License.
Friday night failures:
40 banks failures in 2009
I just (speed) read the IDA P.O. report linked above, and need to go back and read it in more detail to discern what it does or does not say about predicted/possible flow rates compared to demand. I didn't see references to price of the resource, nor to condensates, natural gas liquids, biofuels, EROEI, etc. I understand that the report concentrated solely on crude oil production, but I would hope that USG conducts a more comprehensive analysis of the geopolitical implications of declining oil flow rates, and indeed, the entire energy situation through 2100.
I suspect that such an analyst (or more than one) may already exist...just not in domains that we have access to.
Much ado has been made here and elsewhere of the energy saving potential of LED technology, and one gets the impression that LEDs are vastly superior to their incandescent and CFL counterparts in terms of their luminous efficacy. Well, it may be instructive to take a closer look at what’s actually available now as a direct replacement for your standard GS or A19 incandescent, as opposed to some lab tech’s wet dream.
Philips just announced their MASTER LED 7W which is their first screw-in replacement for a household incandescent. It draws 7-watts and produces 180 initial lumens (25.7 lumens/watt); at the end of its 45,000 hour nominal life, lumen output falls to 126 lumens, or 18.0 lumens/watt, assuming Philips calculates life expectancy at 70 per cent lumen maintenance. It’s CRI or colour rendering index is 70 or 85 depending upon colour temperature -- a typical CFL has a CRI of 82 and a household incandescent is pegged at 100 (higher numbers are better).
To put this into perspective, a basic 100-watt incandescent lamp provides 1,600 to 1,700 lumens, so this LED is about one-tenth as bright. In terms of luminous efficacy, a 70-watt Philips Halogená Energy Advantage A19 clocks in at 22.8 lumens/watt and a typical CFL runs in the range of 60 to 70 lumens per watt. Thus, a CFL is two to three times as energy efficient as this replacement LED.
Note too that LED life and light output decay rapidly at higher operating temperatures, as what would be encountered if the lamp is used inside an enclosed fixture or in base-up operation. If internal temperatures routinely exceed 35C, life and lumens fall sharply.
So just how hot can things get? Our firm recently installed several hundred 25-watt PAR38 integrated ballast ceramic metal halide lamps at a major retailer. Roughly half were installed in open gimbal track heads and the rest within recessed fixtures that are located inside an air conditioning return plenum. The average operating temperature of the open air lamps was 67C and the lamps inside the recessed fixtures reached a whopping 105C (literally hot enough to boil water). Unfortunately for us, the internal thermal cut-off for these lamps is 85C. Any guess as to what happened next?
Cheers,
Paul
I read stories in the news about how in the lab they can get 130 lumens/watt or thereabouts. But what they can do in the lab and what they can bring to market in a product are two different things.
For me, the only use I have for LED lighting are the headlights for my bicycle. The CFLs that we have are still working just fine after several years.
As a lightweight backpacker, LED's have been a leap foreword, providing long battery life and lightweight performance.
They have not permeated other parts of my life.
Exactly. Theory and reality often travel in opposite directions, and products operated in the "real world" seldom perform as well as they do under the controlled conditions of a lab, or they don't scale up to be commercially viable. I'm sorry, I can't read a newspaper using a lamp that's not much brighter than my night light, and please don't ask me to spend $50.00 on a lamp that's not even half as efficient as the $2.00 one I use now. As I've said here before, we may get there eventually, but there's a lot of road to cover between now and then.
Cheers,
Paul
Hi Paul,
I'd say it's more a problem with implementation than the LED themselves being 'vapourware' I'm using the latest tech in LED but it takes a while to filter into the marketplace.
Here are some of my bikelights I chundered up on my lathe; they blow any CFL, halide, halogen out of the water when it comes to sheer brightness and the new tints are excellent (not blue at all):
http://www.geocities.com/telescopiman/MC_E_Blog.html
my new 3000 lumens light at around 40W.
http://www.geocities.com/telescopiman/LEDS.html
2200 lumens at 26W
Here are the latest we can get in the UK for household bulbs:
http://www.ultraleds.co.uk/household-bulbs-mr16-gu53-c-92_94.html?osCsid...
Very good company the last.
Have patience! They can achieve 100+ lumens per watt with the CORRECT
implementation.
Marco.
Hi Marco,
You've done some mighty impressive work with these custom LED bike lights. Congratulations!
I took a quick look at the ultraleds offerings. There are several MR16 and GU lamps I see, but no direct replacements for standard GS lamps I take it? As you can appreciate, it's hard to judge the relative merits of these lamps without specific knowledge of their power ratings, CRI, colour temperature, service life, lumen depreciation curves, operating temperature limits, and the like.
Just as a general comment and nothing in relation to this particular retailer, when you compare the spec sheets of Philips, Osram Sylvania, GE and the other reputable players in the industry with some of the claims made elsewhere, you have to wonder if the wool isn't being pulled over our eyes. In the absence of any industry standards and regulation, the less scrupulous have really poisoned the well.
Cheers,
Paul
Thankyou!.
The GS, ES ,BC bulbs are slowly filtering though onto the market just now. Could be 1-2 years before prices are competitive on a Lumens/cost basis - so I agree with your earlier point!
Yep Brand is a BIG deal. The cheaper suppliers are using cheap brand LED where the dice are degrading possibly due to doping contamination / poor manufacture practice. I ONLY use Cree. Some of the earlier MR16's populated with 5mm lED's were degrading seriously quickly.
The problem is who the heck wants to get into the technical side of all this (present company excluded!) Soccer mum wants to go to the shops and buy a lightbulb without having a degree in optoelectronics - and it's these 'shop bought' LED bulbs that are rubbish! Some of the specialised online retailrers like the one above sell the real deal.
Paul,
I live in an LED environment where all my lighting is provided by LEDs. Granted, I live in what is called an RV. I am a full-time RVer, and often-times live off the grid on solar power. My RV has a 12-volt electrical system and was originally equipped with 12-volt incandescent and fluorescent lighting fixtures. I have replaced the lights in those fixtures with LEDs to provide an equivalent (or even better level) of lighting.
The first point I want to make is that IT WORKS!!! I am using about 20% of the power I would be using to produce the same amount of light with incandescent lighting. And the light I have is quite sufficient for living, reading, and doing anything else that requires being able to see what you are doing. BTW, my LED lights are producing only 2% of the caloric heat required to make the incandescent lights even work.
IMHO, LEDs are VASTLY superior to incandescents, fluorescents, and CFLs, for several reasons.
I do agree that some of the products proposed by the larger companies may be wet dreams. That is because they have not really looked at the problem of lighting and for what it is needed and how to really address the lighting problem.
The original 12vdc light bulbs in my rig produced about 150 lumens when they were new. Of course, half of that light was directed upwards against the back of the fixture, which painted white might reflect 40% of that light back down into the area where it was useful. So the useful lumens from an 1141 bulb was about 105 lumens. And within 1000 hours, that bulb would have browned until it would maybe yield 60 lumens of useful light, if you had not thrown it away and replaced it a long time ago.
I replaced my 1141 bulbs with LED lamps whose light is directed into the work area. They provide 120 lumens of useful light where I want it. Since this LED has the proper kind of voltage regulation and thermal control, it is expected to last up to 100,000 hours. I have been using these LEDs for three years so far, and I have noticed no deterioration in luminosity.
The example with the 1141 bulb is only one example. I have replaced all my halogens and fluorescents with LEDs. Not only does it reduce the cost of power for lighting, but it reduces the power required for air conditioning to remove the excess heat produced by the lights.
BTW, one of the little discussed problems with CFLs and other fluorescents is that the spectrum contains a component of UV. I have had cataract surgery, so I know what the effects of UV can be. I was lucky, because the surgery went well, but after working 35 years in a fluorescent environment that contributed to my cataracts, I really don't want to add to the problem.
I take issue with your statement "To put this into perspective, a basic 100-watt incandescent lamp provides 1,600 to 1,700 lumens, so this LED is about one-tenth as bright." The statement is true, but it sidesteps the fact that we do not need that much light for most of our living. I read under the light from a 180 lumen LED, and it is quite sufficient, even though it is 1/10th the light I could get from a 100-watt incandescent. In fact, I would have to put the 100-watt incandescent at least 10 feet away before the light on my book would be tolerable. We need to change our concept of what adequate lighting really is.
You also said, "Note too that LED life and light output decay rapidly at higher operating temperatures, as what would be encountered if the lamp is used inside an enclosed fixture or in base-up operation. If internal temperatures routinely exceed 35C, life and lumens fall sharply." That is absolutely correct, in fact, a temperature at an LED junction in excess of 85C will destroy that junction. The obvious solution is to design the LED with adequate heat sink to keep the temperature into the operating range of the junction. If the LED lamp is designed correctly, it WILL last 100,000 hours.
So, I think you are putting down LEDs without really realizing their importance in the future. Yes, there is still much to learn on how to make better LEDs and how to change our entire approach to lighting, but we already have experience and product that works, and works well. LEDs are the way of the future, and when energy becomes less available, LEDs will be the prominent form of lighting.
Sam Penny
the Prudent RVer
I just want to toss in that while I see good points from both yours and Paul's sides of this issue, it's also just a great relief to follow a truly practical discussion.
I've gotten really tired reading thread after thread of people's predictions of what 'the masses' or 'the PTB' will likely do..
I really wish we could figure out how to pull together the TOD:WIKI.. if the devotess among us had a sction of the site to report to, where we'd put in our 5 or 55 minutes before checking out the Drumbeat, ala SETI, just applying relevant text from threads into their pigeonholes.. there could be a really interesting conglomeration of experience that would be much easier to shuffle through.. I think.
bob
A wiki, by definition, is participation by the masses. It needs no great organizer nor some great overriding, controlling structure. In line with keeping the TOD nameplate intact, give some TOD staff and maybe some reliable, stable posters top level authority to delete/edit that which is not appropriate/accurate. In other words, go set one up. Will take you, what?, 10 minutes?
If you build it, they might come.
And, hey, if TOD staff ain't cool widit, you have my blessing to call it The Peak Drum Beat Oil Perfect Storm Wiki. That should get you around any copyright issues. Or maybe TDO: The Drum of Oil Wiki. Or Oil The Drum Wiki. TEOTOAWKI: The End Of The Oil As We Know It Wiki.
;)
Cheers
PS: I think it a sign of our overly complex times that issues such as this become... overly complex.
We've considered a wiki, but I think it would be more trouble than it's worth. You need a certain critical mass before a wiki can work, and I don't think we have it.
If you don't have that critical mass, it becomes spam heaven. That's what happened to the PeakOil.com wiki. It filled up with porn spam...and the spammers even edited it to remove the edit tabs, making it hard for ordinary users to remove their entries.
There would also need to be some kind of "super users" to settle edit wars and such...meaning more staffers, or more work for the current staffers.
However, if you think it could work...you could start a peak oil wiki. It doesn't need to be under TOD domain, does it?
There are already some pages on wikipedia.org - why not expand the offering there?
I think it would have far more potential and a good startup IF TOD sanctioned it or sponsored it...the costs could be borne in other ways.
I believe there are any number of folks here with the ability to manage it.
Its needs a Big Brother...and the rights to copy data back and forth or at least to the Wiki.
The LED discussion is why....I was sold on CFLs but now I am thinking seriously of LEDs after reading those comments above by the RV Guy.
I hate even the small amount of heat the CFLs put out.
I have a Led flashlight that is 3 years old and using the same batteries. 2 C cells.
Airdale
One thing to point out is that 12Vdc is a much more appropriate voltage to run an LED on, given that each LED has about a 1.5V drop and needs DC. As soon as you need to supply rectification and transformation to a lower voltage you will incur losses, and that means dissipating heat. I didn't see what current your LED's draw, but I assume they are arrays of multiple junctions so they can run directly on 12V - this is as close to ideal as you can get.
Hmmm.... What's the cost of living in an RV, less fuel for driving?
Cheers
Just want to say I find your posts really interesting.
If not for peak oil, I would probably aspire to one day be one of those retirees who drives around the country in an RV. I love to travel, but hate to pack. :-)
I still suspect that will never be an option for me, but reading your posts...I can dream.
I have done it in the long ago past..
You spend a lot of time hunting usable empty parking space to park for a day or so..usually Sam's Clubs or WalMarts...else you can get fined.
And campgrounds are usually full.
Airdale
Hi Sam,
I appreciate your thoughtful response and I'm pleased to hear that your personal experience has been rather positive; that's encouraging. I do agree that LEDs hold great promise going forward and no doubt the range of applications will continue to expand over time, but in terms of general purpose lighting, they're not a practical, cost-effective solution at this time and won't likely be over the near term.
No two sets of eyes are quite the same, but as mentioned above, I can't comfortably read newsprint or small type without a reasonable amount of light. One hundred and twenty lumens is about the same amount of light as would be provided by a 15-watt incandescent. I have two 13-watt CFLs in my desk lamp and, combined, they supply some 1,700 lumens, the equivalent of a 100-watt incandescent. I find it barely acceptable for the mix of computer and paper related work that I do. I need a reasonable amount of ambient light, in addition to task lighting, so that I can comfortably move my eyes from paper to keyboard, to monitor and back, or anything else that's around me without the need to constantly readjust. And consider this as one man's opinion, but I find a dark home depressing, especially during our long, cold winters. I crank up light levels enormously during these times as my way to fight off the "winter blues"; it happens to work well for me and I genuinely prefer it to any of the standard alternatives.
Lastly, and this may explain some of my scepticism, I've spent a good amount of money over the years on some very nice, brand name ceramic metal halide lamps for personal use (e.g. Philips MasterColour Elite and Osram Sylvania Powerball Plus) and a surprising number have unexpectedly clutched their hearts, spun around on their heels and gasped their last breath well before their best before date. As much as I love the incredibly beautiful light they provide (clean, crisp white light, 90+ CRI, deep rich reds, brilliant, jewel like sparkle, etc.), I've concluded that it's not worth worrying about when the next one will bail out on me. Even taking into consideration their very high efficacy (upwards of 100 lumens per watt), I would be shocked if I could ever recoup my initial investment in energy savings. When you can pick up a six pack of good quality CFLs for five or six bucks at any big box retailer and be reasonably assured of several years of reliable service (and some of my Philips CFLs have soldiered on forever), it's hard to see how anything else can compete... and if one or two of them should give up the ghost, well, so be it; at a buck or two a pop, I'm not gonna sweat it (versus, say, a $150.00 MasterColour Elite CDM).
Addendum: In doing a little more digging, I've discovered that Philips is calculating the 45,000 hour service life of its new LED replacement lamp on the 50-50 rule; that is to say, the point at which half the lamps in the test sample are still operational and the other half have failed. I had assumed it was the point at which light output falls to 70 per cent of its initial value, and I'm rather disappointed to learn otherwise. So, basically, if you were to hoof it over to Wally World and purchase one of these lamps today, there's a 50-50 chance that it might still work at 45,000 hours. And as for how much light it will supply at that point, there's no published data, at least none that I could find, so I'm guessing the news may not be all that good (if it started out at one-tenth the brightness of our 100-watt incandescent, it could very well turn out to be half that again).
Cheers,
Paul
ELM in action ... good real world data to demonstrate the seriousness of the problem for 'net importers' with gas guzzlers.
Do you think Mexico will conserve to avoid unaffordable imports as long as possible, or continue to export as fast as it can and hit the 'brick wall' at full speed?
... full speed ==>> brick wall !
And yes, it's an in your face ELM-sample
The EIA shows the following total liquids for Mexico for 2004 (annual volume, not per day):
Production: 1,404 mb
Consumption: 728
Net Exports: 676
The cumulative shortfall, through 2008, between what they would have produced at the 2004 rate and what they actually produced in the 2005 to 2008 (inclusive) time frame was 5,616 mb - 5,173 mb = 443 mb.
If they had maintained their 2004 net export rate, they would have (net) exported 2,704 mb in the 2005-2008 time frame.
So, how did they respond 443 mb production shortfall? Cut consumption to maintain net exports? Nope.
Cumulative net oil exports in the 2005-2008 time frame were 2,121 mb. So the cumulative net export shortfall was 583 mb (2,704 - 2,121), about one-third more than the cumulative production shortfall (which reflects the increase in consumption over the time period).
Recent Net Oil Exports from Mexico (EIA):
thankyou for your graph , westexas , its a shame we can't get it to the desk at the white house , let alone No.10 downing street.
It would bring the situation home !
( well there again maybe not, not for GB anyway as the market provides all :( ) .
Forbin.
One graph is not enough. They would think 'just one giant field in one country'. Add the graph of countries past peak and pre peak and the time-graph of past oil discoveries and consumption. Explain what ELM does.
Then change will come...
Jolly good idea Henri 2!
If say Rembrant "had the time" and added one red curve (permanent decline) and one green curve (still growing/undecided) - - on top of his global C+C chart it would be quite educational to anyone, since "the greens" always at some point in time will turn "red", but never the other way around. The tendency will grow stronger and selfevident with time.
Over time the green line will plunge deeper and deeper whereas the red line will flatten more and more ... good show IMO (Edit :: At least, I think I know what I mean ??!! :-))
That graph is generated by the EIA website, I'm sure the White House is familiar with the EIA. Anybody can make these simply by selecting a Country Energy Profile in the International section and clicking on "Consumption" in petroleum.
This graph is of the top 5 destinations for US product for March 2009:
Note the massive spike in exports to Mexico last year, which has tailed off markedly, while exports to the Netherlands is on the rise. A sizable part of the wobbly 3 legged stool that is Mexican energy security is their need to import product and sell at subsidized prices, as they lack the refining capability to produce enough for their own consumption - which has been on the rise of late. This is funded by, what else, sales of crude oil; so this would accelerate the decline of product availability for their citizenry, barring budget cuts elsewhere by the Mexican government, to be funneled into buying product from the US - which will be that much more expensive owing to having ship it from more distant parts of the globe...
Here are the EIA charts for production & net exports for Indonesia, which like Mexico was consuming about half of their production at final peak:
Total Liquids Production (EIA, for some reason only through 2006):
http://tonto.eia.doe.gov/country/img/charts/ID_petro_large.png
Net Exports:
http://tonto.eia.doe.gov/country/img/charts/ID_net_imports_large.png
I usually pick 1996 as the final production peak for Indonesia, although it was not the absolute production peak. In any case, four years into their post-1996 decline (halfway to net importer status, time-wise), they had shipped about 80% of their post-1996 cumulative net oil exports. Interestingly enough, their net export rate in 2000 was only down by 37% from their 1996 rate.
Mexico's 2008 net export rate was down by 42% from their 2004 rate, and they too have probably shipped on the order of 80% of their post-peak cumulative net oil exports, as of the end of 2008.
Edit: If Mexico shows the same average volumetric drop per year for the next three years that they showed in 2008, their last year of net exports will be 2011. Based on this assumption, their post-2004 cumulative net oil exports would be about 2.6 Gb, and as of the end of 2008, they will have shipped right at 80% of post-2004 cumulative net oil exports. Even if they do show a drop in consumption, which is likely, they would probably only make it to 2012 as a net oil exporter, hitting net importer status in 2013.
Mexican crude production through Mar 2009:
Because of limitations like you mention I'm building up my own database of EIA stats, their readymade graphs fall short in most respects other than convenience.
What about the same graphs for UAE, Kuwait, Algeria, Angola, Libia, Kazakhstan, Canada, Russia, Sudan, Qatar...?
my money is on the brick wall.
When did any in office politician or majority of voters ever go for anything but good times here and now?
I agree - so any future that doesn't assume this is unlikely, including any meaningful changes to avoid climate change or mitigating inorganic phosphorus depletion!
Re: top linked news story
Until companies like "Bernstein Research" start publishing their data and analysis, I treat these assertions with suspicion. I don't see an algorithm or theory so AFAIC they have no leg to stand on. What kind of bizarre profession is this that should be so accommodating to a formal analysis yet instead relies on heuristics and consultants' hearsay?
Oh, I forgot, for $10,000 dollars I can probably receive a detailed report (i.e. a memo) from Bernstein. Then I will understand everything. Yea, that's the ticket :)
mcmahon writes: " which means that technology will have to overcome the laws of physics to improve the flow rates from these new discoveries. "
this oil peak oil stuff is soooooooooooooooooo easy.
It might be useful to lead the PO arguments with a comparison to Flow Rates for an Asthma Sufferer.
ie, 'There is PLENTY of air to breathe out there.. I don't care what they're blaming it on, it's a real problem when you can't get the air in fast enough.. and THAT's what PO is all about!'
(OK, wordsmith it a little.. it's not meant to say that there's as much oil as there is air.. but our constrained access to it is going to have similar effects. When you can barely breathe, think of all the other things you are not going to be able to do..)
Thanks for pointing that out elwood - when you skim you miss these little nuggets of insanity. Someone at peakoil.com had a really eye-opening quote as a signature, something like "Who knows what the 2nd law of thermodynamics will be like in 10 years?" from a 70s economist or the like.
If its not flaunting the laws of physics, its not understanding basic statistics. Like "Today is kind of chilly, they must have gotten Global Warming wrong" or "Prices are down, must mean we are in good shape". I don't know which is worse, physics ineptitude or statistical illiteracy...
Don't even know if I should bother asking, but surely you're familiar with How to Lie With Statistics? This is neither ineptitude nor illiteracy, but cynical manipulation and cognitive dissonance.
The truth is buried in the numbers, if somebody misleads w/ statistics then somebody has to set them straight.
hz drilling of source rock amounts to a tracheostomy.
http://en.wikipedia.org/wiki/Tracheostomy
re:barnett
"Texas Railroad Commission spokeswoman Stacie Fowler said that 10,539 wells had been drilled in the Barnett through March and that there are 9,732 producing wells."
there you have it, 74 rigs drilling and 707 wells drilled, but not on production or dry holes, so maybe an 8-9 month backlog. if the drilling peak was august -'08 we may be seeing the results of rigs being idled any month now.
http://www.eia.doe.gov/oil_gas/natural_gas/data_publications/natural_gas...
wondering how it can be that nobody knows what barnett production is, doesn't the rrc publish this data ?
Drilling Home Page for TRC data. New Drill Dry/Completions are up 17% YOY.
Caption: "So much for Quiet and Peaceful...."
From BARNETT SHALE DRILLING ACTIVITY, a photo blog. I've asked if drill pad overcrowding might be an issue, but no one has an answer.
I thought this article was pretty telling:
http://www.istockanalyst.com/article/viewnewspaged/articleid/2738584/pag...
Barnett thins as it moves west, so once the two best eastern counties are drilled, production pretty much has to go down. If peak is this year, then Barnett gave about 10 years up slope. If the curve is symmetric then we could see another 10 years production. But all these other shale plays are coming on line with possibly cheaper gas (because they are drilling the best locations). Could that mean early abandonment in Barnett? Or would the companies holding leases drill anyway?
Wow - thanks for this link, Jon; it certainly didn't get any attention in the meantime, or people think Johnson county and the #3 operator in the Barnett aren't that big a fish in the overall schema.
I really like that map of well locations you posted. Do you know the source ( I have been paging through the blog you linked but I don't see it). Most of the wells have been drilled in the "core" of Wise and Denton counties.
Look at that rig count by county graph at the same site. Wise and Denton have fallen far below Johnson and Tarrant in rig count. So they must already be drilled up. Those were the best. Now we are getting reports of Johnson nearing the end.
I don't see how Barnett can be expected to grow for several more years. Navigant consulting projected the amount of recoverable gas to be 44 Tcf or more. It has recovered about 4 Tcf to date. If the best counties are drilled up, or nearly drilled up, how will it reach 44?
Barnett Shale Maps, of course. Great resource, there's stuff there pulled from EOG pdfs for instance. I see all kinds of intriguing links when Googling the Barnett.
Was hoping you'd know! I'm just looking for what seems obvious on the face of things that this can't go on forever - you'd have derricks as common as maple trees after a while, and as an unchanging feature of the landscape; this on top of attendant issues with groundwater infiltration/earthquakes/mud ponds/water depletion. NG is proposed as some kind of bridge energy; I say sure - for buses.
Found it telling that Dave Hughes's new presentation hasn't changed in tone at all since the material he prepared four years ago, when we weren't sure if all these wells could be drilled in one year in the first place. Hope someone does an in-depth interview with Dave again sometime. Are you listening, Dave Strahan? Jason Bradford?
4.4 bcf per well for 10,000 wells seems a little optimistic, but is 44 the end of it ?
arent the likes of navigant consulting claiming much higher resources and calling them reserves ?
per well average rate is a about 500 mcfd/well and to get to 4 bcf per well remaining would equate to a decline rate of about 4%.
i wonder if the 40 bcf is based upon 10,000 wells, or many many infill wells. some public trading companies are essentially claiming that they can drill wells on 40 or 80 acre spacing and get the same results.
this story gets fishier and fishier.
Yes, some of the numbers they toss out are kind of crazy. These are taken from "ShaleGasPrimer2009.pdf" from the DOE (sadly). They quote the Navigant study as the source:
For Barnett they have Gas In Place of 327 tcf and 44 tcf recoverable. 13%
For Fayetteville they have GIP of 52 tcf and 41 tcf recoverable. 78% how?
For Haynesville they have GPP of 717 tcf and 251 tcf recoverable. 35%
Arthur Berman has quoted that the average recovery for a horizontal Barnett well is down to 1.2 Bcf in "Haynesville Sizzles while Barnett Cools".
If we assume for a second that an estimate of 8 tcf is closer to correct for Barnett, that would mean a recovery factor of 2.4% If that is true, then, yes, we will see a bit more production from the shales, but nothing like the conventional gas that is leaving.
Berman also has an update on his analysis of Haynesville shale out at the Petroleum Truth Report. He finds that Haynesville wells are delivering a lot more gas (average over 3 bcf but depends on location). But due to higher completion costs it will still cost $7 per mcf to be commercially viable. Looks like 2009 will be a rough year in the gas industry.
http://petroleumtruthreport.blogspot.com/
Interesting documentary reviewed on financialsense today (STOCK SHOCK) which covers the rampant short selling fraud on Wall Street and Wall Street's ownership of Washington. Don't worry-their schemes to address climate change will be totally on the up and up as many TOD cornucopians proclaim.
I am posting this on a DB since I can't wait for a Campfire that would possibly address it.
Right now this spring and early summer has been a huge huge bloom of white clover here in my area of Ky...huge beyond what I have ever seen.
So I mow a bit of it...but watch out for bees, of which there are absolutely none..none...get it..none..
But clover buries a lot of nitrogen..so what to do about that? Well you want to harvest it for sheet mulching on your garden..the nitrogen nodules that form feed the rest of the plant so it reasons that the leaves and stems have a goodly lot of organic nitrogen...you mow it and a few days later it blooms again,you mow and more blooming...and all the while gathering the residue after it 'cures' to put on your garden....
Ok...comes a point in time when it finally gives up and wants to throw seeds..the white blossoms turn to seed heads.This is the time to NOT gather the windrowed cuttings but let it scatter for the next year or the year thereafter crop....funny thing about clover,,in the field or yard...it sometimes skips a year and then comes on gangbusters but then goes away. Very tricky clover is and I have sown it and cut it for hay for many years ,,but quit about 5 yrs ago..when no one would pay for good square bales....
So this is White and not Red but still a N fixer...this is the time if you have a massive bloom and set like we do to greatly improve the OM and N in your garden,,OM= Organic Material....these years are not that frequent..make hay while the sun shines ....
I mowed mine and gathered it several times so far this growing season...
A source of good organic N is maybe sitting in your yard right now..my yard is really not a showcase,for I refuse to do with it what society dictates...I use it to grow my mulch...piss on the others who I see riding 20 hp John Deere 48" mowers cutting their 3 acre front yards and sacking it up for disposal like idiots.
Airdale
thanks for the info airdale.
but hey you'd be wasting good nitrogen on those on those clueless 'Deere' drivers.
Well truth is I got a JD mower also..a LX176 and it is built really well but I use it not for keeping a golf course like yard. In fact I like my yard to look junky. This lets would be prowlers know that I don't give a shit and they might could get in real trouble...
But I do trim around my berry bushes and keep the rough stuff in control...but the main purpose is to let the yard suck up the airborne N and then I transport it to the garden...its a win win all the way around...I never put any N,P,K on the yard. It is where the dogs live and they like it rough.
I don't know the uptake of white clover for N or whether it rises in the morning or at night but I just mow the heck out of it and put it in the garden.
BTW the elderberry bushes this year are way way very prolific. Never seen so many before. The poke meanwhile has not shown much growth so I didn't get to cook up my yearly Poke Sallet. Some did come up but not as it usually does.
Gathering good sheet mulch is a God Send....IMO...
Airdale-and funny that the usual Bermuda is not coming up this year...
a strange year its turning out to be...tomatoes are about ready for Fried Green Tomatoes.about 2 inches in diameter
I collect wild concord grapes. Those are also variable from year-to-year, with some years nothing. I also usually see what I think are chokeberries -- aronia, alongside the grapes. These are supposedly good when cooked as well.
THE ARCTIC IS MELTING
“It will without doubt have come to your Lordship’s knowledge that a considerable change of climate, inexplicable at present to us, must have taken place in the Circumpolar Regions, by which the severity of the cold that has for centuries past enclosed the seas in the high northern latitudes in an impenetrable barrier of ice has been during the last two years, greatly abated….
(see additional*)
….. this affords ample proof that new sources of warmth have been opened and give us leave to hope that the Arctic Seas may at this time be more accessible than they have been for centuries past, and that discoveries may now be made in them not only interesting to the advancement of science but also to the future intercourse of mankind and the commerce of distant nations.” A request was made for the Royal Society to assemble an expedition to go and investigate.
President of the Royal Society, London, to the Admiralty, 20th November, 1817, Minutes of Council, Volume 8. pp.149-153, Royal Society, London. 20th November, 1817.(from) http://www.john-daly.com/polar/arctic.htm
They were 200 years early on the melting.
And they did not have a long enough temperature history to know the difference between variation and trend.
Why do you work so hard to fool yourself?
Climate Change Impact Report
What a Wonderful Graph. Let me get this straight. A Doubling of CO2 brings about a temp change of approx. 1.2 degrees Centigrade. Do I have it about right?
Wow. That's a beaut.
If that doubling brings it up to levels ( ~380ppm ) not seen for 10 million years, then yes, you probably have it about right.
Actually, I kind of like This Graph of the last 12 Years.
Kinda takes out the UHI effect.
12 years data is weather, 120 years data is climate, everybody except you can see you can't use one to refute the other.
But actually, the concept of an average world temperature or climate is meaningless anyway, who experiences it?
Climate changes all the time, it is never a system in equilibrium and just because the world warms overall your bit of it might not.
The big question is, will our children and grandchildren be able to cope with any unnecessary serious changes we have intentionally caused? Tell everybody why you are so sure they will.
No, all it does is show your incompetence or bias. I leave it to the reader to determine if you are scientifically uneducated or just like to lie. Given what people say about your posts on ethanol, I can guess their opinions of this crap...
How about this one, from 1996?
http://www.woodfortrees.org/plot/rss/from:1996/plot/rss/from:1996/trend
Or this HADCRUT from 96?
http://www.woodfortrees.org/plot/rss/from:1996/plot/rss/from:1996/trend
Or RSS ASU 95?
http://www.woodfortrees.org/plot/rss/from:1995/plot/rss/from:1995/trend
Or HADCRUT 95?
http://www.woodfortrees.org/plot/hadcrut3vgl/from:1995/plot/hadcrut3vgl/...
Or 99?
http://www.woodfortrees.org/plot/rss/from:1999/plot/rss/from:1999/trend
http://www.woodfortrees.org/plot/hadcrut3vgl/from:1999/plot/hadcrut3vgl/...
Or even 2000? (Hint: still UP.)
http://www.woodfortrees.org/plot/hadcrut3vgl/from:2000/plot/hadcrut3vgl/...
http://www.woodfortrees.org/plot/rss/from:2000/plot/rss/from:2000/trend
Even more amusing, did you realize your '97 graph has an upward trend? Are you completely out to lunch?
In fact, the only way to get a trend of ten years or more that goes down is to use 1998. And that only because it was hugely anomalous.
But let's have some more fun, shall we? (I tried to put these on one graph, but the scales were too different.)
http://www.woodfortrees.org/plot/nsidc-seaice-n/from:1997/trend
http://www.woodfortrees.org/plot/esrl-co2/from:1997/trend
http://www.woodfortrees.org/plot/hadcrut3gl/from:1997/trend
Now the same over a statistically significant scale as far as climate goes:
http://www.woodfortrees.org/plot/nsidc-seaice-n/from:1979/trend
http://www.woodfortrees.org/plot/esrl-co2/from:1979/trend
http://www.woodfortrees.org/plot/hadcrut3gl/from:1979/trend
BTW, look at this:
http://www.remss.com/msu/msu_data_validation.html
If you can't post without lying, why embarrass yourself and post? That said, thanks for providing me with the opportunity to make the single most effective post I could have ever made on this topic while using your own petard to hang you on in the process.
LOL, you accuse ME of cherry-picking, and then you finish off with a chart that Ends in 2007 (leaving off most of the cooling,) and numrated in Kelvin. Kelvin = Celsius + 273.
Silliness
Idiotic. (We are not surprised.) I linked to a PAPER.
Real thermodynamic work is done in Kelvin because the basic formulas work on temperature relative to Absolute Zero. The offset from Centigrade is meaningful.
The earth has a large thermal mass, so there is a long time lag between CO2 levels and the corresponding temperature equilibrium. The climate sensitivity of the earth is believed to be about 3C for a doubling of CO2. 3C corresponds to a shift of climate zones of about 500 km towards the poles.
I love that you are so dishonest that you set yourself up so easily to be made a fool of.
1. The CO2 in that graph goes from @285 to @385. It's a rise of 35%, not double. Here, let me make it simple-like: 100/285= .35.
2. Doubling would be 570. Again, simple-like: 285 x 2 = 570.
3. Extrapolated out without any other feedbacks considered, that would equal about 4.5C per doubling. Simple-like: .35 = 1.5; 1.5 x 3 = 4.5. Since .35 x 3 = 105, slightly over 3x, I'll accept 4.4 to avoid doing the math.
This is elementary grade school math. Maybe 4th grade? 5th?
Since we've had these discussions before, you have no excuse. You are dishonest.
kdolliso has rendered herself into mental blankness --
She is not able to soak up new knowledge ... her brain is jampacked with nothing.
Her utterings have only one purpose : To irritate (and there it sits)
Maybe you had better go back to school. That graph is in Fahrenheit. There is, also, a well-known logarithmic effect (you get most of your warming in the first half of the temp rise.
Even the IPCC states you get about 1.2 Centigrade for a doubling of CO2 (THAT is where I got the number.)
You are correct re: F vs. C. I need reading glasses, so missed it. But you are still misrepresenting. You specifically implied THE GRAPH indicates 1.2C, but here say you got the number from the IPCC. Bait and switch.
And I call bull on that. If the IPCC is *currently* saying 1.2C per doubling, I'll eat my hat. Hell, I doubt they EVER said that as a declarative fact since they don't do that. Being scientists and not lying you-know-what's.
Give us a link. Oh, here (via wiki):
1.2 my arse. Liar.
You're embarrassing yourself. If you extrapolate the graph out using the logorithmic chart that IPCC endorses you'll come up with approx. 1.2 C per doubling.
And, yes, IPCC gives the number (w/o feedback at 1.2C/doubling.) You're looking at someone's dream about what it would be if they could get significant positive forcing from water vapor, and clouds.
You've got a problem with Clouds. Christy, and Spencer are, basically, in the process of proving that the forcing from clouds is significantly Positive.
I doubt that Kdolliso , cuz' every time I read ccpo's stuff I often find myself nodding -
BUT whenever I see your utterings I think HOGWASH. Just like this :
- A more propper name for this kind of meter should be Kdollis-o-meter (Do you see it ? Your name's last O is already in the correct slot ... how convenient..)
These days when I see your name "with some text under it" (I never read it), but I find myself thinking "that's a liar and she is full of rubbish". You are the only one I wish was gone from TOD.
Oops, that should have read:
Christy, and Spencer are, basically, in the process of proving that the Feedback from clouds is significantly Negative.
Listen, I am using the chart provided, which is what you originally responded to and referenced. That is the topic of discussion, period. Quit trying to change the goal posts. You're dishonest.
And quit telling us what the IPCC said 2 years ago based on science that is five years old, at best. You haven't a clue what the IPCC said because you don't give a shit what they said. You care about your ideology and maintaining the fantasy built on the lies you cannot bring yourself to acknowledge.
Spencer and Christy? Jokes. Their math is wrong, their research biased by their bought-and-paid-for agendas. Their troposphere, or whatever it was, work? A JOKE. (Review linked before. see RealClimate.) Cloud formation? Debunked. (See recent research linked over the last 7 months or so.) Sun? Debunked. (See recent research linked over the last 7 months or so.) All VERY recently.
Most damning, the shit you toss at the wall is cherry picked because they're the only things you can find that give you any leeway at all to nitpick. FACT: there is not a denialist paper, analysis, announcement or discussion anywhere on the planet - literally - that deals with, or even begins to, the overwhelming, globally systemic evidence.
While research in every area of climate completely supports, no, proves, climate change is real and accelerating, the best you can do is use bad data to make claims about one tiny area of climate science in the troposphere. Or, you just say the models suck while using models to "prove" models suck. Or, you say it's the sun. Or, the bad temp stations.
All the while you intentionally, studiously, and criminally ignore the vast mountain of data that you can't address without having to acknowledge how bankrupt, cowardly, incompetent and biased your actions are.
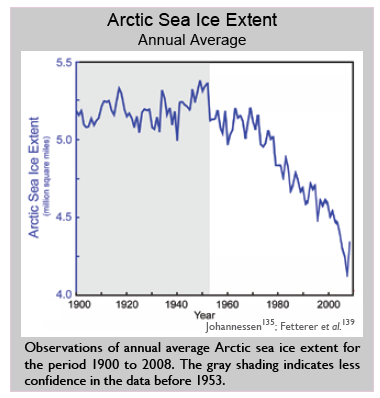
Tell us, after all, why the 2008, and likely the 2009, summer Arctic sea ice extents have come so close to 2007? 2007 had anomalous weather: storms, warm temps, wind from unusual directions. 2008? Cool and calm. 2009? the same so far. So, please, in your strange little world created for you by GCMI, GCC, BuCheney, Exxon, et al., how do you explain that '08 and '09 stay so close to '07?
Where, pray tell, is your rebuttal to my utter destruction of your asinine little graph linking foolishness? http://www.theoildrum.com/node/5510#comment-512732
Can't address that which tosses your crap in the crapper, eh?
Seriously, just shut the hell up. You deserve no quarter, and you get none. Read this
http://www.pik-potsdam.de/news/press-releases/files/synthesis-report-web...
then cease and desist for your own sanity.
I didn't cherry-pick; I could have used This one:
http://www.woodfortrees.org/plot/rss/from:1998/plot/rss/from:1998/trend
Look, you can yell, and scream, and wave your arms all you want. It's getting Colder, not Hotter.
The Argos Buoys show the Oceans cooling down, not heating up.
Sorry, It's Over. Your side lost.
the sun is hibernating this year ... didn't you know? Anyway, remember your tablets
Has it been hibernating since 2003?
Projections Up, Ocean Temps down since 2003
Bad: From 2005 (to show SIGNIFICANT COOLING.)
Response: Hahahahahaha!!!!!
Worse: And Jennifer Moron-isy?
Response: Brill!
Worst:
Response: What? No SCIENTISTS? WHAT a surprise. Go play, child. Yer drool and yabber are making a mess.
Yes, you could have, but that would have been too close to honest for it would have revealed you are still using the same idiotic argument that's been torn to shreds in thousands of places all over the internet. Instead, you try to hide that this is what you are doing, but end up using a graph that contradicts your cooling.
Damned fool.
When I put the 97' chart up I didn't say Anything about "Cooling." I said I preferred That chart.
Don't get too upset; your GW scam is good for another couple of years. Do it right you can retire off of it.
Iraq may be able to boost oil production to 6 million barrels per day within 10 years (EIA).
http://www.eia.doe.gov/emeu/cabs/Iraq/Oil.html
yes , yes, and by that time the Shiite- and Sunni-muslims have been cuddeling each other and started intermarriages years ago.Also Bin Laden has turned Christian and Al-Qaeda has disintegrated into thin air, the AGW problem went away .... the Depression 2 turned into a Super-Boost and everyone lived happily ever after.
See it's easy --- I mean putting stuffs into print!
Yes, it's truly excellent news! With an additional 4mb/d from Iraq we only need about 20mb/d of new crude by 2020... IF demand falls at an avg. 1%/yr and net decline is only 5.2/yr. on avg.
With flat demand we would only need 30mb/d.
Cheers
Can you please tell me your thoughts on an oil & gas junior- Cobra Oil & Gas (CGCG)?
Cobra Oil & Gas Co. Enters Into Letter Of Intent With Enercor, Inc. For Purchase Of 20% Lease Assignment On Utah Oil Sands Prospect Located On Exxon Mobil Corp's Leases.
http://finance.yahoo.com/news/Cobra-Oil-Gas-Co-Enters-Into-bw-458312586....
Cobra Oil & Gas (CGCA) homepage @ http://cobraoilgas.com
Looking forward to your reply.
buy buy buy
go into debt if you have to but for gods sake BUY!!!!!!!!!!!!
This really got me laughing. I can't stop. What a treat.
Thanks man!
Hope this isn't a dupe post.
First link is from Mish's site and is a dead give away as to his thought on the matter. Second link is the actual story as posted at NASDAQ.
Nitwits In Congress Propose Tapping Oil Reserves To Halt Price Increases
US Reps File Bill To Tap SPR To Counter Oil Price Rise
Yeah -- every time the oil price goes up -- those Senators always blah the same darn thing -- open the SPR.
Don't know why we even bothered -- they are pretty much clueless in what's happening. All they care about is their Moms asking why gas is so expensive.
Markey, Van Hollen, and Welch are first class idiots. But then there were Democrat Senators back in 2001 calling for selling SPR oil to lower oil down from the insane level of $20 per barrel.
Surely these guys have heard of Peak Oil.