| Could $30/bbl Oil Happen Before New Year’s Eve? | The Oil Drum: Europe | The financial return on energy invested |
Update on US GOM from MMS, EIA and Scout Data
Posted by Luis de Sousa on June 19, 2009 - 10:17am in The Oil Drum: Europe
 This is a guest post by Jean Laherrère on the current knowledge of the deepwater Oil and Gas reserve at the Gulf of Mexico. In this first installment of the series Jean looks at data recently made public by the MMS and compares it to previously published information from the EIA and scout companies.
In a coming installment Jean will discuss the recent Methane Hydrates findings announced in the region.
Update: The graph on Commulative Discovery for over 400 meters deep was corrected; originally showing the oil curve reaching close to 12 Gb, the correct figure is around 7 Gb. Thanks to ace for his diligent scrutiny.
For those not familiar with it, MMS stands for Minerals Management Service, the Federal agency that manages the United States' natural gas, oil and other mineral resources on its outer continental shelf.
Ace did an update on the Gulf of Mexico (GOM) on the 9th of February, 2009 (TOD 5081), but MMS has released in May of 2009 several reports:
- Gulf of Mexico oil and gas forecasts: 2009-2018 MMS 2009-012;
- Deepwater Gulf of Mexico 2009 MMS 2009-016 (updating Deepwater Gulf of Mexico 2008: America’s offshore energy future MMS 2008-013);
- Estimated oil and gas reserves, Gulf of Mexico OCS, December 31, 2005 MMS 2009-022;
This article uses this data from the MMS and compares it with the EIA's and scout data.
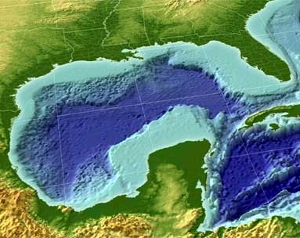
What is deepwater?
Definitions of its limit in water depth vary from 656 to 1500 ft (200 to 457 m). Royalties vary with water depth: 0-200m, 201-400 m, 401-800m, over 1000m. Deepwater is defined as >200m in the Outer Continental Shelf Deep Water Royalty Relief Act of 1995, and the MMS, being a federal agency, is obliged since 1993 to use the Système International units. The Energy Policy Act of 2005 has introduced new royalty suspension categories: 1600-2000 m (5249 to 6562 ft) and > 2000 m (6562 ft).
But in MMS's technical reports, to please the industry, deepwater is defined as >1000 ft (305 m) and ultra-deepwater as > 5000 ft. For the EIA deepwater is > 200 m. For the IHS the frontier data for the GOM is over 400 m.
Past production
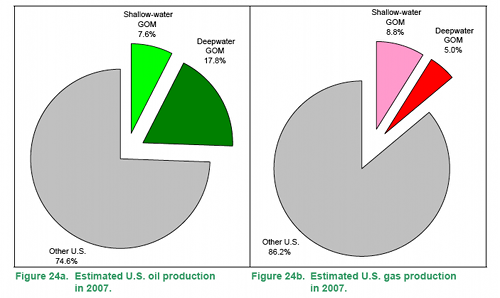
In 2007 oil and gas from the GOM represented respectively 25% and 14% of the US internal production.
 |
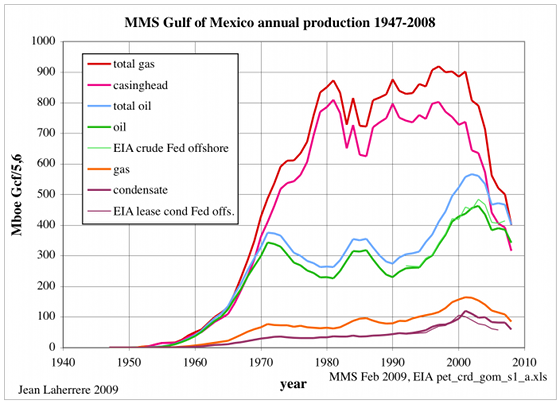
What was the past production in the GOM?
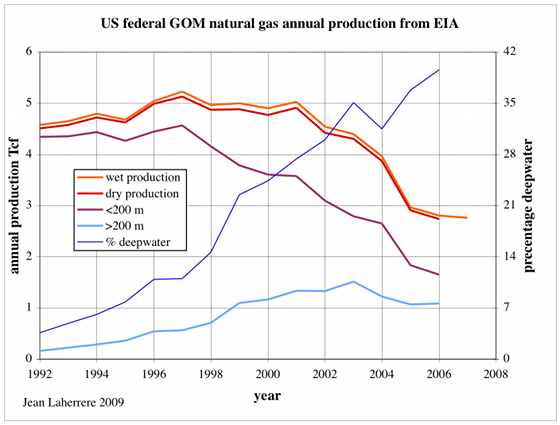
Natural gas (1 boe = 5.62 kcf) production displays a bumpy plateau from 1980 to 2000, while oil peaked in 2003.
 |
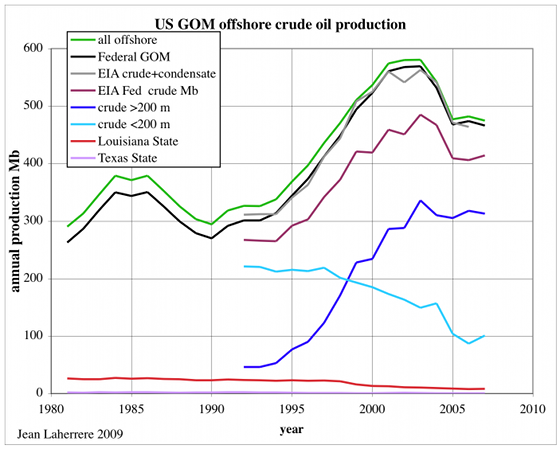
The state (Louisiana & Texas) oil production is negligible in front of federal production; deepwater production reached 76% of the total in 2007.
 |
GOM natural gas production is declining (in 2005 Katrina worsened it). Deepwater represented 40 % of this production in 2006.
 |
MMS forecasts production using industry committed projects for the short term and undiscovered estimates (full potential) for the middle term.
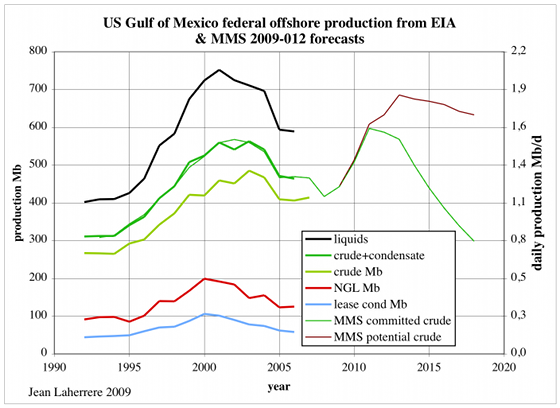 |
A new peak is forecast for oil around 2012.
MMS forecasts a natural gas decline for the next 10 years from industry committed projects.
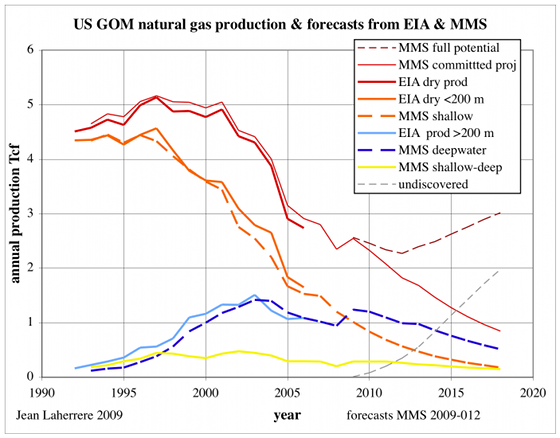 |
A possible increase can take place if a large undiscovered volume comes about, but the creaming curve (see below) does not look too good, with only one dominant discovery cycle trend (except for a recent deep gas cycle).
Reserves
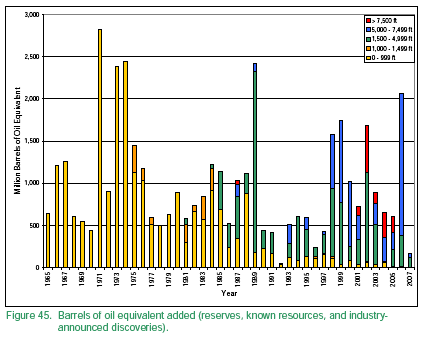
In MMS2008-013, MMS reports the annual discovery in Mboe from 1965 to 2006 with a breakdown by water depths (<1000 ft in yellow) in Fig. 41, but also in Fig. 45, which includes industry data. For 2006 there are only deepwater discoveries, with 1.5 Gboe reported in Fig. 41 and over 2 Gboe in Fig. 45; for 2007 discovery looks quite poor (wait for next year's reporting!).
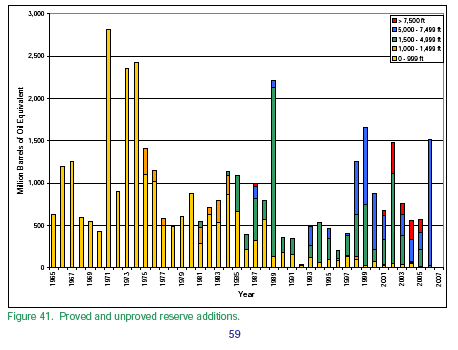 |
Fig. 44 of the same report shows that deepwater discoveries peaked in 2001 in number, but in 2006 in volume.
 |
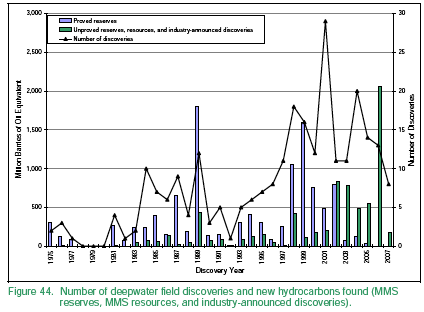 |
But in MMS2009-012, Fig. 22 is different for the last 10 years, in particular 2003.
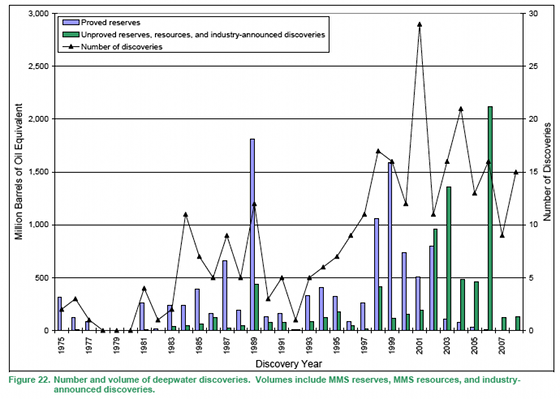 |
The complete file of field reserves at the end of 2005 in MMS 2009-022 shows a complete historical plot. The deepwater (>1000ft) plot shows also a peak in 1989 and 1999, but the number for 2001 is 13 against 29 fields from the previous graph, and for 1989 6 fields against 12 ! MMS2009-022 seems restricted to fields and not discoveries.
 |
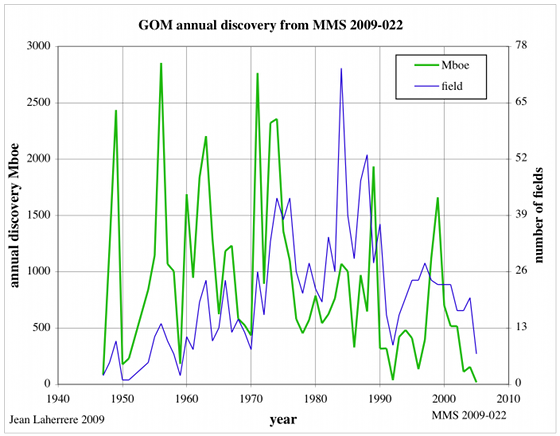
For the whole GOM and from MMS2009-022, the peak in number of discoveries is in 1984 (73) and the volume in 1956 (2,8 Gboe).
 |
Deepwater discoveries
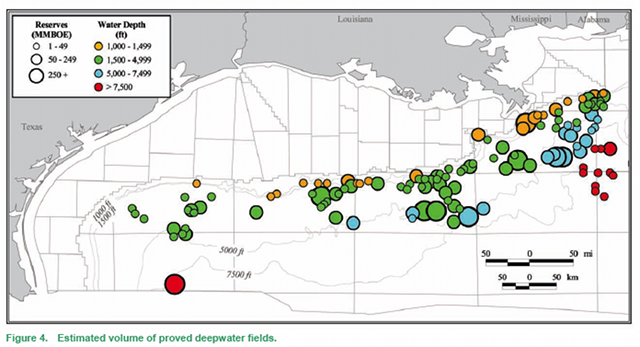
Geographically, deepwater (>1000 ft) discoveries are reported in MMS2009-12 mainly around the Mississippi delta.
 |
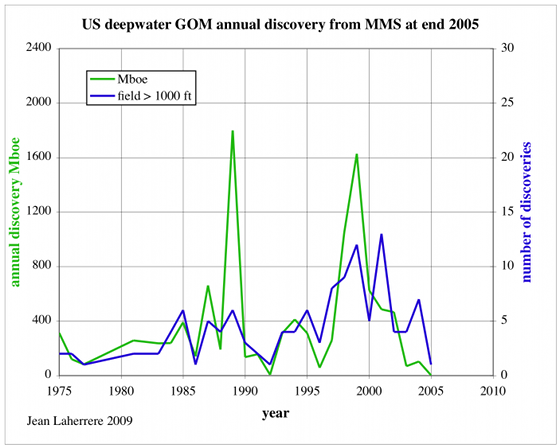
Frontier scout data reports only discoveries for water depths beyond 400 m; they are compared to MMS at end of 2005:
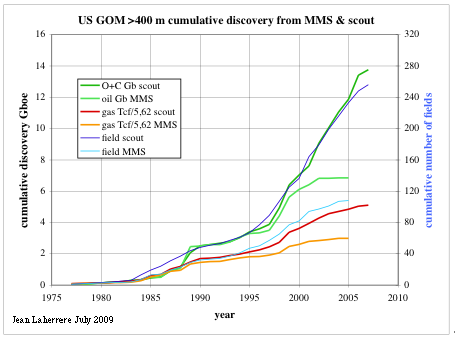 |
It is obvious that MMS2009-022 reports only fields and not discoveries and is incomplete for recent years. It is a pity because MMS GOM field data is the most complete database in the world, together with the UK's and Norway's files, and should be the base of studies to apply to the rest of the world.
However, the synthesis from this data leads to the following forecasts.
US GOM oil and gas reserves at end 2005 (MMS 2009-022)
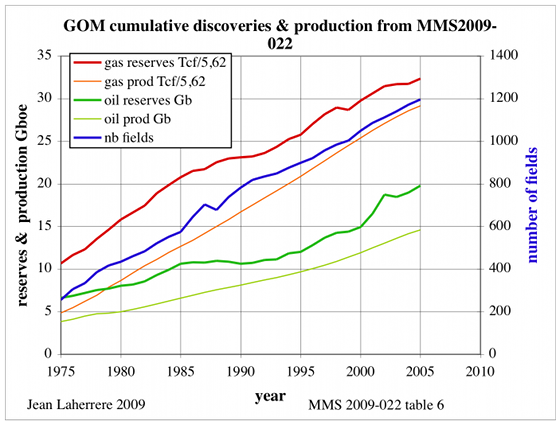
Cumulative production increases in line with cumulative discovery both for oil and gas.
 |
Ultimates can be estimated looking at the fractal distribution or at the creaming curve.
Fractal display
The fractal display (cumulative discovery versus size rank in a log-log scale) is obviously parabolic when corrected and a parabola can be taken as a model of what is in the ground. MMS field data ranks as largest field MC 807, but in fact it gathers two fields: Mars (1989) and Ursa (1990), operated by the same operator; despite that, in other reports they report them separately. The corrected display with a plot every 10 years shows that contrary to most fractal displays, if the largest fields (the largest Mars was found in 1989 , the second Thunder Horse was found in 1999) are found first, there are still large fields to be found.
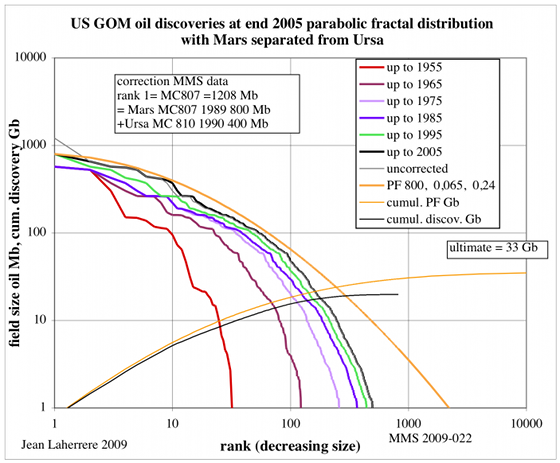 |
Using the parabolic model an ultimate of 33 Gb can be estimated.
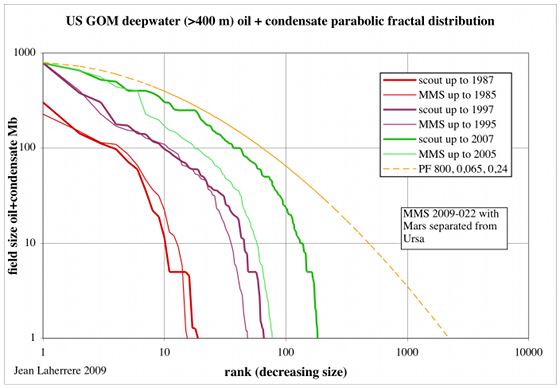
The comparison of the fractal display for water depths over 400 m between MMS at end of 2005 and the scout data at end 2007 shows a similar plot. The parabola used for MMS full GOM is a fair model for the scout data for a depth > 400m, because the largest fields are in deepwater.
 |
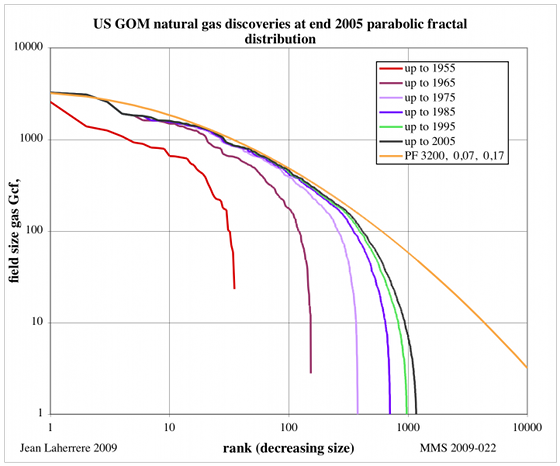
MMS gas field reserves at the end of 2005 are plotted as a fractal display and the display is more like the usual ones with large fields found first (before 1985) with recently found fields mainly small ones.
 |
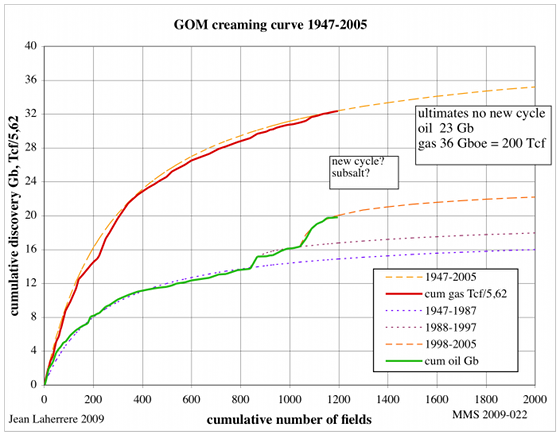
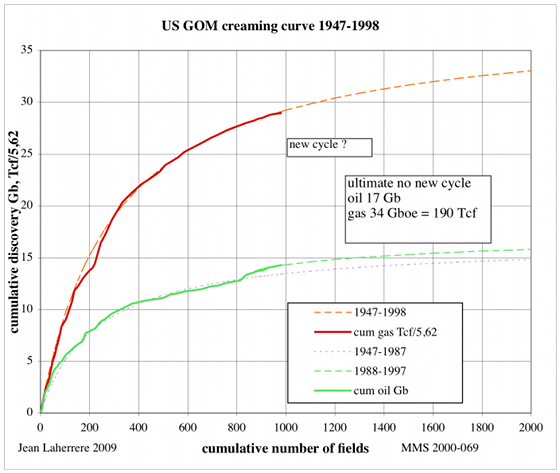
Creaming curve
The creaming curve is a graph that plots the cumulative discovery versus the cumulative number of New Field Wildcats (or of fields when NFW are not available). It is the best tool to estimate ultimates, but the field reserves must be the mean values (or 2P) and not the proven values (1P) used by MMS to follow the obsolete SEC rules (in 2010 SEC will allow reporting of 2P, meaning that the past reporting was wrong, leading to artificial reserve growth).
The creaming curve for 1947-2005 is easily modelled for natural gas with one cycle for an ultimate of 36 Gboe or 200 Tcf. I do not know enough about deep gas geology to foresee a new cycle for deep gas!
For oil, three cycles are needed, leading to a possible fourth cycle (subsalt?). Minimum oil ultimate is estimated at 23 Gb.
 |
The creaming curve plotted at end of 1998 was extrapolated for an ultimate of 190 Tcf for gas and only 17 Gb for oil (the large deepest water fields were not yet drilled).
 |
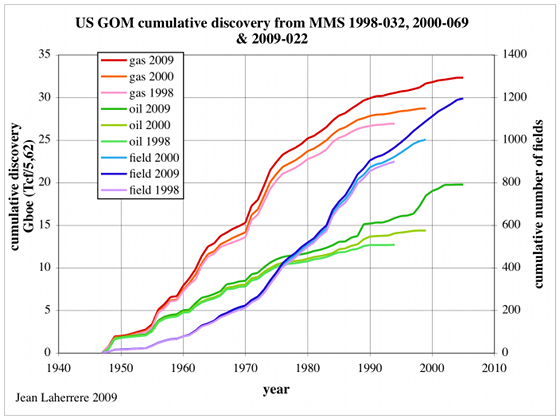
But a comparison of the MMS1998-032, MMS2000-069 and MM 2009-022 shows that obviously the past data were incomplete, when plotting the cumulative number of fields (in blue). The growth in Gboe was mainly due to incomplete data (as found when comparing with scout data), but also due to reserve growth because of the practice to report proven estimates instead of 2P figures.
 |
Conclusions
The GOM field database is one of the best ones to study the evolution of discoveries and to estimate ultimates, but unfortunately the data is incomplete (missing fields and discoveries) and reserves estimates are only proven (because of the obsolete SEC rules) and not the reliable proved + probable values used in the rest of the world outside the US. But in the future with the new SEC rules allowing the reporting of 2P, it will be interesting to see the evolution of reported GOM reserves in 2011 or 2012!
Personnel
Editors
Contributors
Peak Oil Primers
Archives
- November 2010 (3)
- October 2010 (6)
- September 2010 (4)
- August 2010 (7)
- July 2010 (6)
- June 2010 (7)
- May 2010 (2)
- April 2010 (8)
- March 2010 (4)
- February 2010 (6)
- January 2010 (3)
- December 2009 (5)
- November 2009 (8)
- October 2009 (12)
- September 2009 (6)
- August 2009 (5)
- July 2009 (11)
- June 2009 (8)
- May 2009 (16)
- April 2009 (10)
- March 2009 (7)
- February 2009 (10)
- January 2009 (15)
- December 2008 (9)
- November 2008 (9)
- October 2008 (9)
- September 2008 (13)
- August 2008 (10)
- July 2008 (14)
- June 2008 (23)
- May 2008 (16)
- April 2008 (12)
- March 2008 (16)
- February 2008 (9)
- January 2008 (13)
- December 2007 (13)
- November 2007 (16)
- October 2007 (22)
- September 2007 (8)
- August 2007 (9)
- July 2007 (16)
- June 2007 (8)
- May 2007 (7)
- April 2007 (7)
- March 2007 (10)
- February 2007 (10)
- January 2007 (12)
- December 2006 (9)
- November 2006 (15)
- October 2006 (4)
- September 2006 (5)
- August 2006 (5)
- July 2006 (9)
- June 2006 (5)
- May 2006 (10)
- April 2006 (9)
- March 2006 (13)
Vital Trivia
License

This work is licensed under a Creative Commons Attribution-Share Alike 3.0 United States License.
Jean and Luis,
Thanks for a thorough detailed post on the Gulf of Mexico!
It's good that Jean's creaming curve estimate for the GoM oil ultimate is 23 Gb. Does this include the eastern part of GoM in which drilling is currently not allowed?
Here is the latest GoM forecast based on oil ultimate of 23 Gb and updated for recent GoM production data from the EIA. This forecast includes both state and federal GoM.
http://tonto.eia.doe.gov/dnav/pet/pet_crd_crpdn_adc_mbblpd_m.htm
I've allowed some interruption for hurricanes.
Here is an HL plot indicating 23 Gb.
Due to little oil being discovered in the GoM recently, remaining proved reserves have fallen by just over 20% from 2003 to 2007 for the most significant part of the GoM shown in the chart below.
http://tonto.eia.doe.gov/dnav/pet/hist/rcrr01r1901f_1a.htm
The Texas offshore portion of GoM has some proven reserves left but only 0.144 Gb in 2007, down from 0.423 Gb in 2000.
http://tonto.eia.doe.gov/dnav/pet/hist/rcrr01r44f_1a.htm
Although GoM proved reserves have been falling according to the EIA, the EIA forecasts that GoM production will increase over the next two years from the latest EIA STEO.
http://tonto.eia.doe.gov/cfapps/STEO_Query/steotables.cfm?tableNumber=9&...
Hello Jean, Luis, Tony [Ace], et al,
Thxs again for the much-admired data-freak work!
When one ponders Ace's historical GoM hurricane & future forecast:
1. The hurricane induced downward glitches are remarkable for their size, depth, frequency, and duration, which cumulatively add to the overall -3.5%/yr decline rate by their sheer destructiveness and the necessity for early shutdown and evacuation of offshore workers.
2. Even if the latest and greatest tech & safety measures are incorporated into future deepwater rigs, FSPOs, pipelines, etc--nobody wants to be a hero and try to work through a CAT 1-5. Thus, the infrastructure might ride out the huge waves and winds just fine, but it will still be idle during these storms [which adds to the total cost of GoM oil & natgas extraction].
3. The weak link seems to be the Power Grid in the onshore GoM as the hi-tension power towers and other electrical equipment get blown down or disabled with great regularity when the hurricane comes ashore. So having the offshore rigs safe doesn't help much until the Grid is sufficiently restored to electrojuice the on-shore refineries and other critical equipment.
4. Compare 1,2,3 above with offshore MidEast [ME] or even Brazil. What a the chances of a hurricane [cyclone] threading the Strait of Hormuz, then continuing on up through the ME offshore infrastructure? IMO, practically nothing. The Ins. Cos. and bean-counters must consider the ME very weather-safe as compared to the GoM, and probably charge the GoM companies much more.
This 1,2,3,4 probably forces the GoM operators to get the FFs out quick compared to a more leisurely ME extraction, if the ME so desired.
IF Florida & Cuba eventually open up to drilling, since the prevailing winds and pressure systems tend to make many hurricanes 'hook right' in the GoM: the future production downward 'glitches' may become even more frequent as more offshore equipment gets dispersed across the entire GoM. As a prior weblink had noted in another thread: let's hope no major crude leak happens in Florida or Cuba whereby the Gulf Stream carries the crude to both E & W FL beaches.
In conclusion: I was glad to see Ace's 'little' forecasted 2009 hurricane glitch [although mostly hidden by the white box with 2007 Dean text]. But I was hoping his forecasted smooth decline line would have a bunch of hypothetical hurricane glitches out to 2030 as this seems highly probable.
Bob Shaw in Phx,Az Are Humans Smarter than Yeast?
Some more thoughts: notice the hurricane glitches never sent production down to ZERO. As we proceed downslope: won't future GoM glitches hit ZERO & MOL every more frequently, thus forcing the glitch duration [width] to vastly increase? Now add in WT's ELM to the GoM equation: wouldn't that make the glitch recovery even more delayed,thus adding even more extra width to each hurricane glitch?
For example: assume we hit Zero from a big Cat 5. We can't get things in the GoM even minimally restarted until we pull from the SPR or other finished fuel reserve unaffected by the 'Cane. Since this will take some time--it adds time to the glitch width back to some later recovery point. But a lot of companies could go broke while they wait for FFs and electrojuice [plus workers] to restart their operations.
Sorry, I don't have the expertise to thrash this concept out further. But maybe some other TODers can numerically flog this dog?
A minimal Cat 5 hurricane has a windspeed of over 135 kts which is about twice the speed of a Cat 1 and has aproximately 8 times the destructive force because the power of the wind increases as the cube of the wind speed. Since I live in South Florida less than two miles from the beach I've hunkered down through Cat 2s and 3s. I know first hand the results, it ain't pretty. To suggest that a rig can take a direct hit from a Cat 5 and come through unscathed is what I would call being unduly optimistic...
BTW I've read some where on NOAA's website that there was some talk of upping the ante by adding a Cat 6 to the Saffir-Simpson Scale due to the possibility of more intense hurricanes in the future.
Hopefully the rigs of the future will be designed to handle 30 ft waves and 200 kt winds. As for the ones out there now, good luck with them.
Hello FMagyar,
Thxs for your reply. Yep, perhaps I was unduly optimistic--I can still recall the photo of the Thunderhorse platform badly hammered and listing heavily...A platform able to withstand a CAT 6 might be impossible to engineer.
Maybe not. Though the EROEI for the oil recovered by such a rig would probably be more negative than the actual impact of a Cat 6 ;-)
After hurricane Dennis, Thunderhorse was listing due to a fault in the construction causing some of the ballast tanks to overfill when evacuation procedures were followed; this was not a direct consequence of hurricane winds or waves.
Shell's Auger platform logged sustained 125 mph (Cat 3) winds before the anemometer blew out when the eye of Ike passed by. It was back online within weeks. These platforms are designed for cat 5 survival. "Typoon, a small spar, and many older shelf platforms, however didn't make it through 2005.
My question, which is slightly off point, is: to what extent is accelerated production occurring also in order to get an adequate IRR on these fields that are so capital intensive?
I ask because I'm curious (ok, maybe even a little obsessed) about how such factors might adversely skew the world production curve. It would also seem to be a factor that accentuates boom and bust cycles.
Ace
I noticed your decline rate is 3.5% Could you explain why you chose that rate?
I know everyone from large agencies (IEA) to individuals here at TOD choose different rates for different reasons.
thanks
Someone should write an article titled:
The Rise and Fall of decline rates
It's actually a huge issue. After URR and decline rates, what else is there? (said with tongue in cheek)
We do have empirical data but even that varies widely. The IEA says 9%, but maybe 6.5% with good technology and field management, and wether the field is old or young, small or large, onshore or offshore
I remember Euan Mearns saying "the tea leaves say 5%"
Westtexas points to the lower 48 and North Sea and I think comes up with 4.8% as an aggregate.
I heard that Slumberger says 8% is their rule of thumb
and what is an undulating plateau but a decline rate in disguise?
Polytropos,
The 3.5% annual decline rate is an observed decline rate from the 2002 peak to now, noting that the 3.5% is only a rough estimate due to the production volatility caused mainly by hurricanes. The annual decline rate used going forward is 7.9% which is roughly equal to the current extraction rate, assuming remaining recoverable oil of 6.5 Gb. The change from 3.5% to 7.9% may occur in early 2011 as planned capacity additions decrease sharply in 2011.
Assuming US GoM of 23 Gb and using historical GoM production data from the EIA, the following extraction rate history is shown below.
http://tonto.eia.doe.gov/dnav/pet/pet_crd_crpdn_adc_mbblpd_m.htm
The most recent data month is Jan 2009 and shows a record annual extraction rate of 8.2%. This high extraction rate may be caused from high production ramp up at new large projects such as Thunder Horse. However, it might be partly caused by low oil prices forcing some operators to temporarily increase extraction rates to generate more revenue. It appears that a more reasonable annual extraction rate should be about 7% which implies that the Jan 2009 GoM production rate should be about 1.25 mbd rather than the EIA's actual 1.45 mbd.
The hurricane risk and the financial need to quickly recover the large investments for deepwater production force the oil companies to extract oil at very high initial rates. In March 2008, the IEA discussed non OPEC decline rates and found that US offshore average annual decline rates for mature fields were almost 20%. In addition, the IEA stated that "newer fields in these areas - often deepwater, smaller accumulations of oil - are also prone to rapid build to plateau, followed quickly by sharp decline."
http://omrpublic.iea.org/omrarchive/11mar08sup.pdf
For simplicity, I used a constant 7.9% annual decline rate for forecasting the production rate. In reality, the future annual decline rates will oscillate. In 2008 and 2009 there have been large capacity additions of about 0.5 mbd from Blind Faith, Neptune, Thunder Horse, Shenzi and Tahiti. This should keep the decline rate low. In 2010 there is another addition of 0.2 mbd from Perdido Hub, Chinook, Cascade and Phoenix. However, there are few planned additions from 2011 to 2014 which probably means that the annual decline rates will be greater than 8% starting in early 2011.
http://en.wikipedia.org/wiki/Oil_megaprojects
The IEA's 2009 Medium Term Oil Market Report, to be released by the end of this month, will probably give an update on offshore decline rates.
http://omrpublic.iea.org/mtomr_june09.htm
I learned quite a few years ago that one does not need to read French to appreciate one of Jean Laherrere older articles published in French journals. The beautiful graphs are often sufficient by themselves.
Posters may be interested in the new Microsoft search engine Bing. Here is a search for Laherrere. One can also limit the search to images, videos and news.
http://www.bing.com/search?q=laherrere&go=&form=QBLH
Interesting report.
The technological sophistication of the oil companies in discovery and extraction is really quite amazing but the projections seem small and don't support a massive expansion(Drill,drill,drill).
Without a giant strike, will modest returns payback for all the technology and miles of special pipe?
(Is deepwater a $25 per barrel surcharge?, no wonder deepwater is moving to bigger sites like Brazil, Angola)
EIA gives GOM production currently ~.5 Gb oil/yr and ~3 Tcf/yr of gas
so GOM should be producing for many decades to come but current production of both are falling(hurricanes?).
As I remember the report gives projected reserves of 19 Gb oil and 181 Tcf of gas.
I think I read somewhere that ALL deepwater was only 60 Gb oil?
This post gives 23 Gb oil and 200 Tcf gas based on creaming curves. Does this support using creaming curves?
In 2001, Jean Laherrere discussed deepwater (>300 m) production and assumed two scenarios for oil ultimates of 80 Gb and 100 Gb. About 50 Gb had already been found up to year 2000.
http://www.greatchange.org/ov-laherrere,sep_28_01.pdf
There was also this discussion about deepwater oil in a semi annual report from FPA Capital Fund in 2007.
http://www.fpafunds.com/downloads/capital/September%2030,%202007.pdf
It was stated that deepwater (>400 m) proved and probably (similar to ultimate) was 78 Gb according to data from Bank of America. In addition, it was also stated that deepwater production is expected to double from 4 mbd in 2006 to over 8 mbd by 2011 according to estimates from Bank of America and Wood Mackenzie.
In his April 2007 newsletter, Colin Campbell discussed deepwater (>500 m) with an estimated oil ultimate of 80 Gb including some 65 Gb already found up to end 2006.
http://www.energiekrise.de/e/aspo_news/aspo/newsletter076.pdf
Campbell's chart from April 2007 predicted deepwater production reaching 12.4 mbd in 2011. However, Campbell has revised this peak down to 8.6 mbd in October 2008. My estimate is that an extended 7.0 mbd peak plateau is probable as many deepwater projects have been delayed due to low oil prices and the credit crisis.
Brazil is a significant deepwater producer but appears to be having problems increasing production as all offshore production (crude and NGL) seems to have stabilised at about 1.8 mbd. The chart below shows that Brazil's production has reached a plateau for March through May 2009.
http://www2.petrobras.com.br/ri/ing/DestaquesOperacionais/ExploracaoProd...
As most of Brazil's 2009 projects have already started, Brazil's crude and condensate production will probably be below 2 mbd for 2009 on an annualised basis.
http://en.wikipedia.org/wiki/Oil_megaprojects_(2009)
The IEA shows a small amount of growth for Brazil crude oil later in the year.
http://omrpublic.iea.org/omrarchive/14may09sup.pdf
In 2010, Brazil's crude and condensate production might be about 2.2 mbd as there is over 0.4 mbd capacity additions of which about 0.2 mbd will be needed to offset declining production from existing fields.
http://en.wikipedia.org/wiki/Oil_megaprojects_(2010)
In my mind whats important is not the rise of deepwater production but the end of shallow water production.
Exploiting offshore fields made up for the bulk of new production from the 1970's onwards generally with these fields brought online reasonably close in time. I believe up to 40% of the worlds oil is from shallow offshore fields. If the shallow GOM is gone then we can suspect that most of the worlds offshore production outside of deepwater plays is also in very bad shape.
I don't think globally deepwater production tops 1 million barrels a day certainly its less than 2 million.
It very expensive and often late. Its not going to help a 30 million barrel a day problem from shallow water production much less land production issues.
Good point memmel. Even folks in the oil patch that aren't involved in the GOM tend to be surprised when they see the decline of the shelf plays and how the Deep Water has contributed so much to the appearance of some stability in OCS production. The decline in shelf would have been even steeper had it not been for the rise in relatively small operators. Not like the "mom & pop" operators onshore but small compared to the big established independents or majors. Since 1990 or so many new small GOM operators have come into existence solely to fill the gap left by big guys who found the shelf play a quickly diminishing return. Given the general decline of exploration opportunities both onshore and in the GOM the only course for growth by these startups was the acquisition and redevelopment of offshore properties. And we did work them to death. Often projects were approved not because of the potential for a satisfactory rate of return but to just push the stock up. The biz plan was simple: drill and establish new reserves (real or imaginary) or die.
The only remaining potential (not counting the off limit areas) on the GOM shelf is very deep (20,000’+) NG. Folks have been trying to find such a trend for at least the last 10 years with very little progress seen. Even NG has its limit on how hot it can survive.
The real shock for the public will be the rapid decline in the GOM in the next 10 years or so. The rapid expansion of Deep Water rates has hidden the shelf decline. But you know how much quicker those rates decline compared to the old shallow water fields. I doubt DW operating expenses will allow the industry to beat out the last little bit of reserves as has been done onshore and on the shelf. The rapid decline rates will hit the high fixed operating expense wall very hard. As you know I am a proponent of expanding OCS drilling operations as long it’s done soundly. But I also believe that such an expansion may only act as another short term buffer for the national decline rate. But even if that works it won’t do much good if it’s taken as a sign that we can continue BAU.
I agree with Rockman and memmel. The DW reserves depend very much on a high price to be available (because they have low EROI). Those reserves may or may not be real. In some sense, one needs to calculate reserves at various price levels. The shallow water reserves are mostly gone, and these were more at a low price level.
Oil companies have to show something on their books. They are booking reserves that are illusory, unless there is a high price of oil. If the world's financial situation is such that we really can't support high priced oil, these reserves will simply disappear, and production drop off much more quickly than expected.
In a way, GOM reserves show the limitations of using past techniques to forecast future production, when the "world" is changing, so that reserves become less and less representative of actual future production.
I just don't understand this line of reasoning. If we need the oil, and it has a positive EROI, why wouldn't it eventually be produced?
I understand that a slowing economy puts downward pressure on oil prices because of demand destruction. Therefore more expensive oil shuts in and only easier oil is produced. But eventually that easy oil will be gone, driving the price back up, no?
In my mind, EROI matters for production, price not so much (over the long haul). Maybe we can't afford to use high-priced oil the way we have used cheap oil, but I'm pretty sure we'll find some use for something so valuable. In absence of complete and total collapse, I can't see useable oil not being used.
Well there are two problem net energy i.e EROEI and absolute volume.
You can go to a lower EROEI resource as long as you can say double the volume to keep the net the same.
Say twice as much of a 5:1 resource as you had of a 10:1 resource.
However when you have declining EROEI and declining overall volume i.e absolute declines things get sticky fast.
Not to mention export land model hitting you from the other side even as your own production declines.
So what we face is a lot lower production rate and a lot lower net energy and declining imports.
And probably rapidly increasing decline rates.
Have a nice day :)
In some ways, I don't think we really know how close were are to the minimum EROI that will keep society going. We may already be very close. It seems to me that It is really the financial markets that show us where we are. If demand cannot stay high enough at a price of say $80 for very long, it seems to me that may be telling us that oil which cannot be profitably produced for less than $80 has too low an EROI to meet society's needs as they stand now.
Perhaps if we get to more of a subsistence level economy, we can spend more of our income on oil. Then it might be that in this example, demand will be able to stay high enough at $80 (in this example), but not at $90 a barrel.
Again with demand you have to treat it as a continuous curve demand for fuel for the military is probably the least likely to change followed say by usage in the food industries then say the medical industries then for work on up to picking the kids up at soccer and going for a summer drive.
Some of this demand produces useful goods some does not. Its better to consider it as what kind of demand can be met with what volume of oil. Obviously if oil is scarce the summer drive demand declines etc. Also absolute contraction of the economy i.e more people unemployed causes demand decline.
This is simply supply vs demand and has little to do with price directly. However obviously price is what causes the summer drive demand to decline. I.e there is a certain price which causes decline in certain types of demand.
In my opinion the concept of a price thats "too high" for demand simply does not make sense. At a certain price point certain types of demand are reduced depending on how easy it is to reduce the demand.
Thats not to say that in certain conditions certain types of demand may be large enough that when they decline they could decline fast enough that a surplus develops and prices fall. I've argued for some time that a lot of the recent demand collapse was coming from the collapsing housing industry not from other source. VMT tends to stall its increase in every recession in concert with slowing construction. This makes sense given a large amount of both people and materials are moved to build houses and commercial buildings. And generally this demand stays suppressed for some time. The other probably source was a pull back in summer or holiday driving. Holiday driving seems to make up about a 3% difference in US demand between summer and winter and Housing demand seems to represent and additional 3%. However housing demand is weighted to truck traffic and thus distillate use. Thus its say 3% of overall demand but say 6% or more of distillate demand. Something like that the point is one is weighted towards distillate use and one towards gasoline use.
However after the housing industry has drawn down its hard to foresee another industry that can collapse rapidly and cause supply and demand to result in and excess of supply. Its pretty much a one shot situation.
We may find another case where past a certain price point a certain type of demand collapses rapidly leading to a surplus. But the collapse itself would also have to be of a form that made recovery of that type of demand slow.
I.e once the price dropped did not matter that source of demand was stopped from growing for other reasons.
We will see but treating demand as some sort of well defined entity that has a fixed price point is probably not the right way to look at it.
It seems to me that there is quite a bit of potential for deep (20,000'+) gas on the Texas shelf, but no one is looking seriously.
The problem is that both the risks and the costs are high, and at current gas prices the rewards are too low. The risks are high because even the best seismic data gives ambiguous discrimination between gas and water at these depths, because the geology is largely unknown, and because high pressures and temperatures make drilling difficult. The costs are high because high quality wide-angle non-exclusive 3D seismic data is not available over much of the shelf area (therefore you have to shoot your own), and because drilling to over 20,000 feet is just expensive, even if it is in shallow water. I've known a 20,000 foot well to take over a year to drill, and another three months to complete.
This could (with prices high enough) produce a new cycle for the creaming curve, but I can't see it adding more than 10-20TCF to the ultimate.
It seems like deep gas would be expensive gas. If it made sense to drill deep gas for $4 mcf, I expect there would be a lot of it being drilled. But if drilling costs are relatively high, and shale gas is cheaper than deep gas, it seems like deep gas will stay in the ground for a long time.
A handful of ultradeep GOM shelf wells have now been drilled; some hype from certain quarters, but no plans to develop yet. The gas is probably there, but the costs (>$200mm/well), over a year to drill a well, inability to conventionally evaluate or complete at high temps and pressures in addition to likelihood of very tight reservoir make this play extremely challenging when compared to onshore shale gas. Wide azimuth seismic ain't the issue, many structures are well-imaged and you're not going to see DHI's at those depths. Someday...
Hello Memmel, WHT, Sam, and other TOD math gurus:
I avidly read your postings about the shock model, dispersive discovery, and other tech-arcana, but I don't often comment on the postings of you gents as I don't have the math & statistical 'chops' required. So what follows may be entirely useless, OR it might help move the discussion forward. :)
I was musing on the theory of how EOR tends to move the Peak: up in volume plus earlier in time, as per your discussion a few days ago in Rembrandt's monthly update thread. Memmel seems to logically argue that we are headed into a severe 'shark fin decline' as exemplified by his agreement with the heavy bottom red line in the earlier graph:
http://www.theoildrum.com/node/5489/511573
Ok, here goes, and I hope I can explain this in adequate detail to jumpstart synaptic wildfires in your math-minds:
When an deepwater undersea quake first happens [think '04 Boxing Day], the resulting Peak dynamics of the later land-falling tsunami [tidal wave] are totally fixed at that point in time by the Laws of Physics [Let's say an avg 10 ft tall wave breaking on land sometime later]. The long wavelength of the incoming wave is harmless in deepwater, only when the wavelength starts to contract in shallow water is it dangerous as it start to rise up in height as it comes ashore.
This is tantamount to discovering a new oilfield or all the present oilfields in summation over time, but keeping the applied extraction tech 'Exactly the Same Level' until the field or all fields are finally abandoned. So linear extrapolation of oilfield production seems logical.
Obviously, we now know that tech-extraction advances are applied to oil & natgas fields ASAP when the tech becomes available and economically viable--thus the 'simplified' Tsunami Model becomes invalid regarding Peakoil. Is there a better, non-linear model?
How about the 'Rogue Wave Theory' applied to the one-time occurring Hubbert Peakoil Tsunami Tidal Wave and EOR-extraction tech?
http://en.wikipedia.org/wiki/Rogue_wave_(oceanography)
----------------------
Rogue waves (also known as freak waves, monster waves, killer waves, and extreme waves) are relatively large and spontaneous ocean surface waves that are a threat even to large ships and ocean liners...
----------------------
Doesn't this link to the Drauper Wave look just like the classic, long timeline, but giant single-pulse Peakoil Spike? Compare the two links below:
http://philhart.com/images/peak%20oil/hydrocarbon_age.gif
http://en.wikipedia.org/wiki/File:Drauper_freak_wave.png
From the above Rogue_Wave Wiki:
---------------------------------
..Such waves were said to consist of an almost vertical wall of water preceded by a trough so deep that it was referred to as a "hole in the sea"..
..Nonlinear effects — It seems possible to have a rogue wave occur by natural, nonlinear processes from a random background of smaller waves.[6] In such a case, it is hypothesised, an unusual, unstable wave type may form which 'sucks' energy from other waves, growing to a near-vertical monster itself, before becoming too unstable and collapsing shortly after. One simple model for this is a wave equation known as the nonlinear Schrödinger equation (NLS), in which a normal and perfectly accountable (by the standard linear model) wave begins to 'soak' energy from the waves immediately fore and aft, reducing them to minor ripples compared to other waves...
------------------------------
So even the earliest tech advances [even way back to Drake's oilfield?] only helped to grow the Hubbert Spike and our present-day EOR mini-waves are also energetically 'soaked up' into this one-time for us humans Rogue Hubbert Spike.
http://en.wikipedia.org/wiki/Nonlinear_Schr%C3%B6dinger_equation
-------------------------
..For water waves, the nonlinear Schrödinger equation describes the evolution of the envelope of modulated wave groups. In a paper in 1968, Vladimir E. Zakharov describes the Hamiltonian structure of water waves. In the same paper Zakharov shows, that for slowly-modulated wave groups, the wave amplitude satisfies the nonlinear Schrödinger equation, approximately. The value of the nonlinearity parameter к depends on the relative water depth. For deep water, with the water depth large compared to the wave length of the water waves, к is negative and envelope solitons may occur...
---------------------------
http://en.wikipedia.org/wiki/Soliton
-----------------------
In mathematics and physics, a soliton is a self-reinforcing solitary wave (a wave packet or pulse) that maintains its shape while it travels at constant speed. Solitons are caused by a cancellation of nonlinear and dispersive effects in the medium. "Dispersive effects" refer to dispersion relations between the frequency and the speed of the waves.
----------------------
What we need are equations, not for a soliton, but for a 'Hubbertiton' [my invented name to honor M. King Hubbert] that constantly self-reinforces and GROWS it shape ever taller and steeper from applied EOR; as ever increasing backloaded EOR helps ramp the Peak plus moves it time-forward so it subsequently will decline fast.
Of course, at this time I am hopelessly lost in math application... but maybe the following speculative example might help you math-wizards visualize my thought process:
Again, picture the Boxer Tsunami occurring, setting off the initial wave with wavelength 10X. But now, as the original deepwater rogue-wave moves toward the beach: imagine a series of additional earthquakes happening as the wave passes overhead-- each additional [EOR]quake adds to the TOTAL Hubbertiton deepwater wavelength...10X + .01X [vertical wells] + .5X [waterdrive injection] + 1X [nitrogen injection] + 2X [millions of nodding horseheads] + 5X [MRC horizontals]... + 1X [fracing fluids] + .05 [Tarsands] + .01 other EOR,etc.
Then when the only Hubbert Peakoil rogue wave hits the beach==>it is now a towering Tsunami 10 times as high as the [original oilfields]Boxing Day tsunami; a 100ft Hubbert Spike that quickly declines like the Drauper Wave above or the 'Red Line' like in Memmel's linked graphic.
This is due, IMO, in direct opposition to what occurs in a soliton [the Cancellation Effect]. Because there is NO cancellation of nonlinear and dispersive effects in the oil extraction industry or medium--it is actually an 'Amplification Effect' in a Hubbertiton. "Dispersive effects" refer to dispersion relations between the frequency and the speed of the waves, but in this case freq. & speed of the EOR-waves SUM into the ROGUE total.
Hope you guys find this helpful. Please feel free to elaborate further or flame away in scientific refutation.
Bob Shaw in Phx,Az Are Humans Smarter than Yeast?
If you guys plus Jean too, can advance my brief concept: it would seem to help scientifically and statistically validate Jay Hanson's fast-crash Thermo/Gene Collision, Maximum Power Principle [MPP], and Duncan's latest Olduvai. How you go about doing this task seems quite daunting unless you can program a large software program to crunch the numbers...
I don't have the math or physics chops to dive (no pun intended) into this question either, however I think I understand enough about the basic physics of wave theory to grasp that constructive interference may indeed create a gigantic rouge wave out in the ocean somewhere. This being a real physical phenomena.
However, while your analogy is intriguing, I can't quite grasp how you intend to equate a shark fin decline depicted on a graph, granted it is depicting real physical phenomena as well, with the physics of forces acting on water molecules.
Perhaps your analogy has flown over my head? Feel free to slap me down and put me in my place but aren't you comparing apples and oranges here?
Hello FMagyar,
Consider Nate Hagens' writing on MPP which basically says: "I want it All, and I want it Now!"--then extend that to global FF-extraction.
Finding an oilfield is like the unleashing of the deepsea earthquake, but the contribution to the later, total Global Peak tsunami is unforeseen at that time. According to Rogue Wave Theory [as I feebly understand it], the subsequent global EOR exploits does not necessarily mean 'smaller tsunamis' unleashed later [a series of time-sequenced solitons], but a tendency to time-condense into a Hubbertiton that GROWS and time-shifts forward==> a sharp & steep peak [shark-fin] versus a less tall, but gentle roller curve of the same volume.
From the Wiki:
----------------------
The spatio-temporal focusing seen in the NLS equation can also occur when the nonlinearity is removed. In this case, focusing is primarily due to different waves coming into phase, rather than any energy transfer processes...
----------------------
I would argue global society is Thermo/Gene evolved to 'focus' on getting it now as per Nat Hagen's writings. If we had fully grasped Hubbert, Malthus, Erlich's 'Population Bomb', Club of Rome's "LTG", and Carter's Sweater Speech way back then: the Hubbert Spike would have been more like a gentle roller hitting the postPeak beach.
My understanding is that rogue waves can't be explained by constructive interference, nor can they be explained by classical hydrodynamics. I guess the way you look at it is that it is a non-linearity in some of the equations (think of it like a power-series expansion in some of the equations - the first order term dominates, and gives you classical waves, but under certain conditions the higher order terms in the expansion come into play). That's the take I got on it by watching some program on TV about rogue waves..
Anyhow, that's a diversion. In a sense we are all struggling trying to find a good analogy that the general public can easily understand. Given that it is only an analogy, the specifics of how it all works isn't quite as important how it really works, but it is important that the general public have some idea what the heck you are talking about.
An analogy that I was thinking of is to say that oil is like steroids on the economy, but I don't really know if that gets us any closer to anything useful either.
In the end, I am not sure how much it matters. Those who don't want to hear the message will deny that the analogy is applicable.
I stand corrected though I did say I didn't have the math or physiscs chops to really dive into this.
Though I should know from real life experience of many years out on the ocean that real waves out there rarely if ever behave in a simple linear fashion. The ocean is turbulent.
Though in the analogy department I think this might make it clear, or not...
http://www.sydesjokes.com/pictures/s/shit_hits_the_fan.jpg
For those wanting to know more about Freak or Rogue Waves, a 5-part series from the BBC on Youtube [part 1 below]:
http://www.youtube.com/watch?v=o8ZstKoyc9I&feature=related
-------------------
Freak Wave (1 of 5) 9:55
-------------------
The other segments can be found in the right sidebar.
Here is another example that is based on pure probability considerations. Laherrere plots fits to his creaming curves using something be calls "hyperbolic" functions. These aren't precisely a form of a hyperbolic curve that I am familiar with, but take on the form y=x/(1+x) or U=U0*k*N/(1+k*N). Check on the fit below that I applied using affine scaling (blue line).

This line can be linearized as I have shown previously if you plot the data as 1/y = 1/x + 1. Perhaps this is why Laherrere calls it hyperbolic, in that there is a reciprocal relationship between the ordinates (I would think hyperbolic would be reciprocal in only one of the ordinates, i.e. y= 1/x + 1, but whatever). In any case, there is a very simple derivation to this curve assuming linear dispersive growth of discoveries. The exponentially accelerating form gives the classical Logistic form for cumulative growth over a large region.
Just like HL, if we plot the reciprocal of cumulative reserves against the reciprocal number of wildcats, you can perhaps make some estimates of the ultimate for a region. The y-intercept of the linearized curve can give you the ultimate:
I describe this more fully here:
http://mobjectivist.blogspot.com/2008/10/significant-no-hyperbole.html
Nothing very complicated about this except for the jumps that we see in the reserve growth curves. These are simply the result of limited statistics on the data set. Yet I claim that we can understand and perhaps accommodate the statistics if we start modeling the growth according to non-heuristic analysis of exactly what is going on. The basis of all this is the application of dispersive growth in search space.
Just like trying to understand something like "rogue waves" via probability we can understand oil reserves with probability. It's just that I am not interested in rogue waves at the moment, I am interested in oil reserve modeling. As Christopher Walken said:
Let's get to work :)
If you want to take this approach then maybe the difference between my argument and others might be clearer.
To go with the wave concept correct a new field is in a sense like and earthquake starting a wave.
What I'm suggesting however is that via technology we are in essence able to create new earthquakes as the old wave peters out we induce a new quake that effectively creates a new wave superimposed on the old wave.
Reserve additions from technology replace the previous estimates its not additive.
Just like a double quake does not add two waves together but superimposes or replaces the oil wave which is not simple addition. In our case the new quake was much smaller and its really a small tidal wave on top of the vestiges of and old tidal wave not the one big wave people claim they are seeing.
On way to look at it is to think of a very large long wavelength wave with many small shocks creating wavelets of higher frequency on top. They might even double the height of the overall wave but obviously they die out faster than the big wave.
You can see how intuitively this tends to be shock like. You start the big wave quite early in time but then you repeatedly force it but all this does is cause smaller waves to run up the back side rising the crest but as your thinking making the wave more shark fin like.
Effectively exactly the same thing happens as the wave approaches shallow water the water in the front acts as a dynamic dam causing the water behind to pile up. For oil its probably clearer to think of wavelets generated on to of a long baseline wave. Basically same result but I hope clearer.
The amount of water is fixed there is no more or less. In a sense these shocklets are stealing water from the front by forcing it to dam up as if it hit shallow water.
And of course for oil the front of the wave is actually the backside production i.e its running in reverse the wave is actually pulling oil from its backside production not pushing.
I think whats important with this sort of thinking is its a simple physical model and it clear that your dealing with a superposition not simple addition since the waves vary in frequency.
http://physics.tamuk.edu/~suson/html/4323/super.html
Effectively I'm arguing a huge mistake has been made because people have incorrectly assumed a single wave of a certain frequency its fundamentally incorrect to treat oil production in this manner.
Its a superposition of several waves with different frequencies and intensities.
A very interesting result is this also invalidates the central limit theorem as applying since it violates the requirement that the parts are independent.
http://en.wikipedia.org/wiki/Central_limit_theorem
They are not independent nor random indeed the smaller waves are created in response to the big wave starting to crest. We went after more marginal oil supplies because the easy stuff was declining. The system is tightly coupled and the central limit theorem is simply not valid.
Good thoughts. Most of the explanation comes about from "fat tail" probabilities. Occasional freak waves come simply from the small probabilities of multiple sequential occurrences (multiplicative and not additive).
The reservoir sizes come about from a simple model of aggregation during their formation. The rates of diffusion follow a model of maximum entropy and they give a characteristic shape. I call this "dispersive aggregation". A limit of maximum size occurs really due to the constraints of the system:

The connected blue dots in the chart above about assumes a maximum size of 3000 and a characteristic size of 50. I eyeballed that and pasted it on the first try using the affine scaling laws of the model. I am not sure how the Parabolic Fractal Model gets derived. It seems to be some sort of heuristic.
I'd like to see more studies done on this issue of return on investment. A few of you touched on it in your responses to this article when comparing the relative costs of shallow water well to OCS production, but I think it would be very informative, as well as serve to reinforce the conservationist agenda, if we could break out an actual ROI in terms of the approximate cost of a barrel of petroleum produced by given production costs.
For example, I once heard that the expenses and energy inputs required to process tar sands essentially guarantee a $70 barrel of oil bottom, barring some new process that doesn't require so much natural gas input. Or the difficulty in refining heavy Orinoco crude increases the cost of the final product and so makes that barrel of the sulphur-laden crude more expensive because of the additional inputs required to process it into usable products.
It would also be helpful to do a cost-per-barrel equivalent for other methods of obtaining transportation fuels, such as Shell's gas-to-liquids process or coal-to-liquids processes. I see a lot of data on the relative carbon dioxide emissions, so there must be some prior analysis done on these processes vis-a-vis the required energy inputs.
My point is that I think those of us who spend otherwise peaceful waking hours worrying about fossil fuel depletion could really help deflect a lot of the arguments that suitable replacements will be found if we assign an economic value to the declining ROI of various processes. We all know it's harder to get OCS reserves, or arctic reserves, or convert gaseous and solid fuels to liquid ones, but are there any studies that illustrate just how much we'd have to pay for a barrel of each of the above? I imagine such a study would be of immense value to policy-makers and Peak Oil wonks.
An additional thought: I imagine the toughest part would be stripping away the effects of commodity speculation on the price of a barrel, therefore we should consider the cost per barrel?