| The 'Peak' Summit: An Informal ASPO & Oil Drum Gathering | The Oil Drum: Europe | Oilwatch Monthly April 2009 |
Article Review: Depletion and the Future Availability of Petroleum Resources
Posted by Rembrandt on April 15, 2009 - 9:57am in The Oil Drum: Europe
In the last edition of the Energy Journal of the International Association of Energy Economists an article was published that concluded that the recent high oil price spike was just an aberration, as there is plenty of low cost oil out there waiting to be produced. This claim was made by a group of scientists from the Catholic University of Chili and Colorado School of mines, R. Aguilera, R. Eggert, C. Gustavo Lagos and J. Tilton. In this post I critically review this study showing that many important factors have not been taken into account by Aguilera et al. (2009), making it highly probable that their conclusion is incorrect.
Abstract of Aguilera et al. (2009) "This study assesses the threat that depletion poses to the availability of petroleum resources. It does so by estimating cumulative availability curves for conventional petroleum (oil, gas, and natural gas liquids) and for three unconventional sources of liquids (heavy oil, oil sands, and oil shale). The analysis extends the important study conducted by the U.S. Geological Survey (2000) on this topic by taking account of (1) conventional petroleum resources from provinces not assessed by the Survey or other organizations, (2) future reserve growth, (3) unconventional sources of liquids, and (4) production costs. The results indicate that large quantities of conventional and unconventional petroleum resources are available and can be produced at costs substantially below current market prices of around US$120 per barrel. These findings suggest that petroleum resources are likely to last far longer than many are now predicting and that depletion need not drive market prices above the relatively high levels prevailing over the past several years.(Aguilera et al. 2009, page 141)"
Expected oil discoveries in Aguilera et al. (2009)
In the year 2000 the United States Geological Survey conducted a study in which expected discoveries and reserve growth have been analyzed. In this study 102 out of the total 937 geological provinces on the planet were assessed. This selection was made on the basis of historic oil discoveries in these provinces or because it is likely that they contain oil. The conclusion made by USGS (2000) was that potentially 939 billion barrels of oil could be discovered between 1996 and 2025 and an estimated 730 billion barrels added to reserves through reserve growth. This study has been extensively discussed at The Oil Drum in four earlier posts of mine (1,2,3,4)
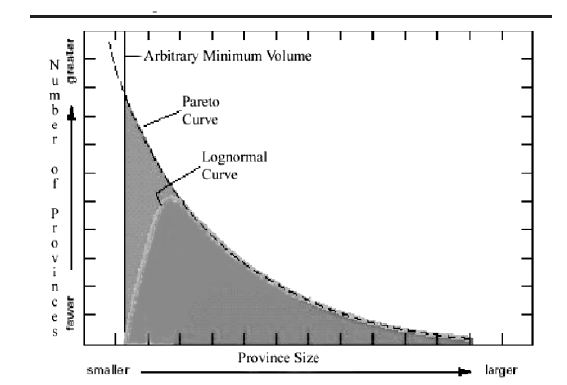
In Aguilera et al. (2009) a model has been made to estimate the oil yet to be discovered in the 835 geological provinces not assessed by the USGS (2000). This was done by looking at the relationship between the cumulative number of oil provinces and the volumes contained in these provinces. The rationale in this case is that the big oil provinces are found first and oil province size declines by time as exploration continues. The authors assume that many smaller oil provinces are out there and that they oil in these provinces can be produced at low costs, as explained later in this post. To calculate the size of these provinces a new distribution called variable form was used. This distribution lies in between the Pareto distribution and the Lognormal distribution of province size versus number of provinces which are both shown in figure 1 below.
The variable form distribution has been selected based on the following reasoning:
"Previous size distribution models used to estimate the volumes of energy resources have assumed that the relationship between a given volume size and the number of areas that contain or exceed that volume follows either the log-normal or the Pareto distributions. The earliest efforts used the log-normal distribution (Kaufman, 1962). Subsequently, however, researchers at the USGS (Drew, 1997) observed that the lognormal distribution provides overly pessimistic results, and concluded that the Pareto distribution was superior. The difference between the two distributions can be seen in Figure 7, where they are shown as density distributions. While it is now generally acknowledged that the lognormal distribution underestimates petroleum resources, for various reasons the Pareto distribution may overestimate them. Historically, all the methods used to forecast petroleum volumes have been “based on an assumed form of the size-frequency distribution of the natural population of oil and gas accumulations” (Barton, 1995). The Variable Shape Distribution (VSD) model is different in that it allows the data to determine the size distribution relationship rather than specifying this relationship ex ante (Aguilera et al. 2009, pp. 161)."
The methodology employed, which led to an estimated 593 billion barrels to be found in the 835 provinces not assessed by the USGS, is explained as follows:
"Specifically, we start by observing the curvature given by the USGS (2000) data points on a log-log plot. We then estimate the VSD model whose predicted values for the relationship between size and number of petroleum provinces mostly closely match the actual data. As with all size distribution models, the original sample used to estimate the parameters contains most of the largest and promising data. This allows one to estimate the slope and intercepts, on log-log coordinates, of the straight line given by the largest data (these parameters remain constant during the forecasting stage). The previously unassessed data will then generally contain smaller volumes than the assessed (Aguilera et al. 2009, p.162)."
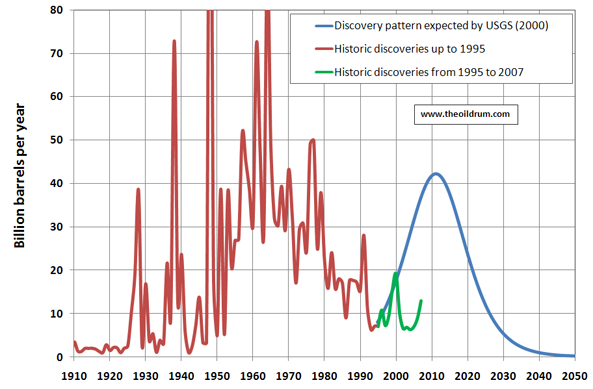
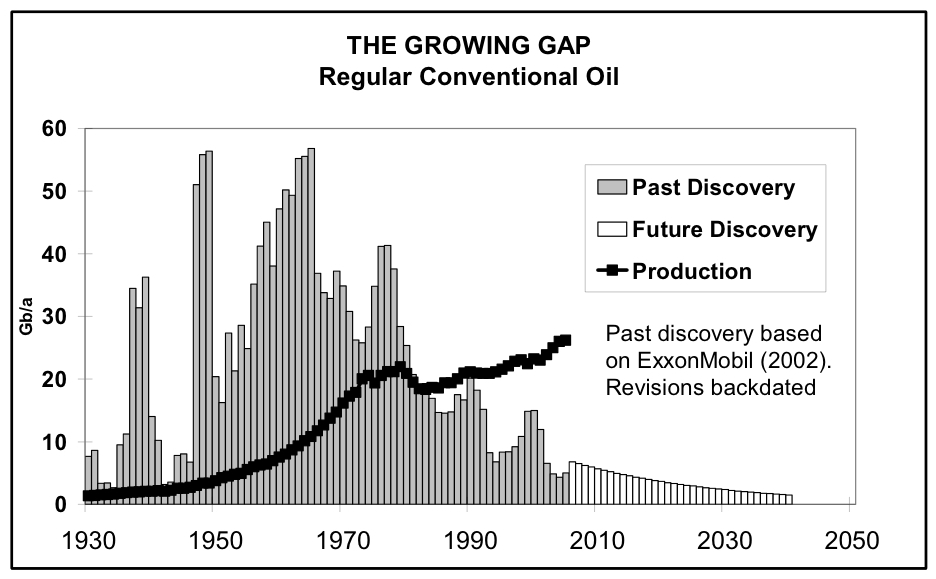
The first assumption made by Aguilera et al. (2009) is the decision to take the USGS (2000) estimate at face value, by using it as input for the calculation of future discoveries in the 835 geological provinces. That is, they assume that the 939 billion barrels for potential oil discoveries between 1996 and 2025 in the 102 geological provinces is correct. In my opinion, USGS (2000) discovery estimates are too optimistic as it would imply a radical change from the 4 decades of declining discovery cycles since the 1960s, shown in figure 2 below.
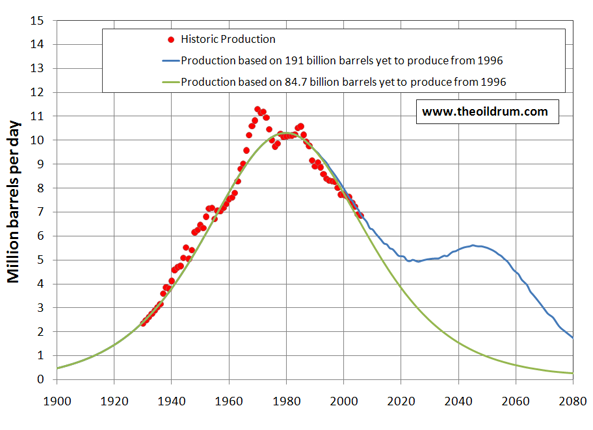
An example of the production implications of the discovery estimate by USGS (2000) is made here for the United States. According to the USGS (2000), a total potential of 83 billion barrels of conventional oil plus natural gas liquids could be found between 1996 and 2025 in the US. In addition it was expected that technological innovation could lead to reserve growth of 76 billion barrels. If this is add up to US reserves of 32 billion barrels at the time, a number taken from the IHS Energy (formerly Petroconsultants) raw input data used in the USGS 2000 study, this would yield a total of 191 billion yet to be produced from 1 January 1996. Based on this number a production scenario has been constructed shown in blue in figure 3 below. The scenario implies that US oil production, which has been declining since the 1970s, will stabilize around 2020 and slightly increase from there on until 2045 after which a new phase of decline sets in.
Next to the USGS (2000) figures I have prepared a Hubbert Linearisation analysis based on production data from 1974 to 1996. This yields an estimated yet to be produced amount from 1 January 1996 of 84.7 billion barrels. Based on this number I have made a Hubbert based production scenario shown in figure 3 as the green curve. If one compares these scenarios, I think it is much more probable that the production decline in the US will continue as per the green curve, since the US is one of the most mature oil regions in the world, with respect to both exploration and production.
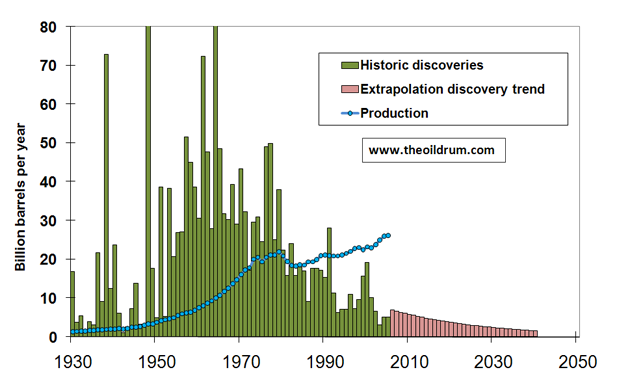
Instead of taking the USGS (2000) assumption for oil discovery, it would be better to assume that the historic discovery pattern will continue as most of the big fields have already been found, and only some smaller cats are remaining. If we extrapolate the declining discovery trend and calculate the future amount, this results in another 250 billion barrels yet to be discovered in the future. This estimate is shown in figure 4 along side the historic data.
The second assumption made by Aguilera et al. (2009) is that the estimated volumes in the remaining provinces will be producible. This view can be contested as these areas lie in remote regions and the expected fields will on average be quite small. The costs of producing these oil fields is hence not favorable and perhaps prohibitive.
Expected reserve growth in Aguilera et al. (2009)
This issue will only be covered here briefly. For a more detailed coverage on reserve growth I refer to my earlier posts on this topic (1,2,3).
Aguilera et al. (2009) attempted to estimate reserve growth based on the percentage increase of reserve growth between 1996 and 2025 as estimated by USGS (2000). This was calculated by taking the USGS estimate of reserve growth and dividing it by the sum of historic production and reserves as per 1 January 1996. This percentage, 42.97%, was taken and multiplied by: 1) the historic discovery data of 939 billion barrels of yet to be discovered in the 102 geological provinces asessed, 2) The 939 billion barrels of remaining world reserves as per 1 January 1996 from the USGS (2000), 3) the estimated 593 billion to be found in the 835 geological provinces assessed in Aguilera et al. (2009). By doing this procedure, a total number for future reserve growth of 1070 billion barrels was estimated.
Again, similar to the discovery estimate, the assumption was made that that USGS (2000) had made a good estimate of reserve growth, which could be taken at face value. The issue of reserve growth is so complicated, however, and the errors in making these estimates so large, that the USGS estimate cannot be relied upon. I have outlined many of the problems in my earlier posts (1,2,3). Besides the general problems of estimating reserve growth, Aguilera et al. (2009) have made a wrong assumption in thinking that the USGS (2000) did not incorporate a reserve growth function in their estimate for potential discoveries in the 102 geological provinces. The USGS (2000) states:
"Growth functions were applied for two different types of analyses (1) to aid in estimating grown sizes of undiscovered fields and (2) to determine the contribution of reserve growth of existing fields to world resources (USGS 2000, DS‐8)."
Hence Aguilera et al. (2009) double count reserve growth of the 939 billion barrels discovery estimate made by the USGS (2000) in making this assumption.
Calculating economic costs of producing the technical recoverable estimate for conventional oil
After estimating a total of 1532 (939 + 539) billion barrels as yet to be discovered oil and 1070 billion barrels for reserve growth, as per 1 January 1996, Aguilera et al. (2009) proceed to estimate the costs of production. Total costs were estimated based on historical capital costs and operating costs from one to a couple of years for as many geological provinces as possible. Data came from a dozen sources including Bloomberg, Center for Global Energy Studies, and Goldman Sachs. These figures have been averaged by province over the number of produced barrels in case of operating costs and over the total amount recoverable in the case of investment costs. As a unit of analysis the inflation corrected value of a dollar in 2006 was taken. The calculation thus uses a static view of costs of one to a number of years which is extrapolated into the future, assuming that no fundamental cost increases or reductions will take place. "Our estimates of production costs are static, and therefore do not take into account the tendency of technological advancement and other factors to reduce costs over time. Nor do they take account of cost increases (Aguilera et al. 2009, p.150‐151)."
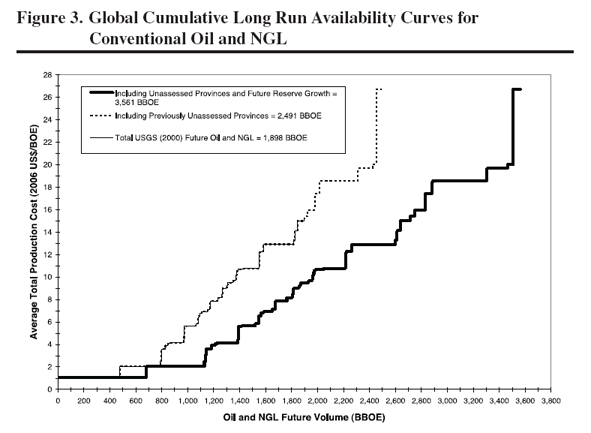
To estimate the production costs of oil in the 835 geological provinces for which no data is available, as no oil has been found in these regions so far, Aguilera et al. (2009) have used a formula in which the production costs are estimated based on the costs in the region in which these provinces lie such as Europe, Middle-East, and North Africa. However, a further assumption was needed as the yet to be found estimate by Aguilera et al. (2009) only yields the aggregate over the 835 provinces, and not the regional distribution. Therefore it was assumed that the yet to be discovered number of 539 billion barrels, plus the 254.8 billion barrels of estimated reserve growth in these provinces, will be similarly distributed over Europe, Middle East and so forth as the percentual distribution of the known amount of oil in these regions. "While the model provides future volumes for all 937 provinces, it does not indicate which volumes correspond to which provinces. As Table 4 shows, we have allocated the future volumes from previously unassessed USGS provinces, for both oil and NGL and for gas, among the eight regions of the world on the basis of each region’s share of the future volumes in the assessed provinces. This is consistent with the idea that regions with high amounts of future volumes in previously assessed provinces will have unassessed provinces with generally proportional amounts of future volumes (Aguilera et al. 2009, p. 148‐149)." After this calculation, production costs have been calculated by taking the highest costs in the region and multiplying this figure by 1 plus the total expected amount of yet to be found crude oil from Aguilera et al. (2009) divided by the estimated number of oil in this region by the USGS (2000).
The rationale here is that the average production costs in the areas estimated by Aguilera et al. (2009) will be higher than in the already known areas, as high quality crude oil with low production costs will be produced first and lower quality oil later. "This procedure presumes that within a region the average production costs for all the unassessed provinces are higher than those for all the assessed provinces including the assessed province with the highest costs. This is consistent with the notion that the highest quality, least costly resources are usually extracted first. The procedure also presumes that the difference between the production costs for the unassessed provinces and the highest cost assessed province increases as the volumes for unassessed provinces rise relative to assessed provinces (Aguilera et al. 2009, p. 167)" These assumptions are logical but it is not clear on what basis the multiplication factor has been chosen. It appears to me when reading the text by Aguilera et al. (2009) that there is no empirical basis whatsoever in selecting the chosen multiplication factor.
The calculation of Aguilera et al. (2009) leads to an average production cost below 20 dollars per barrel for the vast majority of estimated technically recoverable conventional crude oil, as shown in figure 5 below.
The employed methodology solely rests on the assumption that one or a few static points of production costs from the past can be extrapolated to the entire future. The shortcoming lies in the few data points used as well as the assumption of static costs. Costs are likely to change permanently in the future, as cost decreases due to technological innovation have largely played out, and cost increases are going to play a bigger role, because of declining quality of the remaining oil, more remote and politically difficult locations of extraction, and smaller and smaller fields in these locations. Furthermore, it is implausible to expect that cost premiums in areas such as Nigeria and Iraq will dissapear in the near to mid term future as stabilization of these regions are unlikely. The method employed by Aguilera et al. (2009) is hence limited in its scope and does not provide reliable estimates for future production costs.
Also the input figures as used in Aguilera et al. (2009) are not comparable to other sources. The International Energy Agency (IEA) in the World Energy Outlook 2008 incorporated a study of the production costs in the oil industry, obtained through a survey of oil companies. The average production cost for the world for the years 2003 to 2005 was found to be 12 dollars per barrel in 2006 dollars, and 16 dollars per barrel on average between 2004 and 2006. The average cost in Aguilera et al. (2009) worldwide is estimated to be 6 dollars per barrel in 2006 inflation adjusted dollars. The reason for the difference is perhaps found in the methodology used to calculate costs in areas for which no data was available. The authors have for instance derived average production costs in the US of 10.77 dollars per barrel. The offshore production costs in the US, according to the IEA, are much higher at 45 dollars per barrel, an estimate similar to that of the US department of Energy.
Estimates for unconventional oil production by Aguilera et al. (2009)
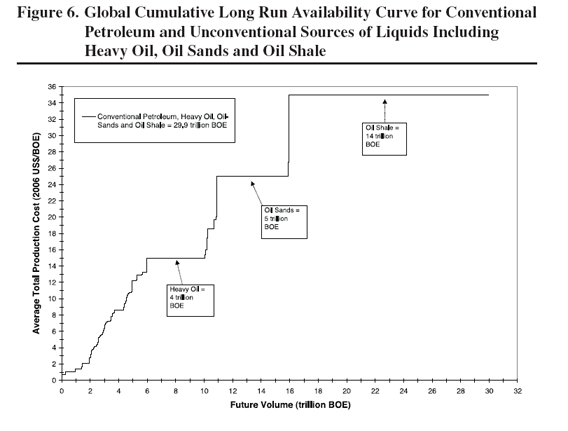
As a last step, an estimate of the total number and production costs of unconventional oil was made, including tar sands, extra heavy oil, and oil shale. A direct comparison was made between conventional and unconventional oil by Aguilera et al. (2009) which leads to comparing apples with pears as the production mechanism for both oil types differs considerably. Unconventional oil is of much lower quality and the production procedure to a large extent resembles mining. A large number of inputs are needed to produce unconventional crude in the form of energy and water which is an important limiting factor to production, not taken into account by Aguilera et al. (2009). Production speed of unconventional oil is much lower as well. In Bengt et al. (2007) it was estimated that the production of tar sands in Canada will be at its maximum around 5 to 6 million barrels per day, as the required amount of natural gas for production can no longer be supplied.
Not incorporating limits to the inputs needed for producing unconventional oil leads to incorrect results. The error introduced will be especially large if an aggregation of estimated numbers of unconventional crude oil on a very broad basis is made, as done by Aguilera et al. (2009). Costs for unconventional oil will not remain stable as assumed by Aguilera et al. (2009) but rise quickly in the mid term future as the limits to required inputs permanently are reached--a situation which could already occur within 10 to 15 years in case of the Canadian tar sands.
Although the limits to the employed methodology for unconventional oil is recognized by Aguilera et al. (2009), they have still chosen to ignore these limits which resulted in the graph shown in figure 6. "In addition, the life expectancies shown in Table 6 implicitly assume that the future volumes for an energy resource represent the fixed stock of that resource available over all time to society. Particularly for heavy oil, oil sands, and oil shale, this is unlikely to be the case. As Tilton (2002) has argued, the fixed stock paradigm for assessing the future availability of resources can be misleading (Aguilera et al. 2009, p. 158)."
Conclusions
The conclusion by Aguilera et al. (2009), 'that large quantities of conventional and unconventional petroleum resources are available and can be produced at costs substantially below current market prices of around US$120 per barrel', is not valid for the following five reasons:
1) The data from USGS (2000) of the yet to be found estimate in 102 geological provinces has been used to estimate the future potential in 835 geological provinces which were not assessed in USGS (2000), resulting in an additional 539 billion barrels of expected discoveries by Aguilera et al. (2009) in addition to the 939 billion barrels estimated by the USGS (2000). The original USGS (2000) is too optimistic as it implies that the declining discovery curve which has been declining since the 1960s will turn around. This methodology produces an estimate of 539 billion barrels, which is also too optimistic.
2) Aguilera et al. (2009) have double counted reserve growth because they made the incorrect assumption that the USGS (2000) did not apply a reserve growth function for the estimate of yet to be discovered fields.
3) A large number of factors that limit production have not been incorporated, including the availability of water and natural gas which play a large role in the production of unconventional crude oil.
4) A direct comparison between the production of conventional and unconventional oil has been made while production mechanisms for these types of oil differ significantly, leading to a comparison between apples and pears.
5) It is incorrect to take historic production costs from a single to a set of years in a given oil province and extrapolate them into the future to obtain future costs. Costs are likely to change permanently in the future as cost decreases due to technological innovation have largely played out, and cost increases are expected to play a bigger role. These changes are expected because of declining quality of the remaining oil, more remote and politically difficult locations of extraction, and smaller and smaller fields in these locations.
References
Aguilera, R. F., Eggert, R.G., Gustavo Lagos, C.C., Tilton, J.E., 2009, Depletion and the Future Availability of Petroleum Resources, The Energy Journal, Vol. 30, No.1, pp. 141‐174.
Bengt, S., Robelius, F., Aleklett, F., 2007, A crash programme scenario for the Canadian oil sands industry, Energy Policy, No. 35, pp. 1931‐1947.
IEA, 2008, World Energy Outlook 2008, Parijs: IEA Publications.
USGS, 2000, World Petroleum Assessment 2000 [online], Available through http://pubs.usgs.gov/dds/dds‐060/
Article Review: Depletion and the Future Availability of Petroleum Resources
PDF version
90 comments
Article Review: Depletion and the Future Availability of Petroleum Resources
PDF version
90 comments
Personnel
Editors
Contributors
Peak Oil Primers
Archives
- November 2010 (3)
- October 2010 (6)
- September 2010 (4)
- August 2010 (7)
- July 2010 (6)
- June 2010 (7)
- May 2010 (2)
- April 2010 (8)
- March 2010 (4)
- February 2010 (6)
- January 2010 (3)
- December 2009 (5)
- November 2009 (8)
- October 2009 (12)
- September 2009 (6)
- August 2009 (5)
- July 2009 (11)
- June 2009 (8)
- May 2009 (16)
- April 2009 (10)
- March 2009 (7)
- February 2009 (10)
- January 2009 (15)
- December 2008 (9)
- November 2008 (9)
- October 2008 (9)
- September 2008 (13)
- August 2008 (10)
- July 2008 (14)
- June 2008 (23)
- May 2008 (16)
- April 2008 (12)
- March 2008 (16)
- February 2008 (9)
- January 2008 (13)
- December 2007 (13)
- November 2007 (16)
- October 2007 (22)
- September 2007 (8)
- August 2007 (9)
- July 2007 (16)
- June 2007 (8)
- May 2007 (7)
- April 2007 (7)
- March 2007 (10)
- February 2007 (10)
- January 2007 (12)
- December 2006 (9)
- November 2006 (15)
- October 2006 (4)
- September 2006 (5)
- August 2006 (5)
- July 2006 (9)
- June 2006 (5)
- May 2006 (10)
- April 2006 (9)
- March 2006 (13)
Vital Trivia
License

This work is licensed under a Creative Commons Attribution-Share Alike 3.0 United States License.
3) A large number of factors that limit production have not been incorporated, including the availability of water and natural gas which play a large role in the production of unconventional crude oil.
So the boosters still want to affirm the cornucopian view of future oil production, but by now they feel constrained to try to explain how oil production will increase, rather than just assert it as dogma the way they used to.
But in the same report they still stick to the leprechauns-will-provide model for water and NG? That figures.
I always wonder how much even experts are still unaware of how inextricably linked all resource issues are, as opposed to how much it's just disingenuity.
(E.g., in all the hype about oil shale, I still haven't heard a coherent explanation for where all that water is going to come from, in a political context where there's already a domestic and international brawl over every last acre foot of increasingly overallocated water.)
Oil shale will probably never be used as oil on any large scale because the EROEI makes no sense. The obvious use is to burn it in a power plant for electricity as has been done in the past in many places, and not just (but mostly) Estonia.
Given the time it will take to scale a next gen nuclear program, and the vast amounts of oil shale in the US, I see a ramp up in coal and then also oil shale electricity as very likely here in the States.
On the plus side, it might make a good resource for plastics in the future.
Hehehe sometimes it makes me wonder about peer review and "research". Was it perhaps a "debate" comment in The Energy Journal;)
Your Figure 2 is brilliant. Devastating critique. I can only wonder how the authors of the reviewed article reflect upon fossil fuels stored in the Earth system?
Thanks for the review!
I agree completely on Figure 2. It makes their whole study seem ridiculous. How on earth could any reasonable person think that another 800 billion barrels is going to be discovered before 2025? That roughly implies that 45 billion barrels of new discoveries will be made consistently for the next 18 years (including 2008).
On a much smaller note, I do not completely agree with the assessment of Figure 3. I do agree that the blue line based on an additional 191 billion barrels is not likely, but in my opinion the green line forecast is also not likely. I believe it is too conservative. It seems to me that it basically implies that there will be zero reserve growth or new discoveries. I have pretty much made a career of finding oil that companies have left behind (aka. reserve growth) so I have a hard time believing it doesn’t amount to anything.
Thanks for the write up.
Yes. Thanks Rembrandt for a devastating critique (if I can echo Segeltamp's sentiments).
This is the most ridiculous study I have seen yet, and the USGS in particular has long history of these ridiculous studies, starting from the infamous geologist Zapp through the incompetent duo of Attanasi & Root. So this appears to be a bunch of lapdogs who took USGS data w/o any kind of sanity check applied.
The parts that I find really bizarre is their assertion that they make that these provinces have not yet been evaluated, and they have popped up like virgin areas. No way that this could happen in a reality-based universe -- you really have to expect that a continuum of search has occurred throughout the years. No way can these areas remain "bottled-up" for years and then suddenly someone decides to start exploring them. And these guys then make the assertion that a cornucopia of oil awaits? Do they really believe that the USGS knows how much exploration that private companies have done on these areas prior to their analysis? And do they think corporations will necessarily release this data?
The other part is their analysis based on reservoir sizes. The problem with reservoir size distributions is that there is no "top" so-to-speak for an effective URR solely based on aggregating sizes. How many reservoirs are they actually going to find? This has to factor into a sum total based on volumetric considerations. Showing reservoir sizes is a strawman as far as I can tell.
If that article ever appeared on TOD directly, it would get ripped to shreds. As someone else said, so much for quality peer review.
I'm sorry I don't have time to read this post in detail, it certainly looks like a careful and considered critique. Unfortunately the conclusion is obvious from the first paragraph, and is a truism in all data analysis
Garbage in, garbage out.
This is a bunch of academics being paid handsomely for reporting what their paymasters want to hear.
Ralph, I agree. The number of comments for this seems low thus far, and I suggest that may be due to the "Duh!" nature of the conclusions. For myself, all I had to know was that the paper under critique relied on USGS numbers.
I hope, however, that people will read and respond to the post simply because the stronger the evidence that can be presented the better the chance PO "activists" can affect the future.
Cheers
colorado school of mines was at one time a top notch petroleum engineering school. imo,during the '80's csm became somewhat of a diploma mill handing out degrees to foreign nationals just for showing up.
a "solution" to most any problem can be pulled out of your ...................... um...uh... log log plot.
as an illustration, spe 119897 forecasts gas reserves for one ung well between 4.5 and 246 bcf based largely on agularia's (log-log) type curves.
agularia is no lightweight, but i wonder if any of the funding for this study was provided by exxon, etal.
@elwoodelmore
I think the line of thinking has much to do with the environment one has experience with. If the line of thinking goes intro direction A, it is often difficult to get in touch with thinking that goes into direction B due to the selection of information of the group that one is involved with.
For example you yourself appear to be having difficulties with accepting the line of thinking in the article by Aguilera et a. (2009) given your statement: 'agularia is no lightweight, but i wonder if any of the funding for this study was provided by exxon, etal."
elwoodelmore,
I graduated from CSM in the early 1990's. Although I definitely don't agree with the authors on this study nor do I automatically respect everyone who works or graduated from there, I find your comment that they simply hand out degrees for "showing up" to be contemptible.
I too attended Mines for awhile and find that comment unfair. Students there work very hard. They have to memorize all sorts of shit.
Wow. I think the "memorizing shit" method of learning went out of practice, ohh, about the time they invented reference books, which was way before Mines opened. And I'm not knocking hard work, but my plumber works hard too. But that doesn't make him qualified to write papers about the future of oil discoveries in any way at all, (it does make him qualified to figure out where the sewer line is leaking, or at least at the rate that he is digging, one would think he'll find something eventually.)
Seriously, if you want to defend the school, did they teach critical thinking?
you, jimb and sw, probably should read the post more carefully. c'mon, surely you too know of some who went through the motions clueless. where is your contempt for the undeserving graduates ?
Actually, I have not thought about if for a long time, but I do remember thinking of a person or two who we thought could potentially get someone killed due to a lack of common sense. However, I have a hard time believing that all engineering schools do not have the same issues to some extent. I also remember that these folks still worked pretty hard and had good analytical skills. Aguilera is possibly a good example of this. There is no doubt he has great mathematical and analytical skills and I bet he is a very hard worker, but you have to wonder about common sense when look at Figure 2 above.
That is it exactly, the lack of "common sense". I have also read how many of the senior people lament the fact that since the engineers have started to use canned simulations that they have lost all intuition in to what is actually happening. They just shove the numbers in to the software and use the data, blindly, once it comes out.
Nice point. According to Taleb this was also one of the main reasons of the current financial crisis.
I have been recently reading the text by L.P. Dake called "The Practice of Reservoir Engineering" and it really has some embarrassing passages in it. Dake appears to be a fairly careful math guy, but the way he will blurt out the fact that geologists essentially don't what is going on is pretty startling. He also references the old-timers like T.E.W. Nind who say many of the curves have "no basis in physical laws" is also kind of shocking. It is a pretty fascinating view on an engineering field that I knew was based mainly on heuristics, but to have it spelled out so clearly makes you really wonder what the heck is going on. I just can't imagine reading these kinds of textbooks in my fields of Electrical Engineering and Physics. It would be like reading texts from the 1800's where some charlatan author would discuss the topic of electricity as some sort of flow through a mysterious "ether".
Here is an excerpt from a Dake book:
WTF is this guy talking about? Are these geologists on drugs or something? You just don't speculate in a textbook on sh*t you have no business talking about. What is he bringing up Heisenberg's Uncertainty Principle for? This guy would get laughed out of any ordinary engineering or science classroom if he started rambling like that.
There are bunch more passages like that one which I can excerpt from but that gives you a flavor. So did CSM actually use textbooks like these? I have heard that the books by Dake are considered "classics" in the field.
Dake, L.P., “The Practice of Reservoir Engineering”, Elsevier, 2001
And this was from 2001!
We did not use Dake. We used the textbook "Applied Petroleum Reservoir Engineering" by Craft and Hawkins as well as an SPE monograph on waterflooding by Craig. This is the first time I have ever heard "Chaos Theory" in regard to reservoir engineering, but I am pretty far removed from academia.
yes, craft and hawkins is THE classic, the bible.
and web, i am just curious, what does dake have to say about the subject of volitile oil ?
Dake discusses volatile oil reservoirs in the context of PVT relationships. He says it is more complicated than non-volatile oil.
thanks web. i will see if i can find a copy.
i read some of the reviews on amazon. these reviews must have been written by the marketing dept. nothing of substance just platitudes but they all think it is great!
Here is an image from the book where he talks about Odell's (now failed) prognostications.

He was ridiculing the possibility of $100 oil
@CCPO
Nevertheless I think a website as The Oil Drum should not ignore commenting on articles that outline an entirely different view. Otherwise we would only show content that verifies our position that limits to oil production are here/near. I think this is one of the bigger problems with science that the emphasis lies too much on verification and too little on falsification. Publication mechanisms in journals are too dependent on competition (status improvement), verification (status improvement), and income (wealth improvement).
I think you misunderstood my post. I was supporting your work and encouraging others to engage it for the same reasons you mention.
Or, perhaps you were just reinforcing what I'd written?
Cheers
@ccpo
My comment is a response to the first part of your comment and a reinforcement to the second part.
Agreed that doing the thankless task of "Falsification" is incredibly important.
Moreover, it is also extremely challenging work as you have to get into the mindset of the person who is publishing the ideas. If you think it is hard to figure out a clean, convincing argument, it is often many times more work to evaluate a rambling, incoherent set of assertions. There might be some nuggets of "correctness" in there but it gets obfuscated by so much garbage that you are tempted to just ignore the whole thing.
Rembrandt,
We're going in circles. Let me clarify: I was supporting your post 100%. The Duh! comment means only that the conclusions were obvious from the outset. It is not meant to mean the post is useless or should not have been done. On the contrary, I think it's another weapon in the arsenal and I welcome it.
Cheers
The famous Catholic University of Chile. Wasn't that the University Milton Friedman and his Chicago boys adopted several years before the coupe of Pinochet?
no, Peter, look closer -- the actual quote was:
"... low cost oil out there waiting to be produced. This claim was made by a group of scientists from the Pontifical Catholic University of Chili and Colorado School of mines, R. Aguilera, R. Eggert ..."
Note the spelling. This is the famous training institution for Food Network show hosts, especially those specializing in Southwestern (USA) cuisine.
I hope/trust you've invited (a lack of?) comments from the authors themselves. Otherwise what more needs to be said here by us?
@RobinPC
I have informed the corresponding author of the article, Roberto F. Aguilera, that we have published a review of their journal publication and invited him to write a response post.
:-)
It seems to me that the very questionable reserve estimates put out by governmental groups is as the heart of the problem. Part of the problem is the USGS reserve estimates, which an unknowledgeable researcher might reasonably expect to be reasonable. There are any number of other "bad" estimates around, including the Middle East oil reserve numbers, the EIA forecasts, and the IEA forecasts. It is hard to find an honest estimate anywhere.
If we add to this the nonsense put out by Scientific American, I can understand why someone might get the idea that there will never be a problem. All one has to do is follow in the steps of all of the other optimists making projections.
Five years ago -- or even two -- such a paper might be understood as the natural exuberance of optimistic researchers trying to make sense of a mass of confusing and contradictory data.
Somehow, after all that has been done by The Oil Drum and many others, this sort of thing now has the feel of deliberate dissimulation. If that is true, then one has to wonder who benefits from this wilful distortion? And for that matter, who is harmed? Is anyone likely to go out and buy an SUV now that magical supplies of future petroleum have been promised?
Desperation is in the air.
I'm puzzled as to why we haven't hit on a solid statistical methodology by now, 150 years into the petroleum industry. This paper is presented as an antidote to the USGS's over-optimism; why wasn't this hashed out in the 70s? Take for example this run down of US Lower 48 estimates from Hubbert's 1962 National Academy of Sciences paper (pdf):
These figures are all over the map, with the USGS's own estimates the most wildly overinflated and off the mark. As has been suggested before, is this a tradition of theirs, or a hallmark of the bureaucratic mindset?
There must be some one on the drum that is close enough to the USGS to give us a detailed run through of the methodology that produced the comedy up-tic in discoveries projection. I'd love to know !
@ColdFusion
I covered the discovery part of the USGS (2000) study a while back in this post: http://europe.theoildrum.com/story/2006/11/25/22361/503
The Methodology is not included in there though. I could do a write-up on that in a couple of weeks.
Perhaps this transcript of an interview with Les Magoon gives you an idea.
As far as I understand the USGS work wasn't that bad. They just tried to find out how much oil might be left in the ground and *perhaps* recoverable in the BEST case - without considering costs nor anything. The main problem was that these results were interpreted the wrong way (by the EIA and many others) - not as a theoretical BEST case number but as a feasible, *normal* case number. And that on these numbers the well-known energy outlooks (IEA etc.) were based on.
Good interview. My favorite part:
My emphasis in bold.
Hi Gail,
Thanks, as always.
I haven't read Sci Am in a while. Is there something in particular you're referring to?
Figure 6 has got to be some sort of joke no?
Hang on, no, it isn't April 1st...
Nick.
Figure 6 makes sense if you don't account for the production rate of conventional oil declining. In other words, it's an "all things being equal, this is what we can expect."
But things are not going to remain equal. Conventional oil will decline, which leaves an economic mess in its wake and the whole system is disrupted.
...which I hereby nominate as the understatement of 2009.
I was thrown by the production cost figures too. Cost data is sensitive for companies operating in a competitive market, so production costs aren't easy to come by. It is therefore understandable that an academic researcher might rely on thin data regarding costs. But the study should express a little more caution when asserting 'there is lots of oil to be found at prices below $120/bbl.' If oil sands can make 18% ROI at $30/bbl, why did we see so much retrenchment in Alberta once oil fell below $70/bbl? Do the authors seriously believe the oil sands business is holding out for 40%+ ROI? And shale, well, nevermind.
Figure 6 doesn't pass the smell test.
And we've got to remember that production cost isn't price. Maybe someone has already thrown out some comments on the price of the marginal barrel setting the price of everything? When the KSA was clearing $130/bbl, their prodcution costs were unchanged (basically zero for old, paid for fields) compared to the year before.
If the world "really wants" 80 million bbl/day and the production cost for 60 million is $10/bbl, and $50/bbl for the next 10 million, and $100 for the final 10 million, it is a safe bet that the market price of oil will be closer to "some number larger than 100" than it is to (uhh) $26.25, which is, of course, the "average" production cost.
-dr
Thanks, dr -
This is helpful.
Another group of researchers who need to be introduced to the concept of Energy Return on Energy Invested and Receding Horizons. Costs will rise for these low EROI sources as we are forced to rely more upon them.
EROI is why we are going to see a log normal curve instead of a parato curve. There will be plenty of oil we never extract out of the ground because it would take more energy to do the extracting than the oil would contain.
Hi Jon,
I confess to not having (yet) read all the EROI articles I'd like.
Has someone filled in the steps between the EROI issue and the choice of curve?
If not, this seems like something that might be useful to do - and might help bridge the apparent gap between the EROI-savvy and those who are not.
The Pareto and Log-Normal curves have to do with reservoir sizing. It is kind of confusing but that is what happens when these heuristics are thrown about.
A Pareto curve comes about in reservoir sizes very similar to the way the 80/20 rule comes up in many different statistical studies such as income distributions (i.e. 20% of the population make 90% of the total income). I have written about this and it can be explained by how long it takes these oil reservoirs to aggregate over time and due to the varying dispersion rates of oil migration, you end up getting this asymmetric distribution of reservoir sizes.
I can derive something that looks like something halfway betweem Pareto curve and a Log-Normal curve and I use it to reason about how these reservoir size distributions come about and what you can infer about URR. The "problem" is that I never took geology or petroleum engineering and so can use ideas that haven't been tainted by the conventional wisdom and tribal knowledge that apparently has infected the geology field.
I would love for these authors to show up on TOD sometime so we can politely "rip them a new one". I really don't think they have a clue on what they are talking about.
I think a website as The Oil Drum should not ignore commenting on articles that outline an entirely different view. Otherwise we would only show content that verifies our position that limits to oil production are here/near. I think this is one of the bigger problems with science that the emphasis lies too much on verification and too little on falsification.
This is what I am always looking for on The Oil Drum. I want examination of evidence for and against hypotheses which stem from peak oil. And I want an examination of the evidence for and against alternate views. As I read what has been said her over the 3+ years (when I joined), I see predominately weak arguments by CERA and others. I wait to see strong arguments from them for their own take on the data and against peak oil. Given the incompleteness of the data we have, I want to hear the best arguments from all quarters so that I can be more secure that I am not adhering to a view which is grossly in error.
I share these sentiments. For me, the most powerful argument in favor of limits to this resource lies in Figures 2 & 3 from this review. From 2000-2007, both reserves and production fell in the U.S. when demand and prices steadily grew. An honest analysis of our 'bountiful oil reserves' needs to ask the question: 'why aren't we bringing this to market already?' Otherwise, future oil belongs in the same category as our bountiful wind, solar, biofuels, and so forth. That is to say, bountiful in principle but hard to get at.
If people begin to conclude that oil is as tough as some of these other things, the transition to clean energy looks more plausible.
Besides the graphs and the facts (peak discovery many decades ago, majority of(super)giants in decline), there is that letter from Nate Hagens published on TOD on 1 march 2009 written to a 7 year old boy. No sensible person will write that to a child if not close to 100% sure that there will be a big problem soon.
Hi Steve,
Your paragraph one adds a good point.
WRT your second paragraph -
re: "If people begin to conclude that oil is as tough as some of these other things, the transition to clean energy looks more plausible."
How do you figure?
It seems more likely, given "peak now", there is essentially no transition to anything, absent some radical and widespread change(s).
If it is any consolation, many thousands will see this review of their article, whereas a few hundred (at most) are likely to see the original publication. Thanks for your work Rembrandt.
I thought I saw a reference recently that stated that perhaps 7 people read the average peer-reviewed academic article.
Here it is, by Nate Hagens:
http://europe.theoildrum.com/node/5043#comment-470727
And another is the author's mother.
I don't believe this, at least not in science. First of all, your article will be read by three or four people in the review and publish process alone. Later, students in your field performing a literature review will be obliged to read it whether it's 'famous' or not. Also how the hell do they know how many people have got a journal out of a library to look up the article? It sounds like absolute nonsense to me.
Even it it is true, it's not that surprising, I mean they won't all get read exactly 7 times. Some will be read 1000 times, while some will be read once, just like normal books. There are bestsellers and flops.
Edit: I thought this was obviously nonsense and it does seem to be a myth, at least according to the studies references here
I only complain because this is obviously not true and earlier in the thread you were lambasting the lack of common sense about at the minute.
Yes, that reference of 7 reads applied to citations alone. I have written one "classic" paper in physics that others have turned into research-quality software yet that paper does not have many citations. The number of citations is something that can be exactly determined, see the citation catalog "Current Contents" for example. So I don't doubt the value of 7 at all. The reason it is as high as it is is because the one author will probably cite his earlier papers and therefore build up his citation list rather artificially. I find it bizarre how you expect everything to be found by browsing through library stacks in the hopes of stumbling across something important, if the idea is important it will eventually get cited and then will spread that way.
That's why I tried to add the humorous comment on the author's mother. I guess I needed a smilie as well :)
BTW, do a lot of people realize that is the way Google is effective as it is? Google's citation algorithm which aids in finding useful search terms is very sophisticated.
...whereas the articles at TOD are reviewed by several 10,000s.
"In addition it was expected that technological innovation could lead to reserve growth of 76 billion barrels." --------------------------- I remind again:
What are we doing in exploration now? One commercial discovery in four wildcats, isn’t it? Why does 75% drilling efforts waste?
There is a new technology for oil/gas detection providing above three discoveries in four wildcats. See: http://www.binaryseismoem.weebly.com .
For comparison, here is Campbell's graph of the growing gap:
Here's the same graph modified to include the discovery of the Venezuelan and Canadian heavy oil and tar sands deposits:
The little tiny smudge at the bottom is Campbell's graph of the "Growing Gap", reduced to make the size of the diagram manageable. (The height of that box is 60Gb). The grey line coming up from the middle indicates the discovery of the oil contained in Venezuelan and Canadian tarsands deposits (a total volume of 3,500 Gb). For improved visibility, I made the long grey line about twice as fat as it should be, and arbitrarily set the date of discovery for the tarsands around 1960.
File under: plenty of gold in seawater. My online response to Venezuela announcing their 30 bbo "discovery" of additional Orinoco last year was non-verbal: You can't plot political ramifications on log paper, unfortunately.
How are those oil sands doing, anyway?
Petro-Canada Cuts 200 Jobs From Oil - Sands Unit On Proj Delay. That's 140 kb/d in 2012 that's on the back burner.
Total May Delay 230000 Barrel Oil - Sands Project 100 kb/d for 2014. Wiki says 50 kb/d - Ace, take note.
Nexen, Opti Canada May Be Targeted in Oil - Sands Deals
Global oil , gas projects delayed in 2009
That's 60 kb/d shot for this year. Not a very promising environment for investing.
File under: plenty of gold in seawater.
That would be major misfiling. There are no commercial operations mining gold from seawater. There are dozens of large firms running profitable billion dollar tar/heavy oil operations.
Granted, tar/heavy oil is not exactly equivalent to conventional oil, but it is very obviously not gold in seawater.
How are those oil sands doing, anyway?
Who cares? OECD demand has peaked, so the oil isn't currently needed. Delayed projects can be restarted when necessary. Leaving more oil in the ground for later is hardly a cause for alarm.
The point of the charts is to vividly show the huge volume of oil which is intentionally left out of the discovery graph.
Hi JD,
re: "...profitable billion dollar tar/heavy oil operations."
Is there any truth to something I've heard - that the "subsidies", once accounted for properly, yield a net negative?
@JD
>The point of the charts is to vividly show the huge volume of oil which is intentionally left out of the discovery graph.<
This is not intentional but based on the difference between conventional and unconventional crude oil. We can discuss this further next week when I will publish an article on this matter here.
Hi JD,
Thanks (though I can barely see anything on the screen I'm using).
My question is: What do you think is a fair way to represent the difference in extraction method (between the oil Campbell is counting v. the category of "tarsands" deposits)- and it's corresponding costs?
Does that shorten the line by any amount? If so, by what?
And the water and NG and any other "issues"? How do you figure them in?
Do you think it's accurate to leave them out?
What criteria would you use to answer (my) Q 1?
Water, you say? Green Car Congress: Study: Oil Sands Expansion Coupled with Changing Climate Threaten Athabasca River System
And NG? Canada’s Oil Sands Resources and Its Future Impact on Global Oil Supply | ASPO International | The Association for the Study of Peak Oil and Gas
Of course they're just a bunch of pessimists. And for water you're free to mull over building canals from the Great Lakes etc. Or just become an AGW denier like Hutter.
Sorry about another tiny graphic, Aniya. Full size available at the link.
JB, I don't see any graph (nor with Firefox nor with Opera). Can you check the image file or link?...oops, I should have read the text below.
Fig. 2 has one major problem: there has been little exploratory activity in the areas which the USGS says have the most undiscovered oil, such as Eastern Iraq/Western Iran and Greenland. Lack of discovery means little if no effort is being made.
Here are the top 10 countries for undiscovered oil/NGL according to the USGS (with the undiscovered amount in mmb):
Saudi Arabia: 87093
Russia: 77382
Iran: 53114
Greenland: 47148
Brazil: 46746
Iraq: 45099
Nigeria: 37616
Kazakhstan: 21094
Mexico: 20569
Venezuela: 19664
Here's a chart of exploration by region (from a presentation by Michael Lynch):

Note the low level of activity in the Middle East and FSU. In fact, exploratory activity has been stagnant in all of the above regions (except Brazil) for a variety of well-known reasons.
Hi JD,
Here is where I want Jeffrey to appear and show us how HL changes if one adds the maximum "potential" discovery for each of the regions you name.
No need. You've seen it before. So has JD. The answer is: not much at all. If you add something like, what was it? 50%?, more you get another 5 years before peak. All you really do by adding URR is shift peak a little (in an economic growth scenario) or fatten the tail in a limited, no growth or falling demand scenario.
JD is... um... Rush Limbaugh for Peak Oil: all wind, no storm. He's here pimping the USGS numbers. Who in their right mind would do such a thing?
Cheers
@JD
You are leaving out the US in your data which is number 2 on the list with 83 billion barrels. This is the correct list:
Saudi Arabia: 87
USA: 83
Russia: 77
Iran: 53
Greenland: 47
Brazil: 47
Iraq: 45
Nigeria: 38
Kazakhstan: 21
Mexico: 21
Venezuela: 20
It is correct that not so much drilling has been going on in Iraq as well as Greenland. And 'relatively' little in Saudi Arabia and Iran. However looking at solely the number of wells gives incorrect results, it is also about the geology of the different provinces. Lack of discovery hence could mean that little effort has been made but usually for good reasons.
Exactly. I was under the impression as well that many of these areas go through the process of "virtual" search. In other words, certain areas can safely be excluded from consideration.
I also take issue with the labeling of Fig. 2.
There is no factual basis whatsoever for stating that the blue curve is the "Discovery pattern expected by the USGS". That curve appears nowhere in the USGS study, and in fact, the USGS explicitly stated that they were not making a forecast:
Hi JD,
Thank you for bringing up the issue of accuracy with respect to the attempt to represent graphically a data set and argument. I support the idea (generally) of accurate re-statement.
So, what if the label were changed to read as follows:
"Discovery pattern potential stated by the USGS and converted to a graphic" - ?
Would this help your desire for a fact-based label?
Or, how about, this:
"Graphic of potential discovery pattern stated by the USGS, were it to be actualized?"
Then, to take this line of thinking perhaps a step further, one might list conditions and pre-conditions for this actualization.
Then, one might analyze these conditions in light of an overall actual decline in global production for a particular period under examination (2008 forward, say), and the impact of such a decline on each of the conditions.
I don't think exploratory potential is real in any sense.
I don't see the actual report but CERA's report is based on the 2000 USGS assessment, so I am guessing they say about the same thing.
http://www.cera.com/aspx/cda/public1/news/pressReleases/pressReleaseDeta...
The USGS publishes P50 and P5 estimates for oil/gas. Look a a couple dozen of them and you'll see that P5 is twice P50.
The USGS P50 for petroleum reserves is 1250 Gb. Then they throw in bitumen, XH oil and oil shale at 1740 Gb.
If you notice they have left over EOR at 592 Gb and 'exploration potential' at 783 Gb. Together these equal
1330 Gb which is about the equal of the difference of P5 minus P50.
The exploration potential plus EOR is just due to the range of the various USGS expert estimates and doesn't represent anything concrete, certainly not 'reserve growth'. Saying that the P5 estimate is actually true is different than saying it is statistically impossible. I know the USGS used Monte Carlo simulations for their estimates, and as I remember large Monte Carlo simulations are only a bit better clearer than random numbers in their resulting statistics.
IMO, the exploration potential to be merely a fudge factor.
EOR is a bit less than to cummulative(1073 Gb) plus petroleum reserves(1250 Gb) minus deepwater minus arctic times 30%. 30% is what the DOE says you can recover by EOR.
EOR in the US is 50% thermal and 50% gas. All US EOR is .6 mpd per day. The biggest EOR-nitrogen is Cantarell at 1 mbpd.
The only other big EOR producer is Indonesia at .25 mpd barrels per day. EOR is highly energy intensive.
EOR is presently too small to be a major producer of oil.
Similar with tarsands(1.3 mbpd) and orinoco extra heavy (.6 mpbd). Shale oil in Estonia, China and Brazil is under .05 mbpd at present.
World ethanol is currently at .7 mboepd expected to get to 1 mboepd in 2012.
World CTL is also tiny with the only plant at Sasol producing .1 mbpd.
If it is unlikely that ethanol can ramp up quickly to replace conventional oil then EOR, bitumen, XH oil and oil shale are more unlikely to ramp up.
All unconventional liquid fuel sources end up at less than 5 mbpd. The oil industry is not able to lift its own production by more than 6 mbpd per year, so any increase in unconventional fuels other than ethanol will come at the expense of conventional oil increases.
The expert consensus seems to be 1250 Gb 'oil' with the possibility of other unlike-oil fuels, which is close to Peak oil expectations of 1 trillion barrels.
@JD
Depends on how you interpret that text. If we assume the USGS (2000) assessment is correct those fields of oil are bound to show up some day through exploration. In their study the USGS (2000) specifically used a methodology to assess the potential for discoveries between 1996 and 2025 based on probabilities
Perhaps the following phrase is more to your liking: discovery pattern based on potential discoveries as expected by USGS. To me this is an issue of semantics you bring up here, which I consider as a weak argument although relevant in the context of semantics.
JD, thanks for your helpful comment.
In fact at the source you mentioned the USGS writes:
So we shouldn’t think that the USGS expected the undiscovered resources to be discovered within exactly 30 years.
But this doesn’t really mean salvation. Because although there might be much more time left to find these “theoretical” resources in reality these resources are needed quite soon to meet the world’s demand. So at least when the oil prices were on the steep rise during the last years this should have lead to a considerable amount of discoveries. As we know now, it didn’t.
In fact, a few lines later the USGS continues:
Aguilera sez:
This is secret code for the fact that they use more mumbo-jumbo heurististics. No real reasoning is involved in any of this crap. Plus they get points knocked off their score for using a pretentious phrase like "ex ante".
See the way this works is that they can't just use the word "forecast" or "projection", but instead have to use the phrase "ex ante". They do this because they are cowards, and don't want people to know that they don't have the guts to actually think about what goes into a size distribution. These guys are a-holes, ex post facto :)
WebHubbleTelescope
I will give it a crack at your comments about Dake. Being a practicing petroleum engineer I just happen to have Dake's book to which you are referring.
Well I think we have gone a fair ways from the days of Wild Caters in Texas, where well spacing was on the order of 50 ft. from each other. Heuristics are not the norm.
However in the office the reservoir engineer is STILL nagged by the constant problem of INFORMATION (LACK OF THAT IS !!!). This is not a uniform problem as it does depend on the age of the field, country where you are working, and the oil company you work for. So the method used to attack a problem will depend on the data you have,
In some place like Norway you are probable at the top of the technological pyramid. They collect whatever they can and are using state of the art technology to manage their fields. Now land yourself in the Middle of Siberia and you may see a field being developed using a compass (drawing circles on a map, this has changed over the last 10 yrs. but some old timers still do it). I saw this for myself. Small company and that was all that the "reservoir" engineer (they call themselves "geolog") knew to do.
The "compass method" I would call heuristics. Many wonderful methods have been developed in the area of reservoir engineering but OFTEN we will not have the data in the field to use them. Or should I say we sometimes use them but need to be aware of the assumptions we made since we lacked some data.
So I think this is where Heisenberg “Uncertainty Principle” and Murphy comes in. Take the case of permeability. OK, The best would be to take cores. Expensive as hell and many companies will NOT do it or if they will not often. I could get it from specialized logs IF the company wanted to pay for the tool. Often they will not. OK, next best thing will be to take the logs we do have and use some model to back out the perm from log responses. Great but is not a direct method.
Now we are getting further and further from certainty. We are not working on a body in the operating theater. So when we use this information Murphy's Law could come at you from almost any direction.
Perhaps the method will not work due to mineralogy in the area, wellbore conditions, tool problems, calibration errors on the tool, vintage of the tool etc. So 8 out of 10 times in the area you were OK and the other times you screwed up (great if you know it) and that caused you to propose a well that was drilled right into water leg. Your hung.
So I think this is where Dake is coming with his comments about Reservoir engineering. What we study is 2000-3000 meters under the ground and we have no hope in hell to ever see if what we are talking about is right or wrong.
So I would cut Dake some slack and less for Aguilera. I do not know him personally but know another "expert", Economides. Some personal knowledge of the individual greatly helps to understand their public comments :-)
Well, you seem to be digging the typical geologist into a deeper hole by showing your own ignorance.
Sorry if this offends you or your colleagues but that is not what Heisenberg's Uncertainty Principle (HUP) implies. HUP is actually a very unique description that states that the more effort that you apply to try to measure something, the less accurate your understanding of the position of that something is. A good example is when you try to measure the position of an electron by sending it through a slit and allowing it to hit a phosphorescent screen, you end up with a diffraction pattern. This has "something" to do with uncertainty but not the way you intended. In fact the more effort you put into trying to locate an underground reservoir, the more precise the result. Which is exactly the opposite of HUD. These are big objects not prone to quantum effects and so HUD doesn't apply to these kinds of things. That's why I said that Dake is BS'ing us.
And Murphy's Law is pure hokum, something which is nice as an entertaining quote but not something that you base engineering decisions around. Charles Darwin once said “If Mother Nature can, She will tell you a direct lie”, but that isn't what Darwin's theory of evolution was about. The analogy is that it seems that reservoir engineers are using this flippant quote of Darwin's, instead of actually reading what Darwin had to say in regards to his actual theory.
Yet, with all that you have said, your example of the differences between the Norwegian and the Siberian is precisely what I use in my own analysis. I apply a model that includes dispersion in search efforts to estimate what the rate of global oil discovery is. Google "Dispersive Discovery" on TOD and you can see how it can actually prove the Logistic equation with this approach. The only problem is that it took someone like me with no special education in geology to come up with this identity, and not the practicing geologist or petroleum engineer. Which is exactly what I am trying to imply with my obvious rant -- having textbooks like Dake's around apparently does not help you guys actually use well-known engineering or statistical principles to help evaluate the situation.
And this is why a site like TOD exists. We amateurs contribute because this is the only way we have to set the situation straight. God forbid if it we leave everything up to the typical rock jock to figure out what is going on. (I happen to be reading Basin & Range by John McPhee, and so blame him for that last insult)
BTW thanks for the Siberian vs Norwegian example as I will use that explanation again.
Reservoir Engineering never pretends to be Quantum Physics and I am sure that Dake did not suggest that it should be. If you want to show how much you know about QF try to be a bit more precise about Heisenberg uncertainty principle.
This explains it better
The key being, as you more precisely measure the momentum you will degrade your ability to precisely measure the position and vice versa. Getting BOTH precisely is impossible.
In my business we have a similar problem. You have a finite amount of money to get your data, call it $X. You need to get two parameters perm and porosity in the field. If you use all the $X on perm you will get excellent results but you blow it on porosity, and vice versa. Hence you are left with a CHOICE, how much $$ to spend on what as your choice will effect your accuracy. Dake is not referring to the wave function or String Theory. He is just refering to the choices you make and the consequence of making them.
Your are trying too make a mountain out of a mole hill.
Your comment about Murphy's Law has me a bit confused, and I am trying to be polite. You seem to suggest that it is a Law which is used in practice. I am yet to hear anyone mention it in a report or technical presentation to justify their work. Sorry, this one is way out in left field. Perhaps you have some example?
Keep reading the literature because it does not end with Dake and it shows how little you know of what we do. It is obvious to me that you have no clue what goes on in this industry, in its offices, in the field, in academic circles, in gov. offices when it comes to Petroleum Engineering with a comment like that one. But then generalizations are so easy to make :-)
Depending where you are will effect what you produce and how you produce it. That Is The Real World. In academia they can sit for a year trying to work on something. In gov. they have their parameters of freedom whether they like it or not (USGS) , time not being one of them!! We in the field have our constraints and need to live within them. Majority of petroleum engineers are not concerned with Global Production estimates, they will have a week to come up with a decision on a well and Murphy, Heisenberg will be of no concern to them. They might pull out "CRYSTAL BALL" (you do know this software?) and do some what if scenarios if their bosses will understand it. If not they will adjust to WHAT THE ORGANIZATION WANTS and data will permit. That's just the way it is.
However I strongly doubt "the amateurs" will set the "situation straight". Certain amount of understanding is needed to know WHAT the data REPRESENTS and WHAT YOU CAN DO WITH IT, so I strongly doubt that an amateur will be the one to do know this. He will needed to educate him/her self first and then he/she will no longer be an amateur if he/she gets to the point of knowing that much. Hence that "amateur" label is a bit condescending.
Having read all the books about climbing will not get you ready to climb Everest. Experience will.
Wrong again, and you really missed the boat. What you just describe concerning $$ versus Results is not analogous to HUD. This is basically more akin to a Boyle's Law where PV=nRT and if Pressure goes up then Volume goes down. Cost eating into profits is an age old thing and no one uses HUD to explain it. Geez, I have a problem since work eats away at my vacation time, therefore Work vs. Fun is also an illustration of Heisenberg's Uncertainty Principal. If I work too much then I don't have time for vacation, but if I don't work enough then I can't afford vacation. This is just nuts to stretch what is basically an optimizatuion problem into HUD!
I really don't care whether the geologists are under job pressures to get their work done, and that they don't have time to solve global problems. It just so happens that I make the time because I find it an interesting subject.
That whole whine of oil people always being under the gun is pretty pathetic.
I think the big problem with geologists is that the majority of them enter the field because they can get outside and can use their hands. If they were the types that could just think through problems from an abstract point-of-view then they wouldn't have become geologists. I think a lot of us on TOD are filling in the missing link.
Above I meant HUP=Heisenberg's Uncertainty Principle, not HUD. And all this is just pretentious crap that Dake is peddling to make himself look smart.
Nobody uses Boyle's Law to explain it either.
Of the two, Heisenberg's makes a better analogy: you have a fixed budget to spend in order to get information on two related quantities, meaning that you are going to have to trade off information quality between the two based on your priorities. For oil fields, that budget is money; for particles, that "budget" is the information limit.
Neither one makes a particularly apt analogy, though.
Dismissing as inept an entire field of people is almost certainly deeply misguided.
A scold or a concern troll? Kind of hard to tell.
Nobody uses Heisenberg's Uncertainty Principle to make optimization decisions. Everyone uses equations like Boyle's Law to make optimizations decisions.
As far as skills of geologists in general, the discussion in college was always about the freshman who couldn't cut it in engineering going into geology. That's not me saying this. And I have been reading John McPhee's Basin&Range which is kind of interesting and intriguing because it focuses on Richard Deffeyes' work. One of Deffeyes' college courses was informally known around campus as "Rocks for Jocks". He is a good teacher though according to the book.
I rest my case.
They appear to be saying that they estimate a distribution based on historical data, rather than picking a distribution based on their intuition. Using data rather than an arbitrary choice is a good thing. How is this worthy of such venom and personal attacks?
In all honesty, this post of yours makes you sound like a raving nutjob. Did these guys run over your dog or something? Is this really the tone of discussion you think is appropriate?
You have to admit my rant is pretty funny.
OK, to finish up the question. I have had quite enough of pure heuristics and would really like to see something new brought to the table. That's all. I'm essentially throwing down a challenge.
Pitt would certainly make a good reviewer for a manuscript though ... he doesn't seem to leave an email address around.
Rembrandt,
excellent posting as usual. I especially appreciate your graphs. Does figure 2 include last year's results of the USGS Circum-Arctic Resource Appraisal, which is sort of an update of the USGS 2000 study?
I am suprised to see that they that they estimate the average production costs below US$20. They don't really seem to consider marginal costs of new projects (which I remember between US$ 70 and 100 from several sources) - or if they do they believe in claims like Saudi Aramco's two dollar oil.
Thank you for your work, Rembrandt,
and also for the respectful tone, which I value.
I just wrote a note to the journal editors asking if there's a process by which one might submit your article to the journal or publish it as a long comment.
It seems to me if people really takes the scientific process seriously, then there must be a way that the contributors like yourself at TOD can exchange views with those who might subscribe to the journal, and who place stock in the scientific publication process, as represented by the journal. If they'd like this to occur solely on "their turf", so to speak, then perhaps this could be arranged. (Anyway, just thought I'd give it a try and see what happens.)