Saudi Arabia's Ghawar Isn't Sinking (but has apparently moved)
Posted by JoulesBurn on May 8, 2008 - 10:00am
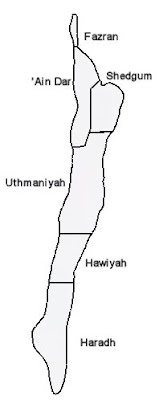 Ghawar is the largest oil field in the world. It is divided into six operational areas, as shown in the figure at right. The most productive yet most depleted areas of the field are 'Ain Dar, Shedgum, and the northern two thirds of Uthmaniyah. Haradh has undergone three drilling increments beginning in the mid 1990s and culminating with the Haradh III project in 2006. In my critique of their previous report, I noted that they claimed to have determined the extent of drilling for Haradh III -- despite the fact that their data did not cover the area in which Haradh III is located. They have responded with new data but with the same interpretation as before.
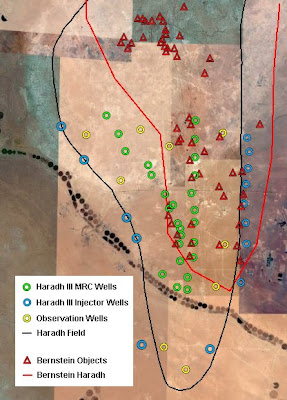
However, something else was amiss with a figure they provided showing the area around Haradh III along with identified well locations. The underlying satellite image has numerous surface features which can be used to align an overlay of their data on Google Earth. Most prominent in the Haradh area is a line of irrigated crop circles along a river bed. This line cuts across the "toe" of Ghawar, the location of the Haradh III increment. Upon using this feature to align the Bernstein data, it was apparent that they have Haradh located 10 miles to the northeast of where it actually is. This is shown in the figure below.
The black trace indicates the Original Oil-Water Contact for Haradh as determined previously. This location is consistent with several maps with well locations for georeferencing, most notably this paper from Saudi Aramco:
Assessing the Oil Water Contact in Haradh Arab-D
The green, blue, and yellow circles correspond to Haradh III well locations determined using 2004 high resolution and 2006 low resolution DigitalGlobe (Quickbird) satellite imagery. The red trace indicated the field boundary as suggested by the Bernstein authors, and the red triangles indicate the positions of "objects" found using their automated feature identification method (see the previous critique for a discussion).
On the plus side, it is refreshing to see that their computer algorithm for feature identification (CAFE, perhaps) did find numerous Haradh III wells. Of course, more than half of the wells were certainly neglected because the authors weren't looking for them. There is also a curious grouping of found wells to the north. The authors likely presumed that these were also Haradh III wells, but their correct location places them in the upper half of the Haradh II increment. Also, the close spacing of these wells is rather unusual. Given that most of these wells are in an area not yet covered by high-resolution imagery in Google Earth, a more detailed appraisal of their algorithm's proficiency at counting wells in Haradh must wait.
 This displacement error exists in all of the data presented in this and the previous Bernstein report as well, as shown at right. Their drilling activity data (see the figure from the recent Wall Street Journal story) has been recreated. The black traces indicate the correct Ghawar boundaries, whereas the red trace denotes that assumed by the Bernstein authors. The alignment of their data is facilitated by date palm groves located east of the field, some prominant (white) features west of the field, and irrigation circles to the south. To play along at home, load this Google Earth file.
Instead of presenting the identified new well (and disappearing well) locations individually, the authors calculated a "activity density" and layered that over the satellite data. The contour colors indicate increasing (yellow to red) and decreasing (blue to purple) activity. One result of the corrected field geography is that their interpretation that the southern-most region of enhanced drilling activity in 2004-2007 was due to the Hawiyah NGL project (a revised conclusion from their first report) becomes cloudy given that over half of the "hot spot" is now in Uthmaniyah. 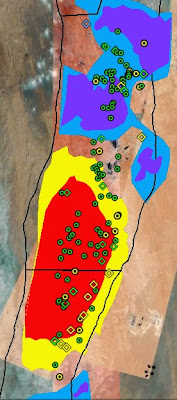 There is no visual evidence (using high-resolution 2006 imagery, where one can distinguish between oil and gas wells) that drilling of new gas wells was comparable to the drilling of new oil wells. As discussed in this post, overall drilling in 2006 was predominantly for oil, particularly in Uthmaniyah. This is shown in the figure at left, with green and yellow placemarks denoting oil and gas wells respectively, and with circle and diamond shapes representing new sites and drilling rigs respectively. Most of the new gas wells nearest to the "hot spot" are drilled into the Jauf sandstone formation on the east side of the field. It appears more likely that the "hot spot", if it does reflects drilling activity, is due to new oil wells (rather than gas) in south Uthmaniyah and north Hawiyah. What is needed is a more complete analysis of what is found using their (computer automated) approach versus that identified manually.
Looks Dark, But Is It A Well?
Fortunately, the authors provided data showing the locations of found "objects" in the Shedgum area. This data was (as above) used as an overlay in Google Earth and the well identifications therein were compared with those found by a "hobbyist" (OK, by me identifying the wells manually).
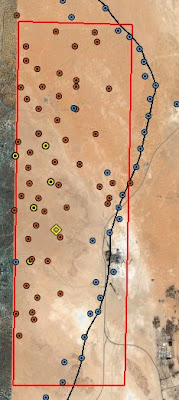 Since much of Shedgum is as yet not covered at high resolution in GE, I restricted the analysis region to include only the hi-res Summer 2006 imagery currently visible as shown in the figure at right by the red rectangle. All Shedgum wells visible in the Google Earth 2006 view are shown, including oil wells (red), water injectors (blue), and gas wells (yellow). The one rig visible, determined to be re-drilling an old gas well, is indicated by the yellow diamond. Note that the presumed field boundary lies along the peripheral injectors.
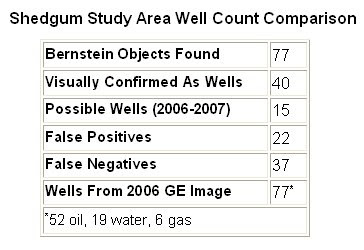
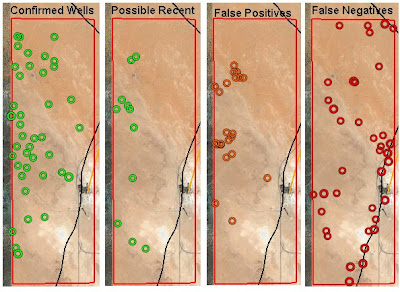
The overall comparison results are presented in the table below. Note that the fact that the total wells counted is the same for both methods, it is not the same wells. First, 15 of the Bernstein wells are presumed to exist (late 2006-2007) but not visible in the 2006 GE image. Second, 22 Bernstein wells are found to not be distinct wells (or wells at all). Finally, 37 visible wells are missed by the Bernstein approach.
Shown below is the geographical distribution of the discrepancies. Most of the false negatives are water injection wells on the flank. Most are older wells and offer less contrast for the computer algorithm. In addition, a number of these have been deactiviate (but not "bulldozed!").
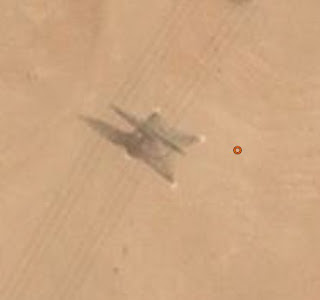 The false positives are interesting. Three of the objects identified are actually towers for high voltage electricity transmission, as seen at right. Other mistakes include structures associated with the gas-oil separation plant (image), pipeline infrastructure, and rock outcroppings.
Gas wells present a more complex problem. They have rather distinctive structures associated with them, and the sizes are such that they are usually identified as separate wells using the automated method. See this article for information on identifying wells in satellite imagery. The wellhead is located in the center of the larger feature, but it is often not identified (as was the case of the example below right). 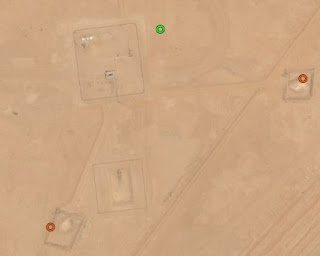 So a single gas well could be counted as 0-4 objects depending on the prominance of the various features. What is needed is a count of the wellheads instead of "objects", but their approach does not lend itself to that possibility.
With regards to gas wells, one false negative was rather curious. An old gas well being reworked in summer 2006 (image), but this was missed completely by their algorithm. Perhaps Saudi Aramco should they set it on fire next time to make it more prominant. In a similar way, oil wells identifications are rarely centered on the wellhead but rather on remnants of the mud pit left over from drilling. Deciding whether or not a well exists (or has been "bulldozed") based on the visibility of this feature is probably not a good idea.
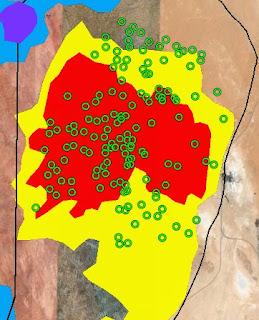 One final comparison regarding Shedgum. Shown below are the "objects" identified across Shedgum since 2004, according to data from their report. This is superimposed on their density contours data (corresponding to the 2004-2007 timeframe) as described earlier. It is not clear how one arrives at the density representation from the object geographical distribution. An eventual update of the Google Earth imagery will help confirm whether or not all these wells are indeed where the algorithm says they are.
The Rise and Fall of Ghawar
Finally, we arrive at the debateable premise of the second report. Will Ghawar sink as it is rapidly emptied of oil, and will it rise if water is injected too fast? Can such a change be measured? And if so, does the failure to measure sinking constitute evidence that Ghawar is "not in significant trouble" (to quote the authors), and that "Peak Oil" warnings are unfounded? Or, in to quote Donald Rumsfeld, is absence of evidence evidence of absence? The resounding answer to at least one of these questions is...well, not really.
If subsidence (or alternately, bloating) occurs, can it be measured via satellite? The answer to that is yes, although the circumstances for Ghawar are quite different from those cases. It is well know that Ghawar has been subjected to pressurized water injection from the periphery of the field since about 1970. The goal is to keep the bottomhole pressure at the producers well above the bubble point. Before that time, pressures dropped significantly from the initial pressure due to the aquifer (from over 3000 psi to about 2000 psi in Uthmaniyah). However, they have been maintained at about 2800 psi up to the present.
I could speculate on this further, but it would be just that given my lack of expertise in deep reservoir rock physics. Given the many flaws related to the counting of wells in the two Bernstein reports, I suggest they do a test run on something simpler. Apparently, Saudi Aramco is going to do some injecting and draining of the small field of Harmaliyah. Perhaps they should look at that first. Or maybe the authors should explain first why (as their data seems to suggest) the land to the east of Shedgum, where aquifers are being drained to water the date palm orchards, seems to be rising more than Shedgum.
Conclusion
I (hesitantly) suggest that the Bernstein authors revise their conclusions in light of, at least, a correct placement of the Ghawar field. Consider counting wells instead of "objects". Ghawar may be crashing, or it might be doing just fine, but their current interpretation and data set don't really push the needle one way or the other.It is likely true that Shedgum is being drilled for the remaining oil, and visual evidence suggests that Uthmaniyah and Hawiyah are attracting serious attention as well. The question is not really how well Saudi Aramco is managing their fields -- they are probably doing a fine job. The question, at least for the near term, is how they are managing their existing production rates.



JoulesBurn, I love your posts. Remote sensing is my specialty and I'm thrilled to see it applied to peak oil in such an intelligent way.
I'm having trouble understanding their automatic feature detection (template matching perhaps), the approach is necessarily semi-supervised with potentially a lot of false alarms/false positive that need to be filter out manually. You cannot blindly applied an automatic algorithm without double checking the results. In particular, the inclusions of high voltage towers is quite telling and prove that Bernstein work was done by amateurs and should have been done by hobbyists instead :).
They don't go into much detail. This is from their first report:
Part of the problem is that ASTER is B&W and color differences at wells vs. the surroundings are not apparent.
JB
I'm a SAR-specialist myself. The features they've detected are most probably some stable objects/terrain features (so-called "Persistent Scatterers" or PS in differential SAR interferometry) that reflect incident radiation well back towards the radar. A high-voltage tower can easily make an excellent PS that can be used to track terrain motion.
You are exactly correct however it is not clear if those "objects" are used as PS only or also used in order to draw conclusions about the evolution in drilling activity.
It's impossible to say without seeing the report - I'd like to know what the "activity density" is all about.
Hang on.
If they are using optical methods to evaluate uplift/sinking then the accuracy is insufficient (as previously mentioned). If they are using SAR then there is the small matter that the area is covered in sand dunes. On a local basis you would expect some significant changes in topography. On a regional averaged basis you would still need to see changes measured in metres to be sure the changes you saw were real uplift.
About the only way it would work is if you picked spot heights on known features (such as roads) that wouldn't change otherwise, comparing them between satellite passes.
There are still too many unanswered questions and I still think they are in the realm of junk science and extrapolating unacceptably from poor data - unless they can prove otherwise. Once you discard their uplift/sink data, is there anything left to sustain a statement that everything is AOK?
Garyp, there are many high dunes in the area but there are also many areas with no dunes. Some of it is just hardpan desert with no dunes at all. As the article states, there are irrigated wheat fields that cuts across the southern tip of Ghawar. Also, even where there are dunes, there are stable clearings among the dunes. They have a name but it escapes me at the moment. Anyway, it is in these stable clearings that the wells and gosps are placed.
Ron Patterson
Ron,
I think you mean sabkhas, the most extreme examples being around Shaybah. However, Ghawar really isn't like that either. It most parts, the wells all look like that suggested by the photo below from the middle of Uthmaniyah. They bulldoze the sand into berms surrounding a big flat area for the drilling equipment etc.
Shedgum seems to be less sandy, and as a consequence, it is harder to spot the wells.
Indeed, which is why I mention spot height measurement before. It probably is possible to get some heights - but its nowhere near as simple as an area where you are talking of a hard surface over the entire area. Don't forget SAR is an interferometry based approach, you need something to base measurements on.
Given the other question marks it would need some serious exposure of real data to know if the measurements were credible and what the error bars were.
With Differential SAR Interferometry (DInSAR) one can detect subsidence rates of 1mm/year provided that many SAR images are available, there are stable features/structures seen by the radar (the Persistent Scatterers or 'PS') and that the subsidence-rate behaves nicely (smooth/linear behaviour in time).
Re: Using the the technique of Synthetic Aperature Radar (SAR) Interferometry, which is capable of measuring millimeter vertical movements via satellite, they found not subsidence but actually a slight rise in one area
Is such a surface rise possible? I know that subsidence over old oil fields has been observed:
http://pubs.usgs.gov/fs/fs06903/
My guess is that water injection would be the likely cause but Ghawar being at nearly 1500-2000 m deep, pressure from the above ground is probably around 1000 bars.
Well if subsidence is possible from removing something, then it is reasonable that putting something back in would restore it.
Back in the late 80s, when production in Haradh was shut down, pressure started rising back up (naturally, since it was not being water injected as it was produced) but then had some strange pressure drops in wells across the field. This has been interpreted as fractures -- which had been shut off as the oil was produced -- re-opening during the stoppage, temporarily reversing the pressure buildup. Of course, it is not know if this translated into anything measurable on the surface, and no unusual seismic activity was noted.
The idea is interesting, but ECREE (extraordinary claims require extraordinary evidence). If you postulated subsidence and then measured a (growing) depression shaped like Ghawar, you might have something. If you found nothing, most likely your hypothesis is wrong. If you instead see a slight rise that includes part of Shedgum but doesn't conform at all to where Shedgum is, your hypothesis is likely still wrong. Getting to enamored with one's idea (that any rise or fall is due to Ghawar subsidence or inflation) and then tying the fate of Ghawar to what you measure is amazingly delusional.
Dr. Joules, that completely ignores Khebab's point. That is the weight of the overburden rock. It is a lot easier to pump oil or water out that is under tremendous pressure than to push it back in. It is a lot easier to let 7000 feet of solid rock fall than it is to lift it.
Injection wells, from a link I posted yesterday, have an injection pressure of about 1500 PSI. Some of them in Ghawar may be slightly more but that is not even close to the amount of pressure it would take to lift 7000 feet of rock. Khebab says it would take 1000 bars, or about 14,500 psi. Someone on Drumbeats yesterday said it would be slightly less or about 1 psi per foot. But at any rate, 1500 PSI is not even near the pressure it would take to raise such a heavy load.
I would take the position that lifting 7000 feet of rock with an injection pump is an impossibility.
Ron Patterson
My understanding is the lifting force is actually due to intergrain water sheets, which move by capillary action. This force is incredibly powerful--it can considerably multiply the measured pressure.
Another thing to consider is the solute potential of material left in the rock. Even injecting sea water, if there are water soluble compounds (sulfur, acids, iron, etc.) in the field the water activity will want to equilibrate. Water will flow from a dilute solution to a concentrated solution until the concentration of solutes is balanced or the sources migrate away from the rock.
Plants grow through this mechanism. They raise the solute potential in cells (using any small molecule, salts, sugars, acids, proteins, etc), water flows in from outside, raising the internal pressure and forces the cell walls to physically deform/stretch in one direction along a fault zone in the cell walls. The power of osmotic potential can be very large, getting into the 1000's of PSI. Plant roots break granite rocks apart using this mechanism as they grow. I am not saying this mechanism is happening in this field, just that it shouldn't be discounted in a water drive oil field.
according to wiki, this is the mechanism at work in ekofisk, mentioned below. subsidence due to solution cavitation. i have never heard of this happening in ghawar, but if bernstein is to be believed, it is not happening.
Dr Joules,
It is not uncommon for oil fields to subside when the oil is removed though this does not always happen. A famous example is the Ekofisk Field in the North Sea where sea bed subsidence meant they had to reconstruct the platform which was in danger of sinking to within the reach of large waves.
I think the main processes here are depressurisation combined with the removal of bouyant oil that kind of holds things up - the pressure and bouyancy are of course both related.
Like Ron, I very much doubt that the Ghawar structure could be pumped up by water injection. The Arab D is very well connected down dip (unless it is sealed by a tar mat) and so injected water would rather travel down into the "infinite" volume of the aquifer than raise the ground.
It is well known that the Arabian Plate is experiencing compressional tectonics. It is in fact that compression that has given rise to the large structures that the oil is trapped beneath. I heard at a talk many years ago in Baharain that this compression and structural growth continues to the present day. Thus if measurable changes in land height have been made I imagine this might be one cause.
Euan (and Ron),
Thanks for the comments. I don't believe in Ghawar inflation either, I'm just letting my mind wander. I definitely agree that the water would go sideways, especially since this happened in Harmaliyah.
I'm no geologist but I know that filling aquifers can and do lift the ground above and that this can be measured with InSAR.
I'm no geologist either but I think aquifer depths are usually on the order of tens to hundreds of meters.
Dr Khebab, I'm not sure the focus on Ghawar rising or falling should necessarily be the focus of this debate, since I can't find my copy of this report, and don't really know the details.
The important variable in all this is pressure - hydrostatic pressure, lithostatic pressure and over pressure in the reservoir. My understanding is that Ghawar is "normally" pressured - i.e. the fluids are at some point in contact with the surface, and hence they are not supporting the rock formation. So removing the fluid or pumping in more fluid should not affect the rock strata - that much.
In some reservoirs, the fluids actually support the rock - and here by definition the fluids will be over-pressured. Removing them will cause the rock formation to subside. If the fluids supported the rock then this means there are seals in the sub-surface - and pumping water back in may pump the strata back up.
The other consideration is gravity - lunar and solar cycles do have detectable influence on sub-surface fluid pressure. And so I imagine that changing the fluids may affect the gravitational response of the surface to tides - but you'd need to consult a rocket scientist to get a concrete answer here - I am a humble geologist.
We need to know more about the InSAR analysis that has been performed and whether that has been done correctly. The main source of error in InSAR is the changing water vapor content in the atmosphere, which changes the path-length between the ground and the satellite (refraction). If they've used a long time series of images, this should not be a problem, but if they used only a few scenes and the operator was incompetent, the patterns could be all artefacts.
Since PSI-measurements are relative and local, lunar and solar tides don't matter much at all as they move everything up or down, as do changes in air-pressure (space geodesy is weird).
BTW I've seen a presentation of PSI analysis over some much smaller oilfield in Saudi Arabia, there the ground subsidence was clearly detectable.
To focus on some of the things we know for sure;
Northern Ghawar (Ain Dar, Shedgum and Uthmaniyah) have higher porosity than southern Ghawar (Hawiyah and Haradh).
The north was developed first and has had considerably more oil removed than the south.
Ain Dar is likely near "totally" depleted of dry oil. The same applies to N Uthmaniyah and much of Shedgum. This means that the reservoir now contains mainly a mixture of oil and water in varying proportions.
Haradh and Hawiyah are likely still mainly full of oil.
Further reading:
http://www.theoildrum.com/node/2462
http://www.theoildrum.com/node/2494
http://www.theoildrum.com/node/2507
and by Stuart:
http://www.theoildrum.com/node/2470
http://www.theoildrum.com/node/2563
Should you want to contact any of the staff here who do not have public email they can be reached on:
theoildrum@gmail.com
One qualification here - the 1300 ft oil column in Ghawar does create a massive amount of bouyancy pressure which could just intersect the lithostatic pressure gradient. I'd need more time than I have right now to run up some charts on this but gotta presume that the pros at Bernstein have these angles comprehensively covered.
Euan, any upward pressure caused by oil bouyancy would have had to have happened millions of years ago, when the oil first rose and displaced the water above it. As the oil is pumped out and replaced with water, that bouyancy would be removed.
Remember it always had water in the reservoir, then oil replaced the water and now water is replacing the oil again.
Ron Patterson
it is true that in some cases the fluids support the overburden, geopressured areas.
however the pore volume of all rock is compressible. on the order of 4 x 10^-6 vol/vol/psi and much higher for unconsolidated rock.
hypothetically the removal of 60Gb from ghawar, or about 84 Gb or reservoir volume, could result in subsidence. still the lack of subsidence does not disprove depletion.
depletion is occuring at the rate of 5 million bbls per day.
i think bernstein must have got this idea from a dittohead.
water injection would normally go sideways, either through porous rock or hydraulically created (vertical)fractures, but interestingly, the places where hydraulically created horizontal fractures would occur is in areas of compressional tectonics(black warrior basin of alabama,for example).
the frac gradient for a vertical (hydraulic) fracture is on the order of 0.7 psi/ft. the frac gradient for a horizontal fracture is on the order of 1 psi/ft, implying uplifting of the overburden.
it was my understanding, however that the rift which resulted in the generation of so much oil in the mideast was an extention of the north sea rift. further, i thought that in a rifted area, the rock was undergoing extention.
The Bernstein reports seem to suggest that no matter how shoddy your work, you can get someone to buy it. Hopefully, if they have your work to lay along side of it, buyers will be skeptical of the findings.
I would not call their work shoddy without having seen it. Let's assume for a second that the inferred subsidence/upsidence-patterns are real (and caused by water injection and oil extraction) - what would that imply?
By the way there are about a dozen of companies in the world doing PSI (Persistent Scatterer Interferometry) - processing&analysis in the world. Those companies range from good to extremely good in their line of work and they don't "misplace" oilfields. If there are no PS (stable structures/terrain features) detected where TOD-readers expect them to be there are reasons for why such a thing might happen. Bernstein has bought the analysis from somewhere and while they might have screwed up themselves after receiving the analysis I would guess that the underlying PSI-work is good.
The Bernstein reports seem to suggest...
I think the WSJ's coverage points out the difficulty in having meaningful "discussions about energy and our future".
WSJ gives the report marque exposure, and then here at TOD, Joules details the mislocation of the reservoir.
Joules (whoever he really is) is obviously an expert, but his anonymity is a dead end.
Hi Will,
Could you possibly explain this a little further?
re: "...his anonymity is a dead end."
Is it the case that "the facts" cannot speak for themselves?
Why is that?
Is there any way to overcome the problem?
Would it be better if he/(less-likely she) could...speak?
What about someone with a (presumably real) name? See Stephen Hubbard below, for eg. Would this help?
And, if so, what to do?
Isn't that the truth.... Daniel Yergin - what a racket! Any chance he will be hauled over the coals (sorry) on CNN any time soon for the snake oil CERA has been selling these last few years? Lucky for him the SCLM has the attention span of the average hooker-missing white girl-starlet drug arrest story. /rant off
one doesnt know if bernstein is an ignoratti(glamorously ignorant) or an ignorante(vigilantly ignorant).
http://reddit.com/info/6in5n/comments/ (SCI)
http://digg.com/business_finance/Saudi_Arabia_s_Ghawar_Isn_t_Sinking_but...
Thanks very much for your efforts to spread The Oil Drum's research around.
Any idea how the Bernstein methodology compares to the methodology for updating a datum (e.g. WGS-84), or for updating DTED Level III? Based on my (very) limited knowledge in the area, it's my understanding that the fundamental geometry of the Earth changes pretty dramatically over even relatively short periods (at least when compared to measurements of subsidence in millimeters), and that this could introduce significant error if the change detection is not controlled by simultaneously comparing to nearby areas, changes in DTED/Datum updates, etc.
That doesn't really matter as PSI-measurements are relative and local. They are done in radar-geometry and they measure how the relative distances to the detected PS change in time.
You were talking about those electricity towers being used as scatter points. Would you normally take into account the fact that they expand/compress under temperature changes? The difference can easily be more than a millimetre in height between 6 am and 3 pm just by insolation heating up the damn thing.
Thermal expansion can be detected if the sampling of images used is dense enough. It is even possible to detect whether a structure is made from steel or aluminium. Anyway, such effects are smaller than the signal of interest in the oil-extraction case.
The Himalayas were rising.
Part of California was moving past another part of California and into the sea.
Where there was tension in the earths crust (pulling apart) a graben formed and the fault block dropped downward. Where there was compression an anticline or thrust faulted range formed.
This is the result of plate tectonics.
You cannot describe the amount of oil in the Ghawar reservoir by the height of the surface.
Was there migration of sand from windstorms in the desert?
Dunes often "wandered" across the desert swallowing abandoned man made structures.
A few millimeters surface change to produce all this pondering.
May need a course in basic physical geology with some field & structural geology lectures also.
I like it.
JoulesBurn: 2
Bernstein: 0
While my experience with SAR is limited, I did spent several years during the Reagan era working on Black projects that used 3D remote sensing & photogrametry to measure items on the ground. One of the absolute requirements to produce any useful analysis is to derive values for known items in the same theater and in the same data set. Examples include roads, which are nice wide flat areas that show the noise in your system, building tops and changing items, such as buildings under construction, or vehicles that have moved. Once done, you get a set of equations that describe random and systematic errors, and the variation in x,y & z error ellipses across your data set - (the error values are a function of the angle and distance from the sensor’s center). After you've done this for several data sets, you can then make comments about what the data shows within the limits of its accuracy. From their comments, it is uncertain whether they've actually done this because the transfer function are different for each sensor, which makes combining data very difficult (see Sensor Transfer Function below).
There is also a second, even more critical element that has been pointed out above, which is without knowing the relationship between extracted oil, injected water and change in reservoir height, it’s impossible to say how much oil has been removed, regardless of the sensor’s accuracy. The relation is probably a non-linear function with multiple discontinuities that varies widely across the enormous Ghawar field. See “Twilight in the Desert” by Matt Simmons or the many excellent TOD posts for descriptions of Ghawar’s strata variations. Thus in the end, their effort is an exercise in futility which produces no reliable data, conclusions or inferences.
Sensor Transfer Function - Lets use the Ikonos satellite as an example because it produces many of Google Earth's images. It uses a 6,500 pixel array that produces an image by sweeping along the ground like a push broom and recording 1 line at a time. Theoretically, if the sensor array were very bright lights shining down on the ground, you should see a perfect line of 6,500 white 0.8 meter squares moving along. However, because
1) The satellite is moving, trembling and vibrating at many different frequencies,
2) The earth is turning,
3) The air is distorting the light path for each pixel differently, and
4) The time it takes to record the light for each pixel changes the line of squares into a skewed curve of rectangles,
You would instead see a curve of distorted trapezoidal shapes, moving around chaotically like each one was guided independently by a different drunk. Thus the sensor would not record nice 0.8 meter squares, but blurry distorted shapes with portions of neighboring squares mixed in, offset randomly in x, y and z due to the factors listed above.
In addition, each pixel in the senor array has its own spectral response and sensitivity variations across its surface. So if you took a picture of a perfectly white square in the lab with one pixel, you would get a fuzzy mottled image with color distortions. To correct this mess, you create a series of equations that describe on average, all of the above errors which are the sensor's “Transfer function”. Combining data from different sensors, each with its own transfer function, means that you are trying to create a new grid (data set) by adding together different portions of differently sized fuzzed/distorted pixels, each with their own random position and height errors, and hope you produce something useful. SAR has a similar set of problems, although it’s not as sensitive to atmospheric conditions.
The CIA, NSA, DIA and others have entire buildings filled with people that rocket scientist’s look up to, who are dedicated to combining remotely sensed data into reliable, data fusion products. It is highly unlikely that the Bernstein Research group has the same analytical tools, resources and experience to perform their analysis to the accuracy and reliability that they claim.
My hat off to all TOD contributors.
Your contributions are worth (in gold) a lot more than Wall Street research.
Hello JoulesBurn and other thread responders--Great job! I have nothing to add as this gets highly technical very quickly, but I have sure learned a lot! JB, your definitely not a 'hobbyist'--I think you are ready to go top-notch professional--Big Kudos!
Bob Shaw in Phx,Az Are Humans Smarter than Yeast?
I'm impressed by the high concentration of signal processing engineers contributing to this thread. With the brainpower evidenced here, just a matter of time before somebody figures it all out.
Great thread - from beginning to end. Many thanks to all who contributed.