Abqaiq and Eat It Too (or, More Geological Analysis of Potential Saudi Depletion)
Posted by JoulesBurn on May 15, 2008 - 10:10am
"Wolde you bothe eate your cake, and have your cake?"
John Heywood, 1536
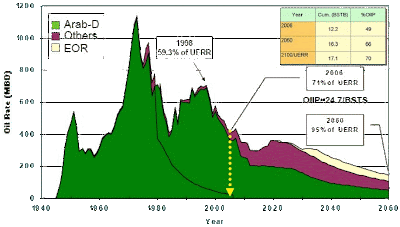
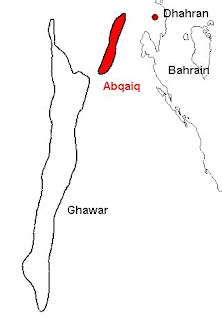 Abqaiq is situated to the northeast of the Ghawar oil field and to the southwest of Dhahran and the headquarters of Saudi Aramco. It has been producing oil for over 60 years, and although there is still more oil to be had, it has recently become more proclaimed as a supposed harbinger of continued success by Saudi Aramco. The past and predicted future production from Abqaiq was revealed in a Nansen Saleri (formerly of Saudi Aramco) presentation at CERA Week in February 2007 shown below (click for larger version):
There are several features indicated in the above graphic, but of particular note are the Oil Initially In Place (OIIP) for the field (24.7 billion barrels), the marked decline in production since the mid-1990s, and the expected contribution from "Other" reservoirs for future production. The vast majority of Abqaiq oil has been produced from the Arab-D reservoir, an NE-trending anticline with an uplift on the southern end. Lesser amounts have been produced from the lower-lying Hanifa reservoir, separated from the Arab-D by over 300 feet of the Jubaila formation. As indicated, an increasing fraction of the total production is predicted to come from the Hanifa, starting from about 2006. But this is not a new aspiration: intensive efforts to tap the Hanifa began in the early 1990s and these have had, as is apparent from the data, minimal success. The idea was to perform an intensive waterflood of the lower reservoir, with a combination of horizontal injectors and producers (Oil & Gas Journal; Jun 21, 1993), but things clearly have not worked out as expected.
Typical of the spin on Abqaiq is this take by Saleri as reported in the WSJ Environmental Capital Blog:
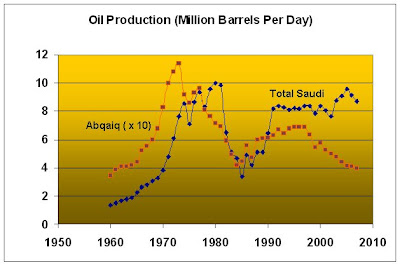
“Abqaiq became a renaissance story for Aramco,” he says, insisting that the field’s pressure remains strong and its water content is going down even after more than 60 years in production. Abqaiq “is doing fantastically,”Of course, part of the disconnect here is that "doing fantastically" means different things to different people. For a reservoir engineer (such as Saleri), this might mean keeping the water cut low and getting the highest possible recovery from the field. However, for a consumer of Saudi oil, the trend of decreasing production in this decade is not a promising development. As for a "renaissance", I suppose one could point to the surge in production in the late 1980s. But if we put this in context of overall Saudi production (below figure), it seems more likely that this increase resulted from a renewed desire to produce fully rather than a renewal of the field itself.
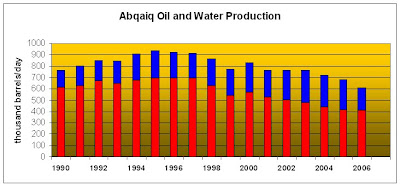
Much has been made of the decreased water cut (from 42% in 2004 to 32% in 2006, see SPE 110979: Technological Applications Redefining Mature Field Economic Limits). While this does improve the economics of keeping things going without needing new equipment for separating oil from water, it does not necessarily lead to more oil. Note the trend in the figure below (red=oil, blue=water).
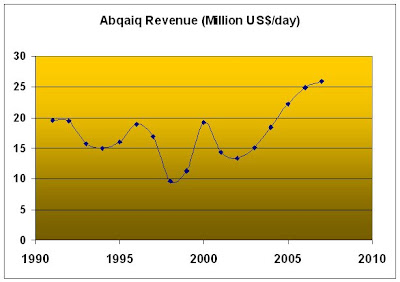
The final arbiter, however, might the person counting the money. If we consider the revenue from the oil extracted from Abqaiq, in constant 2007 dollars, the picture improves tremendously:
Satellite images of Abqaiq presented herein, as well as recent technical reports and comments by Saleri and others, suggest that Saudi Aramco is still serious about keeping the oil flowing. About half of the Abqaiq OOIP has been produced to date. Their goal of another 20% will not come as easily as the previous 20%, and is certainly not a foregone conclusion that it will happen -- or happen at the rate that they expect. Using a satellite analysis as a backdrop, let's see how some of their recent efforts are doing.
As of this writing, Google Earth displays high resolution imagery covering the entire Abqaiq field dating to September 6, 2006. There are also low-resolution previews available, covering 2/3 of the field, which date to November 11, 2007. These will be used to identify additional work in the field subsequent to the 2006 date.
Taking Measurements
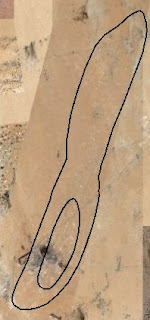
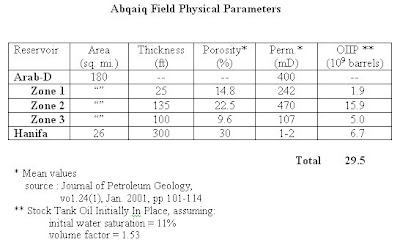
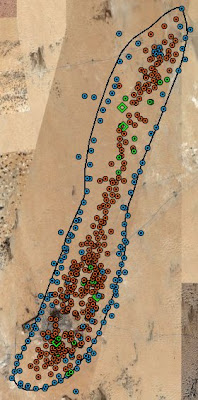
In the image at right, the outer and inner polygon overlays denote the original oil/water contacts (OOWC) for the Arab-D and Hanifa Reservoirs, respectively. These were determined using publications described herein in conjunction with actual well locations. Shown below are reservoir size estimations based on the measured areas and literature petrophysical parameters for Abqaiq.
The total OIIP calculated for Abqaiq (29.5 billion barrels) is somewhat high compared to the figure stated by Saudi Aramco (24.7), although there are many uncertainties in some of the assumptions. For one, no allowance was made in the above calculations for edge effects. This will tend to overestimate oil volumes for both reservoirs. Also, initial water saturation values might be different than those assumed; larger values will translate into less OIIP. The calculated distribution of oil between the various reservoirs and zones, however, is probably more accurate than the absolute numbers. Although the area covered by the Hanifa reservoir is considerably smaller than that by the Arab-D, the higher porosity and larger thickness of the Hanifa means that it has roughly 1/4 of the oil of the larger reservoir (if similar values for water saturations are assumed). Of course, in light of the tightness of the rock (1-2 mD), getting the oil out is the challenge (although the permeability in Hanifa is more determined by fractures). Furthermore, this challenge is more daunting because the reservoirs, despite being separated by hundreds of feet of impermeable rock, are not isolated from one another but rather connected through extended fractures. Indeed, they are the same oil. The problems that arise from this connection will be addressed shortly.
But First, Tee Time
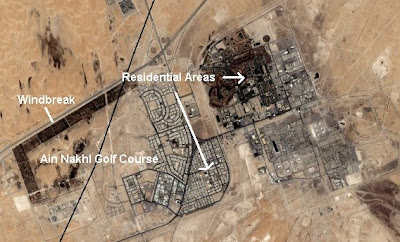
Before checking out the wells, I will first identify the dark area located in the southwest part of the field in the image above. One surface feature of Abqaiq which is not found in Ghawar (or other more remote oil fields) is a residential area complete with a golf course (alas, not with grass). This is the Abqaiq compound, one of several housing facilities provided by Saudi Aramco for its employees. While this close location does have its benefits, there are also safety issues which do present constraints on oil field development.
Shown in the figure at right is the Abqaiq field as seen in the Sept. 2006 satellite image with all oil wells and well sites identified. Red and green placemarks indicate old and new wells respectively, blue indicates water injection wells, and green diamonds indicates drilling rigs. For part of the field, a resource is available for correlation of well locations. A paper by Paul Lawrence entitled Seismic attributes in the characterization of small-scale reservoir faults in Abqaiq Field (The Leading Edge; April 1998; v. 17; no. 4; p. 521-525) includes a map with locations of wells in the South Dome area. This well inventory, probably dating to 1996-1997, will be used later to identify drilling activity subsequent to that time. The published well spacing was found to be quite accurate.
A disparity in the number of wells between the northern and southern halves of the field (the "North Nose" and "South Dome", respectively) is clear. Some of this is due to the wells drilled into the Hanifa reservoir which is present only in the south. Also, the bottleneck in the middle of the field has probably constrained well placement there, given the desire to offset the producers from the peripheral injectors. But there is definitely drilling and/or redrilling occuring in the north, though the depleted state of the field has revealed some geologic differences between the north and the south, and these have led to the need for different approaches to maintain production levels.
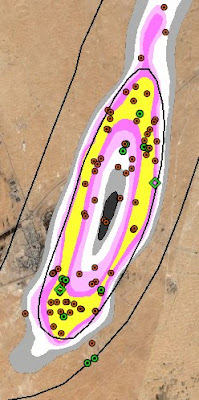
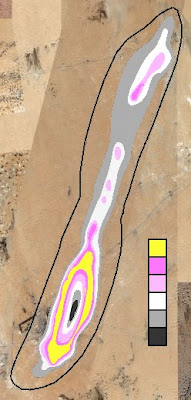
Now, let's step backwards and consider the state of the Abqaiq field in the early 1990s. The Oil & Gas Journal paper cited above provides data on the remaining oil thickness in the field as of 1993, and this data has been recreated and superimposed on the satellite imagery as shown at left. The color scheme indicates increasing oil layer thickness going from black to yellow. Note that, towards the middle of the South Dome, the oil thickness goes through a maximum and then reverses. This is due to the presence of a gas cap which resulted from the injection of gas into the crest of the Arab-D reservoir, for pressure maintenance purposes, from 1954 to 1978. The remaining oil is squeezed between the advancing waterflood and the gas cap, as is also occuring in the 'Ain Dar area of Ghawar. There is no similar gas cap in the North Nose.
 Drilling 1996-2006: South Dome
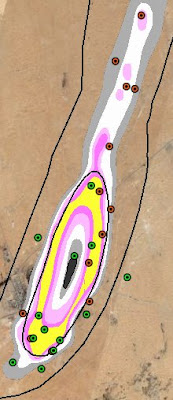
Using the ca. 1996 well inventory from the Lawrence paper, wells drilled subsequently can be identified. Shown at left is a closeup view of the oil thickness map for the South Dome with the locations of the more recent oil wells indicated. Indeed, most of the subsequent wells have been drilled in the thickest oil layer, including some being developed in 2006. Relatively fewer have been drilled towards the center of the gas cap. Of course, this area is coincidental with the location (hundreds of feet lower, of course) of the Hanifa reservoir as shown by the inner black oval. Distinguishing between oil wells drilled into the two reservoirs based on the satellite imagery is rather problematic, but those drilled well within the gas cap area are most likely targeting the Hanifa.
Two drilling rigs are visible. The one in the lower left is drilling a new well (or, at least newer than 1996), whilst the other is a rework of a pre-2006 well. Eleven new well sites are identified in this part of Abqaiq. Most of these will probably produce oil, but this can usually only be discerned after pipelines are connected. The two located near the bottom of the image, however, are certainly water injectors.
Using three low-resolution DigitalGlobe (preview) images dating to February 23rd and November (2nd and 20th) in 2007, additional well sites developed subsequent to 2006 are identified as distinct changes (localized color changes) from the high-resolution 2006 image. Tentative sites with no surface infrastructure in 2006 are identified as new wells, while activity at well sites existing in 2006 are identified as reworks. These are indicated in the figure at left as green and red placemarks respectively. Also shown again are the 1993 oil thickness contours and the perimeter of the lower-lying Hanifa reservoir (black oval). It is possible that some rework wells are actually new wells next to existing wells. As was the case in 2006, most wells are being drilled into either the thicker remaining oil layers in the Arab-D reservoir or into the Hanifa. Note that, because of the predominance of horizontal drilling, the actual oil target might be somewhat removed from the wellhead geographic location.
Flooding the Basement: Hanifa Water Injectors
As discussed in the O&GJ article cited above,a serious effort to produce oil from the Hanifa reservoir commenced in the early 1990s. The plan was to employ horizontal water injection wells placed peripherally around the Hanifa reservoir to enhance production from a combination of new horizontal and existing vertical wells drilled updip. A figure indicating the planned positions of wells was included in the article, but a position match of these with wells identified using Google Earth could not be made. 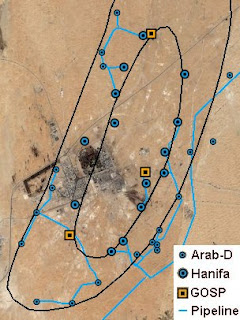 Instead, it was found that Hanifa injectors could be identified directly, as shown in the figure at right, by tracing pipelines from other injectors and also by visual identification. A total of 14 wells feeding water into the Hanifa have been identified (most of which were not present in the 1996 Lawrence well inventory cited above). Water use for injection comes from three different sources. Seven injectors on the eastern side of the field draw water from the main trunklines which trasport seawater to Shedgum/Ghawar. On the northwest side, three wells inject produced water coming from a gas-oil separation plant. Finally, four wells are found to be stand-alone injectors, as described below.
Water Hazard
One interesting part of the injection system for Hanifa is the use of stand-alone water injector wells. The oil water contact (OWC) for the southwest part of the Hanifa field underlies a populated area, and there is some danger associated with having high pressure water pipelines crossing these areas. In addition, gravity-fed injection (used for the Arab-D injectors near the Aramco compound) was deemed unsuitable for Hanifa due to the poor flow characteristics. 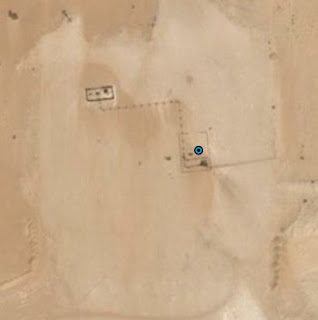 Instead, dual-function wells were employed which both withdraw water from an aquifer and then inject it into the target reservoir assisted by an electric pump (see PROC SPE ANNU TECH CONF EXHIB. Vol. PI, pp. 619-623. 2000). One of these wells is shown at right. It does seem odd that pressurized water would be considered more of a public health hazard than pressurized oil with hydrogen sulfide dissolved in it, but the GOSPs in Abqaiq take in oil at about 400 psi whereas the water is probably being injected at over 2000 psi.
The Coupled Reservoir Problem
Having more than one reservoir from which extract oil without having to leave the field you are in would seem to be a good thing. However, complications arise when the reservoirs are somehow linked. For Abqaiq, this linkage exists in the form of small fracture channels across several hundred feet of the Jubaila formation. This has been suspected for quite some time, as the pressure in the little-produced Hanifa seemed to track that in the Arab-D. It is theorized that a late-Cretatious upwelling, possibly due to salt diapirism, resulted in fracturing of the older Jurassic layers (Hanifa/Jubaila/Arab). This might have occured after oil had collected in the Hanifa such that the fractures then permitted oil to migrate into the Arab-D, although the exact sequence of geologic events is not easy to ascertain. In any event, the situation that developed is one in which a common (with respect to the vertical) Oil Water Contact existed in the two reservoirs prior to production. This is shown in the diagram below.
This represents the equilibrium case. As water is injected peripherially into one of the reservoirs, the restricted flow through the fractures will push the OWC of that reservoir past that of the second. This can lead to water inclusion in pockets in the second reservoir, potentially stranding oil. As oil is produced from Arab-D wells, reduced pressure near the wellbore can cause upward migration of Hanifa oil if fractures are in close proximity. The desire to avoid this scenario has likely constrained production from the Arab-D in recent years, especially so because of the presence of the central gas. These challenges have been described in the following 2007 SPE paper: Development of a Dual Media Full-Field Simulation Model to Optimize Injection/Production Strategy for Two Communicating Mature Carbonate Reservoirs. (SPE 105277)
Status of Hanifa Waterflood
One indication that the Hanifa waterflood has not been successful is the lack of significant production as reported by Saudi Aramco. Also, the 2006 SPE paper Smart Well Completion Uses Natural Reservoir Energy to Produce High-Water-Cut and Low_Productivity_index Well In Abqaiq Field (SPE 104227) details many of the difficulties, including inadequate pressure support by the peripheral injectors, due to the limited rock permeability, and low productivity and early watering for most wells. SPE 104227 also describes a single, well drilled at the field crest through the Arab-D gas cap into the Hanifa reservoir in 1998. This well could only be produced intermittantly as the pressure would decrease below the bubble point. Its output declined 50% from its starting rate by 1999, started producing water and decliend further, and was subjected to acid treatment in 2003. This bumped up production, but began decreasing degenerating rapidly again. In Dec. 1994, the well was worked over to employ gas lift technology to raise the oil out of the Hanifa, making use of the Arab-D gas cap. This has enabled stable production at about 2000 barrels/day with an equal amount of produced water. This is presented as a success story, although the long-term viability is uncertain and there are finite limits on how much gas pressure is available for this.
SPE 105277 also relates problems with uneven waterflooding of the Hanifa, with fractures allowing water to flow preferentially through numerous corridors towards the center. Coupled with the finding that fractures also account for 95% of the productivity from the Hanifa, placing horizontal wells as to avoid them has drawbacks. The solution has been to try to model behavior of the dual-reservoir system and adjust water injection rates accordingly while still trying to keep the Hanifa flood front even with that of the Arab-D. Many more producers were planned as of the writing of the paper.
Implications for Ghawar and Khurais
The dual-reservoir problem discussed above is directly relavent to the development of and production from the Khurais oil field in that the same geological assembledge exists there. One big difference between Khurais and Abqaiq in this respect, though, is that the overlying Arab-D in the former is of much lesser quality. How this would change the dynamics between the two reservoirs is not known.
In the Ghawar oil field, the Hanifa formation enjoys notoriety, not as a potential stash of oil, but rather as the source of water for what is called the Shedgum Leak Area, groups of wells well above the injection line which started producing water early in their life. Water flows up fractures across the Jubaila. The extent that this has impacted production in Shedgum is unclear, or whether pressure communication with the Hanifa will cause further difficulties as the Arab-D depletes further.
Recent Development in the North Nose
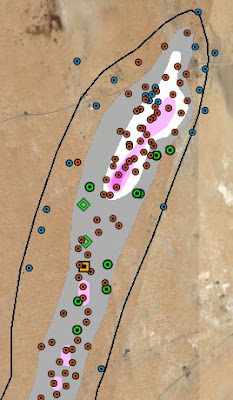 Shown at right is the northern portion of Abqaiq with the 1993 oil thickness contours superimposed on the 2006 satellite view and oil well inventory. Red placemarks correspond to operating wells, green placemarks to new well sites, and diamonds to drilling rigs (both of which are drilling new wells). The amount of recent activity is surprising given the depletion level of this part of the field in 1993. It is also interesting that most of the new wells are placed where oil thickness is (was) smaller as opposed to the crest.
There are several publications describing the drilling projects which have been undertaken to maintain production from this area:
SPE 110979: Technological Applications Redefining Mature Field Economic Limits
Multiphase Pump Recovers More Oil in a Mature Carbonate Reservoir
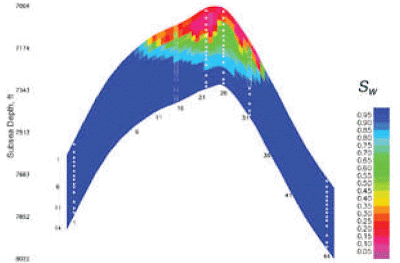 One graphic found in the latter reference, shown at right, is probably familiar to many readers as it has been used to provide a dramatic visual example of reservoir depletion. This figure shows depth-distributed water saturation values in an east-to-west vertical slice (click to enlarge). The figure has often been misinterpreted in that the red areas at top do not correspond to a gas cap (as the north of the field does not have one) but rather to rock which still as minimal water saturation. It is not known exactly where in the north this cross section relates to, although a good guess would be somewhere in the vicinity of the manifold wells discussed in the text. Note the very large saturation values for the depleted portions of the reservoir (~90%). This translates into much less oil left behind as compared to Ghawar (10% in Abqaiq vs. 25-35% in Ghawar). While this is good news for Abqaiq, and also explains the high expected recovery rate, the implication for Ghawar is that it is not reasonable to conclude that its recovery rate will be similar. Show below is a similar (simulation) slice in northern 'Ain Dar (Ghawar) as discussed here.
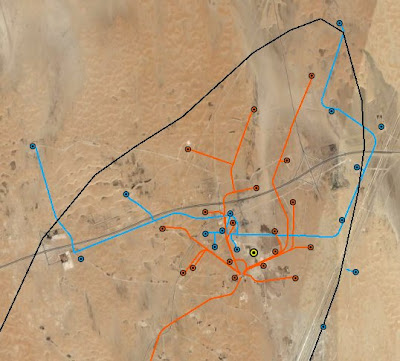 The main focus of the Multiphase Pump paper is on a successful attempt to rehabilitate a group of wells in the North Nose in which the pressure of produced oil was too low to make it through a connecting manifold and down the pipeline to the nearest GOSP. These wells are identified in the figure at left as red placemarks with the oil pipelines indicated with red traces. As of 2006, all but one of these wells are still connected by pipeline to the manifold. A number of other wells, shown with blue placemarks, are instead connected to each other and to pipelines for water injection (blue traces).
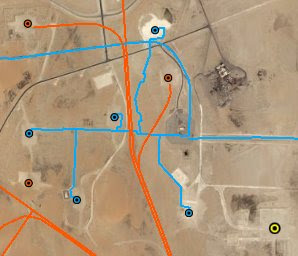
The cluster of injectors somewhat centrally located amongst the manifold wells seems a marked departure from the use of peripheral injectors, perhaps indicating that the latter approach is no longer sufficient for maintaining pressure at the wellbores. Also visible in the image at right is the only non-associate gas well in Abqaiq, indicated with the yellow placemark in the lower right corner. This well, drilled in 2003, doesn't appear to be connected to anything, but the well ID (ABQQ-480) is of note because it suggests that it was the 480th well placed in Abqaiq when it was spudded.
In general, the picture that emerges is one where the remaining oil in the Arab-D reservoir lies predominantly in the top 40 or so feet of the reservoir. This has led to the recompletion of many existing vertical wells by shutting off the lower wellbores and adding short horizontal sidetracks to extract oil from the thin layer at top. This has been used in the South Dome area as well, but with less success as the increased number of fractures in that area adds risk of early watering.
North Nose in 2007
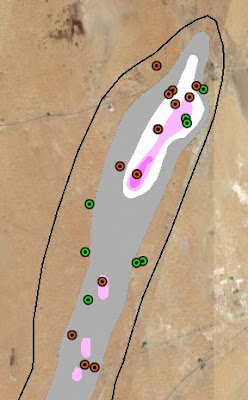 Again using low-resolution 2007 DigitalBlobe images, locations of new and reworked wells were identified as shown at right. This picture also seems to suggest that a combination of new and recompleted wells in the (presumed) oil-bearing areas along with new water injectors are still being deployed in north Abqaiq. Green and red placemarks denote activity at new and previously existing sites respectively.
Conclusion
Analysis of satellite imagery and correlations with technical publications has helped to build a more complete picture of the reservoirs of Abqaiq and of recent efforts to get more oil out. A similarity with the Khurais field, specifically the presence of two connected reservoirs of dissimilar quality (Arab-D and Hanifa), portends potential difficulties as Khurais depletes. In contrast, the rather anomolously high final water saturation for Abqaiq vs. Ghawar suggests that expecting similar recovery rates with the latter is perhaps expecting too much.
Previous entries in The Oil Drum, Satellite Edition:
- Satellite o'er the Desert
- Intro to Satellite Sleuthing 101: Finding Haradh III
- Khurais Me A River
- Happenings in Harmaliyah
- Ghawar Numerology: Drilling in Uthmaniyah
Previous TOD entries on Abqaiq:




Key Question.
The first graph suggests production of 49% of OOIP in 2006. However the 1993 'yellow ring' plots and the later cross section data suggests a much greater production of oil - well into the later percentage numbers. The shape of the decay in production after the early 90s backs that up.
Which are we to believe ?
Many things are not known, including the scale for the 1993 oil thickness maps (or "yellow ring plot"). Even in regions outside the gray area, there is maybe 40' of oil. Then, there is Hanifa, which hasn't been depleted that much. More than 50% of the Arab-D has been produced. Finally, the cross section from the north might not be representative of the south.
Even if everything else was full zone 1 thickness, that's still just 1.9Gbarrels. Even if the yellow area is full thickness remaining, it still looks by eye to be well past 60-70% - and that's 1993, let alone now. Hanifa from your own words looks to be based on some serious wishful thinking in terms of projections vs troubles encountered.
what is uerr ? i am assuming it means ultimate economic recoverable reserves ?
but that is ksa speak.
recoverable reserves are taken, by the sec at least, to mean remaining reserves. oil that has already been produced is not called reserves.
maybe uero (ultimate economic recoverable oil)would be more definitive.
UERR is somewhat of a contradiction.
I hear ya, Gary. Using their production figures, an additional 2.9 Gb was produced from 1993-2006, and that had to come from somewhere. They had a similar thickness map (though with 3D perspective) from 2006 that had less yellow but still there.
I hope you will help us get some eyes for this work...use the available "Share This" buttons, or here is the direct reddit link:
http://reddit.com/info/6jij0/comments/ (science)
This really helps us folks, we appreciate it.
Hello JB,
Fantastic work! IMO, it adds further urgency for the world to go to full-on Peak Outreach, Matt Simmons' suggestion for global FF-auditing transparency, Hirsch's mitigative changes, and the ASPO Depletion Protocol. Time will tell.
Bob Shaw in Phx,Az Are Humans Smarter than Yeast?
A fantastic analysis given the fact that you are working on very limited available data to put together the best picture possible of the current state of these reserves. As fantastic as it is, I can't help but be terrified reading your analysis and looking at the various visual representations. If you have landed anywhere near the mark (and it's very convincing you have), it seems 'Twilight in the Desert' may be much closer to Midnight than we think.
It's been mentioned many times by those here on this site that technology has the potential to levitate flow rates past 50% depletion. One wonders how rapid the decline curve might be if high flow rates were maintained until 70-80 percent or more of these resources were depleted?
JB -
Fascinating post. Love your titles, too - they're the only remotely amusing part of your posts.
Whats next? How about "Shedgum? Damn near killed 'em!"
I know, I hated to add the parens to it (so when people see just the title in the feeds, they actually have a clue as to what it's about...). :)
Much thanks.
I was thinking of "Saud Berri Field Forever", but I haven't found a way to see underwater yet. Maybe when Google Sea is released.
Isn't part of Berri onshore, though? And are you serious about Google Sea? That would be Party Time!
Was going to gripe about the awful puns too. Groannnnnnnnn! I'm a big Julie London fan as well. How 'bout Ghawar, Me Mateys? Ain Dar There Were None? Man, Ifa We Ever Find a Way to Remove All This H2S...?
No, I'm not serious about Google Sea. That would be fun, though -- look for old shipwrecks from your computer. Definitely more lucrative. Easy Street, in fact.
I like your Ghawar suggestion, and your 'Ain Dar one gave me an idea. (hint: apropos with this post)
JB
That's what you think.
http://www.news.com/8301-10784_3-9931412-7.html
Boss! Meet you guys at the nearest black smoker.
Arrr! There's gold down thar!
Google Earth Shipwreck Overlay
background on the above
I can't help but think, what a fantastic study and analysis...and JoulesBurn armed with only the google earth tool for observation...what our government must know on this as well.
You don't get promotion by telling the boss what he doesn't want to hear.
Large organisations develop a 'party line' which you can't deviate from, or find evidence against.
Human nature being what it is, people even come to believe it themselves.
The Weapons of Mass Destruction thing was the most egregious example recently - everyone convinced each other, rather than directly lying, I think.
Matt Simmons called Abqaiq, the "Dowager Queen." In his analogies Ghawar was the king.
In Simmons' book, "Twilight in the Desert," Ali Naimi (S.A. oil minister) was quoted as stating in 2002: "Abqaiq had produced 70% of its total reserves." (pg. 184).
The net reservoir thickness of Hanifa was rumored to be less than the 300 foot gross interval stated above.
I'll leave it to subjects of monarchies to debate the relative merits of kings and queens.
The 70% Ali Naimi figure is not that far off from what Saleri has in the figure at top (71% of UERR in 2006). He is usually much worse with numbers.
One reference for the Hanifa thickness that I dug up (ha ha!) is here.
The gross thickness of the stratagraphic sequence of a reservoir was sometimes reported after discovery and delineation drilling. According to Simmons' opinion the stratagraphic unit is not homogenous in its composition. From his viewpoint he reported that a small percentage of the unit was more productive whenb compared to the whole unit. Am not sure if he had enough reports to cover his story. Would recommend the book for your library if you do not have it already.
From your production curve it is clear that Abqaiq is a mature field in a terminal decline. Some yet wish for technology to improve and for the large amounts of oil left in the ground to be produced. Drill core samples have shown that after a field is tapped out, it yet had oil in it. Thanks for your report.
I said I'd "Name Names" when I had them. here goes:
Handling the Ethanol smear campaign for the oil companies -
DUTKO WORLDWIDE
Clients/connections include: Citgo, Shell, Exxon Mobil, etc., etc.,
SAUDI ARABIA, and Sen. John McCain.
On the Grocers' side it's GLOVER PARK GROUP.
http://grassley.senate.gov/public/index.cfm?FuseAction=PressReleases.Det...
Grassley names names.
This was a highly inappropriate place for your post, and as such there will be no other response here from me.
For the record, kdolliso, a corn ethanol shill, made an accusation (last week?) that Big Oil is funding a campaign to smear ethanol companies. I challenged him to back it up, and he couldn't. But he promised that he would, because when he smears someone, he thinks he should back it up. Sometimes. After the fact. If he can dig up something remotely relevant.
Now, look what he has provided. There is no link. There is a company name, and an allegation that the same company has clients from oil companies. There is no actual evidence of what this company did, nor who hired them. This is kdolliso at his most shameful, and it shows his comical bias. When the subject is smearing oil companies or making wild claims about ethanol companies, his burden of proof is laughably low. If the subject is countering accusations against oil companies or demonstrating negative things about the ethanol industry - his burden of proof is remarkably high. For instance, an unvalidated claim by a company with a vested interest has been OK by him when they were pro-ethanol. On the other hand, he rejected peer-reviewed papers that were anti-ethanol. You see, he fancies himself as qualified to overrule those peer-reviewed conclusions.
Note that he pulled the same stunt with Tad Patzek. Professor Patzek has a lab that does oil modeling and such. Because the lab is funded by oil companies, kdolliso felt like it was perfectly OK to suggest that Patzek gets hundreds of thousands of dollars for lobbying on behalf of oil companies. So much for kdolliso's ethics. That's why I think he is really an ethanol lobbyist. In fact, I have proof:
LOBBYISTS FOR ETHANOL
Clients/connections include: ADM, CARGILL, kdolliso, Osama bin Laden, and Sen. Chuck Grassley
Please do us all a favor and get out of the gutter. Your posts of late have slid off into absurdity.
Inappropriate Place?
It's a thread about SAUDI ARABIA!
Just google any of the above companies (or Saudi Arabia, or John McCain) and Dutko Worldwide.
I gave a link to Grassley's statement. You think he's lying?
Google Glover Park Group/Grocers Association. It originated in a "Roll Call" article; and, now, it's all over the internet.
Have a "Nice Day."
p.s. I'm Not a "Lobbyist" for Anyone.
Joules,
That is stellar work, even if I don't follow all of the details. Great writing too -- clear, with your points so well-supported that it seems like it would be futile to argue or deny.
Inspirational stuff.
Go and Digg it here:
http://digg.com/general_sciences/Abqaiq_and_Eat_It_Too_Geological_Analys...
FYI... The precipitous 300,000 bbl per day decline in Abqaiq oil production in 1980 was due to a catastrophic explosion at a northern Gas Oil Separation Plant (GOSP) and the subsequent loss of this process facility. The GOSP was rebuilt in the mid-1980s accounting for the "surge in production" during this period. I was the petroleum reservoir engineer on the field at the time of the disaster.
Very interesting. Thank you.
Please feel free to point out any misconceptions I have about this field which you have much first-hand knowledge.
JB
The above quoted Saleri slide presentation contains also a graph showing cumulative production from the Arab D of 11.1 Gb versus a 13.9 Gb of EURR, which means it was 80% depleted in 2006. It is interesting to note that at this depletion level, production is dropping off by almost 50% from around 400 Kb/d to 200 Kb/d in just 6 years between 2006 and 2012. Reserve growth is shown to be 27% between 1970 and 2006 or 0.8 % pa, against a depletion rate of around 6% in 2006.
That gives us an idea of both decline and depletion rates involved.