| Andris Piebalgs on European Energy Security | The Oil Drum: Europe | French PM warns that we are running out of oil |
Arctic Oil and Gas Ultimates
Posted by Luis de Sousa on March 11, 2008 - 11:00am in The Oil Drum: Europe
In the context of this article the Arctic is defined as the area of the globe with latitudes north of 66° 33’ 39’’, the present polar circle with an obliquity of 23° 26’ (that can vary from 22° to 24° 30' during a 40 000 years cycle). The Arctic can be also defined as the isotherm of <50°F any month of the year. Both definitions mean that Arctic area is changing slowly with time.
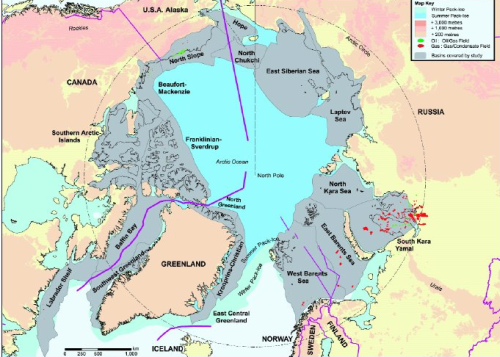
The Arctic and its hydrocarbon resources. Source believed to be Wood Mac. Click for large version.
Using the IHS database (February 2007) Arctic fields and New Field Wildcats (NFW) were extracted for Russia, Europe (Norway and Svalbard) and North America (US and Canada).
Russia
Reserves are estimated in CIS using the Russian classification as ABC1 (corresponding to the maximum theoretical recovery or 3P)

Russian Arctic creaming curve.
There are clearly two distinct cycles. A third cycle offshore the Eastern Siberia coast is unlikely or with small potential, looking at the onshore results. The USGS ultimate estimates for the Laptev sea shelf (FS2007-3096) are at 3 Gb for Oil, 0.8 Gb for Condensate & 36 Tcf for Natural Gas.
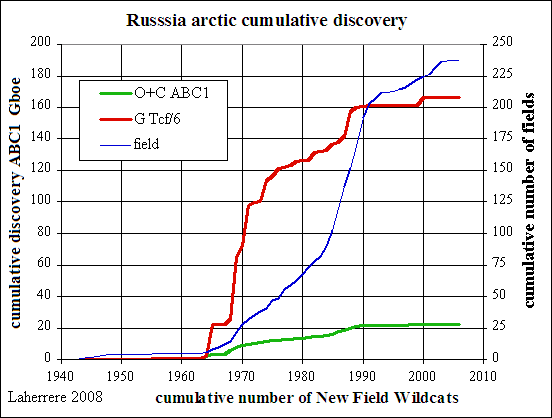
Russian Arctic cumulative discovery.
ABC1 reserves need to be corrected to 2P (proven+probable). The best way to do so is looking at the estimate for Urengoy, called in the past the world's largest gas field (although North Dome in Qatar/Iran is much larger). Urengoy (at a latitude of 66°03’, is close to the polar circle) is reported as having more than 350 Tcf, but when plotting the decline it points to less than 250 Tcf.
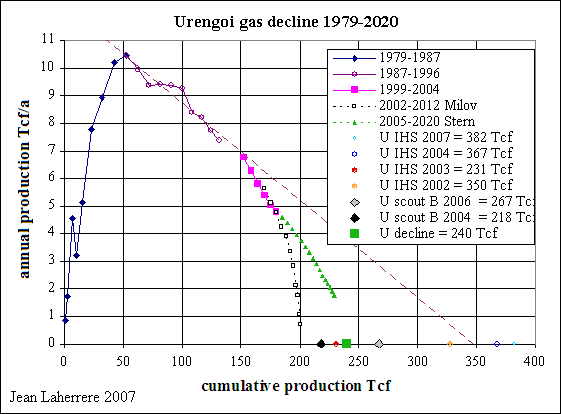
Urengoy Natural Gas decline.
Europe

Norwegian Arctic creaming curve.
Several cycles mark the discovery in Norway. New cycles are possible but of small size because the results in the Barents sea have been poor so far.
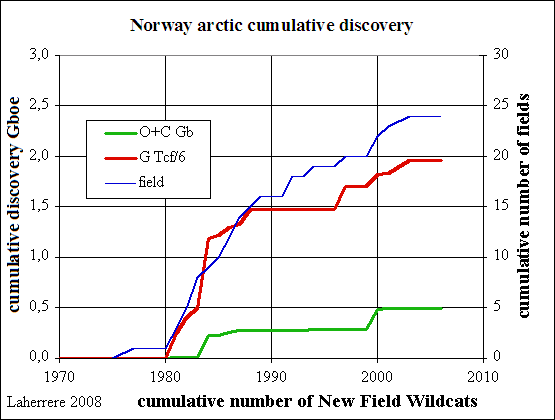
Norwegian Arctic cumulative discovery.
In addition to Norway and Svalbard, there is potential in Greenland. In its 2000 world assessment, the USGS estimated the East Greenland undiscovered volume at 47 Gb for Oil, just by guessing the number of discoveries to be expected (range 1, 250, 500) and size (range 20, 85, 12 000 Mb) without any seismic or well data, just plain analogy with the North Sea. The estimates for undiscovered Condensate were 4 Gb and 81 Tcf for Natural Gas. This exaggerated estimate was reduced in 2007 (FS 2007-3077) by updating East Greenland to 9 Gb for Oil, 8 Gb for Condensate and 86 Tcf for Natural Gas.
North America
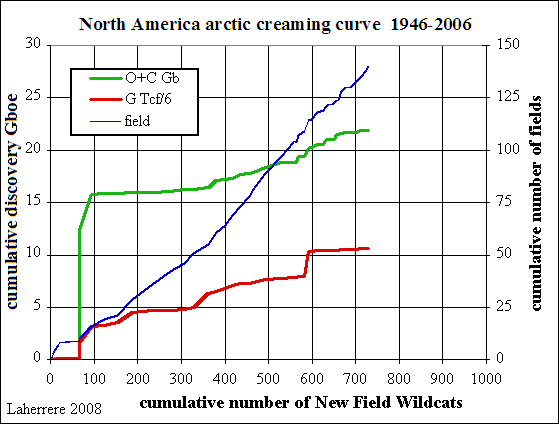
North American Arctic creaming curve.
There are several cycles in the creaming curve, with a possible future one but of small size. On February 6th of 2008, the US sold 488 leases in the Chukchi sea, totalling 2.2 G$; most leases were bought by Shell and Conoco. In 1989 and 1990 4 dry holes were drilled in this area plus a gas discovery at Burger (14 Tcf) which was relinquished by Shell in 1996. Shell bought back the Burger lease for 105 M$ (about the cost of one well in this area). The cost of the famous Mukluk dry hole in 1983 in the shallow waters of the North Slope was over 1 G$.
The USGS published in 2005 a report (FS2005-3043) on the central part of Alaska - Central North Slope – putting undiscovered Oil and Natural Gas resources at 4 Gb and 37 Tcf. In addition to that there's the potential of 7.7 Gb and 4 Tcf for the Arctic National Wildlife Refuge (ANWR) (FS2005-1217) and also at the National Petroleum Reserve in Alaska (NPRA). The KIC well drilled in 1985 in the ANWR is still confidential, despite the rule of becoming public after only a few years! All these estimates seem in disagreement with the creaming curve. But the USGS past approach since 2000 has been too optimistic, where only one geologist is simply guessing solely the number of discoveries and the size to be forecast (seventh approximation sheet) and then a Monte Carlo run (50 000 transforms) These wild guesses result into a beautiful distribution that looks real. A better approach should be hoped for, based on the complete past data reviewed by several geologists.
The closest developed field to ANWR is Badami, operated by BP, with an initial estimate of 120 Mb for 300 M$. It was abandoned in 2003 after 4 years of production, totalling 4 Mb with a peak of 3150 b/d in 1999, ten times less than expected! For the Mackenzie delta (FS2006-302) the USGS estimates undiscovered Oil at 10 Gb, Condensate at 4 Gb and Natural Gas at 87 Tcf.
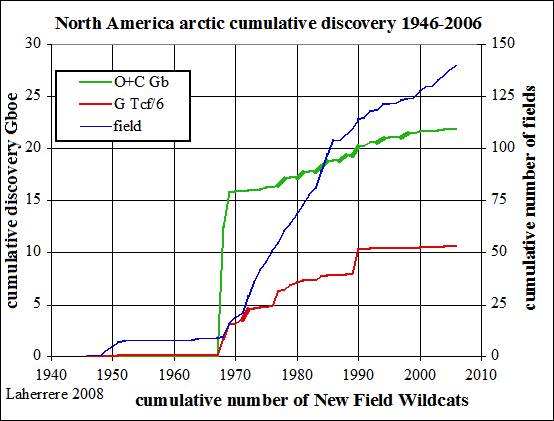
North American Arctic cumulative discovery.
World
Adding the three regions above - after correcting the Russian ABC1 to a mean value by reducing 30% - give the world Arctic potential.
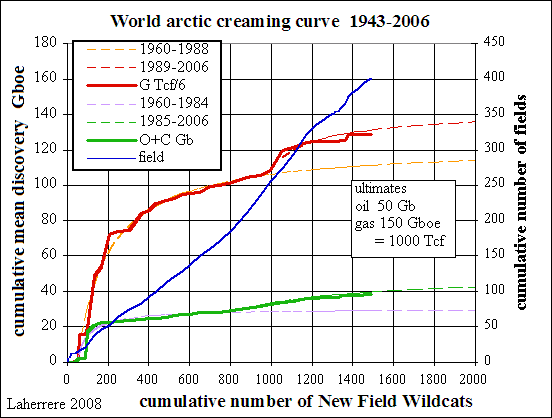
World Arctic creaming curve.
Two cycles can be modelled (1960-1988 and 1989-2006 for Natural Gas, 1960-1984 and 1985-2006 for Oil) A third cycle is likely to be of a size lower than the accuracy (bad in Russia) of the present discoveries. The creaming curve is flattening for both oil and gas cumulative volumes, but not for the number of fields, which present a linear display since 1943. Only small fields are likely to be found in the future.
The ultimate is estimated to be 50 Gb for Oil and 1000 Tcf for Natural Gas. For Oil this estimate is very close to Colin Campbell's 52 Gb value, but it is less than half CERA's 2007 estimate (118 Gb). It is equal to about the potential given only for East Greenland (47 Gb) in the USGS 2000 report.
The USGS did not assess the global Arctic, only several Petroleum Systems, but a new study called “The Circum-Arctic Oil and Gas Resource Appraisal” is planned for the summer of 2008. The Wood Mackenzie and Fugro Robertson 2006 report estimates the Arctic containing only 3% of the world’s oil (with 80% of the Arctic potential being gas).
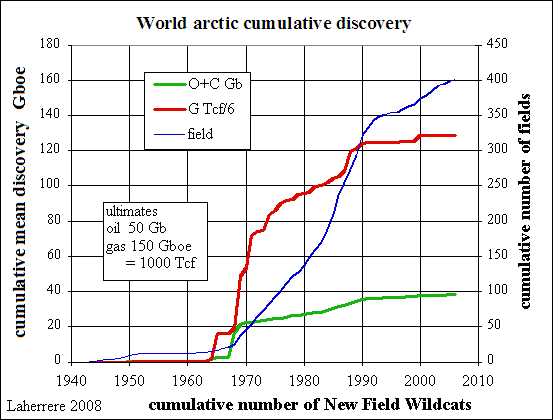
World Arctic cumulative discovery.
Conclusion
The Arctic oil and gas potential has been fairly well explored since 1943 and displayed several cycles with little discovered volumes since 1990 (despite 75 discoveries in number of fields). Known discoveries have three times more gas than oil. Most of the Arctic gas reserves are stranded (Prudhoe Bay) gas pipes from such remote places are very expensive and will be built only in a decade.
The recent attempt by the Russians to claim the North Pole is attributed to oil and gas potential. The only seismic line on the Arctic Sea I know of is from a study by the IODP:
Arctic oil and gas will not change much the coming world peak oil and gas!
Previously at The Oil Drum : Europe: Interview with Jean Laherrère
The Oil Drum : Europe is once more grateful to Jean Laherrere for sharing his experince with us.

The Arctic and its hydrocarbon resources. Source believed to be Wood Mac. Click for large version.
Using the IHS database (February 2007) Arctic fields and New Field Wildcats (NFW) were extracted for Russia, Europe (Norway and Svalbard) and North America (US and Canada).
Russia
Reserves are estimated in CIS using the Russian classification as ABC1 (corresponding to the maximum theoretical recovery or 3P)
Russian Arctic creaming curve.
There are clearly two distinct cycles. A third cycle offshore the Eastern Siberia coast is unlikely or with small potential, looking at the onshore results. The USGS ultimate estimates for the Laptev sea shelf (FS2007-3096) are at 3 Gb for Oil, 0.8 Gb for Condensate & 36 Tcf for Natural Gas.
Russian Arctic cumulative discovery.
ABC1 reserves need to be corrected to 2P (proven+probable). The best way to do so is looking at the estimate for Urengoy, called in the past the world's largest gas field (although North Dome in Qatar/Iran is much larger). Urengoy (at a latitude of 66°03’, is close to the polar circle) is reported as having more than 350 Tcf, but when plotting the decline it points to less than 250 Tcf.
Urengoy Natural Gas decline.
Europe
Norwegian Arctic creaming curve.
Several cycles mark the discovery in Norway. New cycles are possible but of small size because the results in the Barents sea have been poor so far.
Norwegian Arctic cumulative discovery.
In addition to Norway and Svalbard, there is potential in Greenland. In its 2000 world assessment, the USGS estimated the East Greenland undiscovered volume at 47 Gb for Oil, just by guessing the number of discoveries to be expected (range 1, 250, 500) and size (range 20, 85, 12 000 Mb) without any seismic or well data, just plain analogy with the North Sea. The estimates for undiscovered Condensate were 4 Gb and 81 Tcf for Natural Gas. This exaggerated estimate was reduced in 2007 (FS 2007-3077) by updating East Greenland to 9 Gb for Oil, 8 Gb for Condensate and 86 Tcf for Natural Gas.
North America
North American Arctic creaming curve.
There are several cycles in the creaming curve, with a possible future one but of small size. On February 6th of 2008, the US sold 488 leases in the Chukchi sea, totalling 2.2 G$; most leases were bought by Shell and Conoco. In 1989 and 1990 4 dry holes were drilled in this area plus a gas discovery at Burger (14 Tcf) which was relinquished by Shell in 1996. Shell bought back the Burger lease for 105 M$ (about the cost of one well in this area). The cost of the famous Mukluk dry hole in 1983 in the shallow waters of the North Slope was over 1 G$.
The USGS published in 2005 a report (FS2005-3043) on the central part of Alaska - Central North Slope – putting undiscovered Oil and Natural Gas resources at 4 Gb and 37 Tcf. In addition to that there's the potential of 7.7 Gb and 4 Tcf for the Arctic National Wildlife Refuge (ANWR) (FS2005-1217) and also at the National Petroleum Reserve in Alaska (NPRA). The KIC well drilled in 1985 in the ANWR is still confidential, despite the rule of becoming public after only a few years! All these estimates seem in disagreement with the creaming curve. But the USGS past approach since 2000 has been too optimistic, where only one geologist is simply guessing solely the number of discoveries and the size to be forecast (seventh approximation sheet) and then a Monte Carlo run (50 000 transforms) These wild guesses result into a beautiful distribution that looks real. A better approach should be hoped for, based on the complete past data reviewed by several geologists.
The closest developed field to ANWR is Badami, operated by BP, with an initial estimate of 120 Mb for 300 M$. It was abandoned in 2003 after 4 years of production, totalling 4 Mb with a peak of 3150 b/d in 1999, ten times less than expected! For the Mackenzie delta (FS2006-302) the USGS estimates undiscovered Oil at 10 Gb, Condensate at 4 Gb and Natural Gas at 87 Tcf.
North American Arctic cumulative discovery.
World
Adding the three regions above - after correcting the Russian ABC1 to a mean value by reducing 30% - give the world Arctic potential.
World Arctic creaming curve.
Two cycles can be modelled (1960-1988 and 1989-2006 for Natural Gas, 1960-1984 and 1985-2006 for Oil) A third cycle is likely to be of a size lower than the accuracy (bad in Russia) of the present discoveries. The creaming curve is flattening for both oil and gas cumulative volumes, but not for the number of fields, which present a linear display since 1943. Only small fields are likely to be found in the future.
The ultimate is estimated to be 50 Gb for Oil and 1000 Tcf for Natural Gas. For Oil this estimate is very close to Colin Campbell's 52 Gb value, but it is less than half CERA's 2007 estimate (118 Gb). It is equal to about the potential given only for East Greenland (47 Gb) in the USGS 2000 report.
The USGS did not assess the global Arctic, only several Petroleum Systems, but a new study called “The Circum-Arctic Oil and Gas Resource Appraisal” is planned for the summer of 2008. The Wood Mackenzie and Fugro Robertson 2006 report estimates the Arctic containing only 3% of the world’s oil (with 80% of the Arctic potential being gas).
World Arctic cumulative discovery.
Conclusion
The Arctic oil and gas potential has been fairly well explored since 1943 and displayed several cycles with little discovered volumes since 1990 (despite 75 discoveries in number of fields). Known discoveries have three times more gas than oil. Most of the Arctic gas reserves are stranded (Prudhoe Bay) gas pipes from such remote places are very expensive and will be built only in a decade.
The recent attempt by the Russians to claim the North Pole is attributed to oil and gas potential. The only seismic line on the Arctic Sea I know of is from a study by the IODP:
The scientific inspiration that subsequently led to ACEX surfaced aboard F/S Polarstern in 1991 when two reflection seismic profiles (AWI-91090 and AWI-91091) were acquired by Wilfried Jokat and Yngve Kristoffersen across the Lomonosov Ridge between 87° and 88°N. These profiles show a neatly draped sediment sequence being over 400 m thick, at a modest water depth of ca 1200 m, which were considered to represent an undisturbed and continuous record of lower Eocene to Recent sediments.A thickness of 400 m is not enough for a real oil and gas potential. The Russian's move seems to be more connected to controlling sea navigation.
Arctic oil and gas will not change much the coming world peak oil and gas!
Previously at The Oil Drum : Europe: Interview with Jean Laherrère
The Oil Drum : Europe is once more grateful to Jean Laherrere for sharing his experince with us.
Personnel
Editors
Contributors
Peak Oil Primers
Archives
- November 2010 (3)
- October 2010 (6)
- September 2010 (4)
- August 2010 (7)
- July 2010 (6)
- June 2010 (7)
- May 2010 (2)
- April 2010 (8)
- March 2010 (4)
- February 2010 (6)
- January 2010 (3)
- December 2009 (5)
- November 2009 (8)
- October 2009 (12)
- September 2009 (6)
- August 2009 (5)
- July 2009 (11)
- June 2009 (8)
- May 2009 (16)
- April 2009 (10)
- March 2009 (7)
- February 2009 (10)
- January 2009 (15)
- December 2008 (9)
- November 2008 (9)
- October 2008 (9)
- September 2008 (13)
- August 2008 (10)
- July 2008 (14)
- June 2008 (23)
- May 2008 (16)
- April 2008 (12)
- March 2008 (16)
- February 2008 (9)
- January 2008 (13)
- December 2007 (13)
- November 2007 (16)
- October 2007 (22)
- September 2007 (8)
- August 2007 (9)
- July 2007 (16)
- June 2007 (8)
- May 2007 (7)
- April 2007 (7)
- March 2007 (10)
- February 2007 (10)
- January 2007 (12)
- December 2006 (9)
- November 2006 (15)
- October 2006 (4)
- September 2006 (5)
- August 2006 (5)
- July 2006 (9)
- June 2006 (5)
- May 2006 (10)
- April 2006 (9)
- March 2006 (13)
Vital Trivia
License

This work is licensed under a Creative Commons Attribution-Share Alike 3.0 United States License.
Jean, it is not every day that we get someone with experience of the global oil and gas exploration and production industry and a leading figure in the ASPO movement posting on these pages. Your presence here is most welcome.
The Arctic map and your charts and prose pulls the Arctic prospectivity into a realistic focus. There are two major hydrocarbon provinces already discovered and exploited - the oil prone N Slope of Alaska (green oil fields) and the gas prone South Kara, Yamal province in E Siberia (red gas fields).
There are a few dispersed large discoveries in the E Barents Sea - Shtockman is likely the best known of these and in the W Barents Sea, despite the best endeavors of the enterprising Norwegians, the discovery record is poor - owing to Tertiary inversion of the basins, gas cap expansion of the existing reservoirs leading to loss of oil and breach of top seals.
The point you make about 400m sediment on the Lomonosov Ridge is well made - for our non-geological readers we need well in excess of 3000m of sediments to have source rocks (if they exist) buried to sufficient depth to achieve the temperature required to produce oil or gas. So this is propaganda for consumption by the financial press.
Your story of Badami - which I hadn't heard before - is also quite amusing. 3000 bpd - barely enough to keep the workers camp warm. But projects like this scar the psyche of companies like BP - already scarred by Mukluk where I recall Sohio (a BP subsidiary then) built an island from where to drill the well. These scars mould the behavior of the Majors - but not their rhetoric.
A comment on gas prospectivity - is that not dominated by the Yamal reserves and would it be wrong to extrapolate that to the whole arctic ocean basin? It’s rather like concluding the N Sea would be gas prone on the basis of the Groningen Field discovery.
And some questions about prospectivity and drilling logistics in the North Kara, Laptev, and E Siberian Seas. Do you know if any drilling has taken place there, are there source rocks and are the basins truly prospecitve? The area is under sea ice for much of the year - and will likely continue to be so for the foreseeable future. So, even if discoveries are made, will they be exploitable this century. Shtockman looks like it is at the limits of current endeavor.
The reply from Jean (no I'm not talking to myself - though that has been known to happen:-)
Maybe the Russians can do horizontal drilling from above 60 degrees to produce the oil between 59 30 and 60.
Maybe the Russians can do horizontal drilling from above 60 degrees to produce the oil between 59 30 and 60.
North of 60 is closer to the coast. Coastal shipping part of the year is easier in Russia than in Alaska and Canada. This might explain why north of 60 is more explored in Russia.
The Lower 48 Example: When Hubbert did his Lower 48 work in the Fifties, he found that a one third increase in URR, from 150 Gb to 200 Gb, delayed the projected peak by all of five years, from 1966 to 1971.
Interesting.
The Western civilization is based on cheap energy.
Arctic and off-shore oil is OK, but not CHEAP.
So here we are.
Russia DID NOT claim the North Pole. This sort of language implies that it claimed an area enclosing the North Pole. It only claimed the shelf in its SECTOR. So over 60% of the North Pole is in the domain of NATO.
Yes, good to see someone here that essentially produces half the referenced and cited (and high quality) graphs concerning oil depletion.
The one pressing question I always have is how the interpolated and extrapolated smooth lines get drawn on these figures. We all know that the oil production curves tend to use the Logistic as a fitting function, but we don't have a good handle on what most analysts use for discovery curves and creaming curves. In particular I have seen several references to creaming curves being modeled as "hyperbolic" curves yet find little in fundamental analysis to make any kind of connection.
Based on statistical considerations I am convinced that the discovery and creaming curves result from a relatively simple model that I have outlined on TOD. I have a recent post where I make the connection from dispersive discovery to creaming curves here:
http://mobjectivist.blogspot.com/2008/03/creaming-curves-and-dispersive....
In the following figure I apply the Dispersive Discovery function to one of the data sets on your graph. This function is simple to formulate and it produces a finite asymptote which you can use to estimate the "ultimate discoverable" (150 GBoe for NG in the following).

If in fact you use the same formulation for your extrapolation, I would be interested to know.
But I have a feeling you share the same frustration as I based on:
This sounds like the best model out there is some horribly complex Monte Carlo run that ends up being a SWAG. I do indeed agree that a better approach is needed and think we need a good model to start with.
A good model must be the most important. If for example an expontial growing function A(t) = constant1*exp(constant2*t) is used for modeling the future the future will show exponential growth. I guess a quite good model could be derived by using all known fields in the US and simulate the production if the fields are drilled starting with the best.
The reply from Jean:
I agree that the bigger the better, as the statistics improve and local geological variations play less of a factor.
Hi
This may be an inane question but I'll ask anyway
1/ Is this "Polar Oil" as referenced in this oilwatch monthly feb 2008
2/ If so why is it considered "Unconventional Production"?
Or is "Polar Oil" something completely different?
Thanks
Neven MacEwan B.E. E&E
@Neven911
1) Yes it is Polar oil as referenced in the oilwatch monthly. Arctic production is currently centered around North America
2) It is considered unconventional production because most of the arctic resource that is remaining is very difficult to produce due to the harsh and extremely remote conditions. In terms of the quality of the crude it is not unconventional. It would be best to split out the Arctic resources that can be produced in a reasonable amount of time and those that cannot, but unfortunately this is not possible due to a lack of data.
Rembrandt
Rembrandt
Thanks for that clarification, 'Polar' could have meant other things (some sort of polarised molecule), maybe we should call it Arctic Oil to avoid confusion.
Has anyone considered the amount of engineering that refineries worldwide are going to require to process the increasing proportion of sulfurous sour crude. This could contribute to refined product shortages in the near term from the graphs of declining sweet crude ive seen posted here.
Neven
Jean's reply to Neven911:
One thing the article did not seem to address is development times for the Arctic resource much less cost. I'd have to think even with the ice melting its going to be very hard to develop these resources. So development time lines would I think be decades into the future at best.
When the Arctic summer sea ice disappears in the next years
Lessons from the Arctic summer 2007
www.carbonequity.info/PDFs/Arctic.pdf
this will screw up the whole climate on the Northern hemisphere and beyond. Salinity, ocean currents, winds, temperatures, everything will change. And we have basically no idea how that will impact on us.
Extracting more oil from the Arctic will be the least of our problems then. The only useful thing we could do with any oil coming from there would be to grease the generators of millions of windfarms or to use diesel to transport solar panels and mirrors to their desert locations.
Our job will soon be to extract CO2 from the atmosphere. NASA climatologist James Hansen has moved the goal posts from 450 ppm CO2 concentration to 350 ppm, a limit we have exceeded already 20 years ago.
http://www.columbia.edu/~jeh1/RoyalCollPhyscns_Jan08.pdf
And if you think recent cold weather allows you to call off global warming, read here:
http://www.columbia.edu/~jeh1/mailings/20080303_ColdWeather.pdf
A good summary of our predicament is here
Climate Code Red
http://www.carbonequity.info/climatecodered/5keys.html
Hmmm... not so much, perhaps. Most people don't seem to be aware that 80% of the ice is already gone. It's been thinned out to a huge degree in the last decade. While the extent seen this last summer was astounding, it had already dropped in total mass by a huge amount due to losses in thickness. Where it will make a big impact is the albedo.
Then again, who knows where the tipping points are? At any rate, strange days ahead.
Cheers
The link to the Lessons from the Arctic paper doesn't work, it gives me a 404. I was able to get it by going to the main page, where it's linked, but I was asked for my name and email before I could access it.
At any rate, interesting stuff. Thanks for the pointers.
You offer this as proof?
Just look at the second and third charts. They are both flat from 1980 to today, down from 1998 (a big El Nino year) to today, down from 1980 to 1997 and flat from 1999 to today even ignoring the 2008 winter.
Then I ask why there is only one straight line through the first chart? That looks down from 1980 to 1994 and flat from 1990 to today.
The correlation between the temperatures in these charts and CO2 (up) is non existent. Even then correlation is not causation.
The CO2 'case' is predicated on delta(T) = K delta(CO2) but there is no such link shown in these charts and the noise looks bigger than any trend. The CO2 advocates pick their starting date at will and only ever draw a straight line - no curve fitting, no removal of outliers, no statistical analysis at all. Just start these charts 1 year later and see what happens to the slope on the flat line - by eye it halves. Read this to see how the past climate and CO2 has been fiddled:
http://www.warwickhughes.com/icecore/
If you have a copy take a look at Patrick J. Michaels' book 'Meltdown' figure 3.8. The chart is titled 'North Polar Region (60N to 90N) Winter Temperature Anomalies'. The chart shows the usual rising straight line from 1955 to 2000, but if you remove the single cold outlier in 1966 then the line goes flat. The 'Summer Temperature Anomaly' chart is flat all the way. Even the author didn't pick up on that. If a trend is dependent on a single data point then it's not a trend.
I've also read 'The Chilling Stars' by Svensmark and Calder. The cosmic ray/sun climatologists have a better fit with climate than the CO2 climatologists.
What I see is a political bandwagon with an agenda as long as your arm. It works for so many people at so many levels. Am I supposed to believe 'climatologist' Gore?
I won't even start on the IPCC's development scenarios - all based upon exponential growth. This is TOD. We do peak oil, peak gas, peak coal, peak food and the finite nature of resources. We don't do exponential.
Alan - thanks very much for these links. I just spent the last couple of hours reading this stuff.
For those interested in following the expansion and contraction of ice sheets The Cryosphere today is an excellent resource:
http://arctic.atmos.uiuc.edu/cryosphere/
Charts here show that the Arctic ice sheets are still growing in area (just) this Spring:
http://arctic.atmos.uiuc.edu/cryosphere/IMAGES/current.365.jpg
While the Antarctic ice area has already started to grow in area this Fall:
http://arctic.atmos.uiuc.edu/cryosphere/IMAGES/current.365.south.jpg
Not surprising then that the global sea ice anomaly has turned positive:
http://arctic.atmos.uiuc.edu/cryosphere/IMAGES/global.daily.ice.area.wit...
Note that all these are measuring sea ice area and not volume. The GW debate will most likely be interesting this year.
According to the link you posted, http://arctic.atmos.uiuc.edu/cryosphere/IMAGES/current.365.jpg
the ice anomaly is at it's lowest area when the sun is high in the sky during the summer, and at it's lowest when the sun is low in the sky in winter. If the ice pack was actually greater than it's average in the winter instead of smaller than it's average, it still would be bad. The warming effect of less ice is far greater in the summer than in the winter.
I wonder if you can parse the paragraph above or if you will say something like "Of course the ice pack is smaller in the summer!". Responding to what I did not say is so much easier and less psychologically threatening.
I would like data for Arctic Ocean salinity. It's easy to say that ice is forming earlier because the salinity is lower, but is that true? Is melting permafrost really making the ice form faster in the winter?
Hi Euan,
If you come back here, thanks for your consideration and all the great work you do on TOD. I don't think the global warming issue is settled yet. There is a serious noise problem in the data, and the nature of TOD is to test assumptions. If the climate models are correct then they would work over any time period - which they don't. It's a really interesting science but really too really to say either way.
And there is an interview about these serious developments on the Reality Report by Jason Bradford with Philip Sutton of Climate Code Red. The talk is titled: The case for a Sustainable Emergency
The MP3 is here: http://media.globalpublicmedia.com/RM/2008/02/SuttonBradford.20080218.mp3
and a transcript here: http://globalpublicmedia.com/sustainability_emergency
I think they are relevant to this discussion, because it is clear that we cannot afford to tap any of the oil or gas in the Arctic no matter how much there is and the less of it there is, then the less likely it will happen.
Given the way things tend to be in nature, I am quite sure it will turn out there will be sufficient remaining reserves of oil and gas about to dangle the carrot in front of humanity with the choice to take the easy option to burn the rest or the much harder but correct voluntary decision to refrain and begin the process of climate repair. In other words a global test of whether we are capable of making the right decision. It is better it is done this way, than if natural limits (to reserves & resources) do it for us.
lol, its like Superman visited the oildrum.. basically, anyway, I'm a huge fan of Jean's work.. excellent job mate! keep it up..
Jean, another question occurred to me. With ultimate oil of 50 Gb and gas 1000 Tcf are you able to place approximate figures on what has been produced to date to provide an idea on the likely size of remaining reserves?
I think it is too early to calculate the total recoverable oil from the Arctic. The Chukchi Sea leases have not been drilled yet.
http://www.mms.gov/alaska/cproject/Chukchi193/PNOS193/locator_mapSale193...
The Orphan Basin off the coast of Labrador was thought to contain more than 6 GB of oil, yet after one exploration well Shell was trying to withdraw from its participation in a continued drilling program.
Devon discovered oil offshore in the Mackenzie Delta area and Exxon and Imperial were buying leases in the Canadian Arctic offshore areas. There is not enough data to define the magnitude or lack of magnitude of the oil deposits there.
Greenland has been drilled with no commercial discoveries yet, more drilling was planned as there were hydrocarbons found.
The Russian sector of the Arctic Ocean has not been fully evaluated either.
Hubbert made his prediction after decades of oil production in the lower 48.
Jean's reply to Rainsong:
As noted above, Hubbert basically made two If/Then statements. If 150 Gb, then the Lower 48 peaks in 1966. If 200 Gb, then the Lower 48 peaks in 1971.
In any case, I was using the Lower 48 as an analogue to the world, i.e., it takes huge increases in URR to have a material effect on the timing of the peak.
What do you think of the following video:
http://video.google.ca/videoplay?docid=-6513264891119894588&q=genre%3ADO...
Or go to Google Video and google "Lindsey Williams Energy Non-Crisis".
Essentially he claims that there is a lot more oil in Alaska than is made publicly known, and that the US government has been suppressing information and production. Is this guy nuts?
Jean's reply to Abracadabra:
An old article on KIC-1
http://www.gasandoil.com/goc/company/cnn11977.htm
Filed under Oil Forecasts and Peak Oil Predictions
http://www.inspiringgreenleadership.com/blog/aangel/oil-drum-best-index#...
Some time ago Colin Campbell wrote that it was likely the huge
weight of ice during past ice-ages would have fractured the sealing-
caps in the majority of any oil wells that might have formed in this
region. In his view this means that not a lot of oil remains to be
discovered, although there should be quite a lot of natural gas.
It would be interesting to hear the opinions of some other oil geologists who regularly post on TOD.
Given Earth's crust is still rebounding from the last Ice Age and Greenland is currently suppressed by the mass of ice there, this makes sense - at least common sensically.
Cheers
Toad - I'm no so sure about this. Its true that when continents are loaded with ice that the land sinks and when it melts the land will rise again - its called isostacy. That's why Scotland is still rising following the last ice age :-) and England is actually sinking :-(
Its possible that you can get differential movements along faults that may fracture a top seal or gas cap expansion owing to depressurisation that may send some oil round the spill point. So its something that could happen but I wouldn't use this as an argument against finding oil or gas in the Arctic. Many of the prospective areas are off shore where most ice sheets will in any case be floating.
Consider this, following the end of the last Ice Age there was a massive submarine landslide off mid Norway called the Storegga slide. This will have resulted in a massive differential unloading of the sea bed. But the Ormen Lange gas field is still there intact, right in the middle of the source of the slide. The sediments ran out into the Atlantic basin. The main threat here is that another sub marine landslide (turbidity current) sweeps the Ormen Lange platform away - along with European energy security. This is not likely to happen by the way.
http://www.norsk-hydro.com/ormenlange/en/about_ormen/key_features/storeg...
I think development in the far norht must also be land based and it will get bogged down in melting permafrost with a shortening winter so that only direct gasification from platform to LNG tanker could be considered and his could be quite expensive. Pipeline building is a hard task even with stable, predictable weather.
I appreciate mention of the far north as that's where me and the wife both grew up (USA and Russia respectively) and I know what oil did for our economy and that my father worked on gold dredge and in lumber camps and such so that minerals and resource development are critical to livelihood despite envrionmental concerns, which are very high, especially for such a fragile arctic environment. However when all the oil or gold or whatever is gone nostalgia will be the name of the game in North Sea, Russia and Alaska and Canada in the coming years for all who were involved.
I learned on Fox News Channel the other day that there's plenty of oil for us in the Artic--more than is in the Middle East.
I think that trumps all the scientific analysis above.
Jean,
I join Euan in thanking you for posting here! I have read your work with great interest over the last few years. I was wondering if any European Nations have published estimates of oil and gas reserves which are similar to( but hopefully better than)the USGS World Petroleum Assessment done in 2000. Thanks.
Dennis Coyne
There is ~25 Gb for North America, ~25 for Russia, total 50 Gb of oil for the Arctic URR.
I know that Prudhoe Bay produced 10 Gb and ANWAR is supposedy 10 Gb?
CERA gives 5 Gb for US and 3 Gb for Canada.
CERA gives 110 Gb for Rest of the World(Norway and Russia).
Last year ASPO-USA said there was 90 Gb at Kara Sea-Yamal and 10 Gb in the East Barents Sea.
I have a question.
Prudhoe was a real oil giant. What are the Russian Arctic oil giants (beyond the Arctic
Circle) that represent a big portion of 25 (110 Cera) Gb of oil.
Does Yamal currently produce any oil? There is an estimate that 15% of Yamal hydrocarbon is petroleum, is that the sole basis for the estimate.
This really looks like a pig-in-a-poke.
Shell who was kicked out of Sahkalin is drooling over a Russian offer to open up development.
http://tiny.cc/Ae0F5
How about the south poll Does Antarctica have any potential (large) reserves? I know its protected by treaty for development but treaties are broken all the time.
I have no expertise in energy matters. But I am interested. And read posts.
PNM natural gas presents foil
Retired PNM engineer Dave Gilmer told us that there is lots of natural gas available.
But in coal bed methane.
Any ideas?
Jean's comments on CBM:
This article says either Jean Laherrere is right with Russian gas production peaking ~2015 at 24.6 Tcf with a crash to 7 Tcf in 2045 or the Russian view of a gas peak ~2035 at 28 Tcf with a decline to 24.6 Tcf in 2060. Some pictures of the area but mainly of Gazprom, Medvedev,etc.
Looks like a bit like a 'Potemkin' operation.
http://www.spiegel.de/international/world/0,1518,524140-2,00.html
None of the reports mention the Central Arctic Commons Abyssal region. There are massive deep sedimentary basins there, many of them leaking hydrocarbons. The USS Healy ran a seismic line across the Mendeleev Ridge in 2005 and found deep basins and hydrocarbon seeps. The Lomonosov ODP cores recovered Azolla fossils over 8 metres, indicating the entire Arctic region is full of high TOC sediments. That kind of carbon-rich accumulation is a vital precursor to the formation of oil.
AMERASIA BASIN, SAFELY BEYOND THE CLUTCHES OF RUSSIA
The Amerasia basin, is the largest, deepest and most prospective sedimentary basin, (probably 10,000 ft thick high TOC sediments) with an estimated 75% of the Arctic abyssal petroleum potential, and lies just beyond Canada and the US 200 mile zone and is far beyond the clutches of any bogus claim by Russia or any other country. This area alone could contain 500 billion barrels or more and the oil and gas could easily be transported via the Trans Alaska Pipeline, (TAPS) or via a fleet of new icebreaker tankers to a new storage facility in perhaps Dutch Harbor for conventional tanker shipment to Asia and US west coast refineries.
On May 9, 2006, a joint filing oil & gas rights claim was made, by United10, Strategic11 and Sterling12 with the United Nations General Assembly and the countries of Canada, Russia, United States of America, Norway and Denmark. The filing claims, as a responsible oil and gas development agent (responsible consortium) of the “common heritage of mankind”, the sole and exclusive exploitation, development, marketing and extraction rights to the oil and gas resources of the sea floor and subsurface contained in the entire Arctic Ocean Common area beyond the exclusive economic zone of the Arctic Ocean’s surrounding countries.
There are very strong legal precedents for the Arctic Consortium's Arctic Commons Hydrocarbons Resource Rights Title Rights Claim under International Maritime Law and customary international laws. The Company has outlined some of these precedents at its website www.unoilgas.com
There are three hydrocarbons prospect plays in the Arctic Ocean Commons, oil, heavy gas and methane-hydrates, or light gas. Typically, in the Outer Arctic circle the three are often found loosely stacked together. Elsewhere in the world, oil companies are finding that the pressure of deeper water also tends to make for bigger pools of hydrocarbons, thus improving the potential economic viability of the Arctic Abyssal.
The Arctic Ocean Abyssal floor is increasingly believed to hold potential for vast resources of untapped oil and natural gas, which is expected to become accessible as new deep-sea drilling and hydrocarbons production technology has become available.
Petroleum Source Rock, Azolla
Data from the Alfred Wegener Institute indicate that the Azolla interval is oil / gas prone, with mixed Type II/III kerogen in the ACEX cores and recent studies reached a similar conclusion for all Alaskan and Canadian wells.
Petroleum products were observed directly extruding from Azolla remains in several wells, indicating hydrocarbon generation from Azolla at 0.7% Ro (vitrinite reflectance equivalent). Generation at 0.7% Ro is only slightly higher than levels needed to generate ‘traditional’ petroleum from marine phytoplankton, including oils from the Arctic Shublik Formation and the North Sea Kimmeridge Clay.
1. Azolla horizon thickness consistent with offshore deposition as floating mats.
2. Very large amount of carbon deposited in Arctic Basin. (6,000,000 kg of carbon per acre in 1,000 years, for 800,000 years).
3. Means increased source rock potential in offshore Central Arctic Ocean locations.
4. Total Organic Content, (TOC) greater than 5%.
5. Mixed Type II/III kerogen with high oil / gas potential.
Neither the surrounding countries, the UN nor mankind as a whole has done anything to create value in the deep Arctic Ocean hydrocarbons prospects, which is a giant remote frontier sedimentary basin wilderness, virtually unexploited. united and its partners plan to develop the resources in an environmentally sound manner, for the benefit of all humanity
Peter, thanks for this interesting contribution. 500 billion barrels of oil eh? That's enough to get the juices going.
I'd point out that that the "abyssal plain" is an area of ocean floor normally underlain by ocean floor basalts with a relatively thin cover of pelagic mud rocks interspersed with the distal deposits of turbidity currents, and as such this type of area is not normally prospective for either oil or gas. Lacking source rocks, reservoirs and appropriate burial history.
On this map the abyssal plains are the deep ocean basin areas.
The map above and this even better map do show significant sedimentary wedges building out across the abyssal plain from the shelf area of northern Canada and Alsaka and this no doubt may be related to accelerated erosion of the N American continent during successive glacial cycles.
http://www.maps.com/map.aspx?pid=15904
Following conventional wisdom of petroleum geology I'd have to be skeptical about this wedge of abyssal sediments being prospective, whilst acknowledging that this is a rather unusual area where some of the traditional rules may break down.
Finally I feel obliged to point out that this area is covered by semi-permanent sea ice and that this is likely to continue to be the case for the foreseeable future. It may turn out to be the case that rumors of the impending disappearance of the Arctic sea ice are somewhat exaggerated.
http://arctic.atmos.uiuc.edu/cryosphere/IMAGES/current.365.jpg
Comments from Jean:
This Nov-04 article from the New York Times was recently brought to my attention:
Under All That Ice, Maybe Oil
It suggests: