Coal Crunch?
Posted by Luis de Sousa on January 25, 2008 - 11:00am in The Oil Drum: Europe
| With oil prices receding from the nineties, the energy crisis almost seems like in recess. Almost, because elsewhere there are millions of people affected by power shortages amidst an old fashioned Winter. It reminds that the energy crisis is affecting the energy sector horizontally and showing problems in an industry that not long ago seemed like our last resort safety net. |
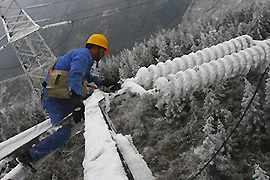 Source: Al-Jazeera. |
Crossposted at the European Tribune.
In the beginning of December it came to my attention that the coming Winter might be colder than usual, during the previous month the Arctic Sea Ice area grew by almost 4 million Km2, the fastest build up ever recorded. Although still 1 million Km2 below the reference average, it meant a significant temperature drop in the Arctic. During the following days temperatures in Europe drop enough to set new energy consumption records in France and Spain. December of 2007 turned out to be the coldest month since 2000.
This colder than usual winter had already been forecast by some meteorologic agencies, but in the beginning of January an extremely acute forecast by the polemic meteorologist Piers Corbyn warned of abnormally cold temperatures for central Europe. As the month draws to a close, it is clear that such forecast was correct for everywhere in the Northern Hemisphere but central Europe.
During the first week of January temperatures as low as -15ºC were felt in Greece and Bulgaria. Some days later bitter cold and snow storms reached Central Asia with Turkmenistan, Uzbekistan, Iran, Afghanistan and Pakistan being affected first. At latitudes under 40º, some places of Iran recorded temperatures of -25ºC. This would result in a series of Natural Gas supply cuts that would cascade as far as Greece, as reported earlier by Heading Out.
On the 11h of January it snowed in centre Baghdad, something that probably never happened during the XX century; during the same day it would snow in the north of Saudi Arabia. This abnormal weather has perdured across Central Asia; in Afghanistan more than 300 people have already died by cold or in consequence of avalanches. The effects of this abnormal weather can be observed in this image composed from NASA's MODIS sensor:
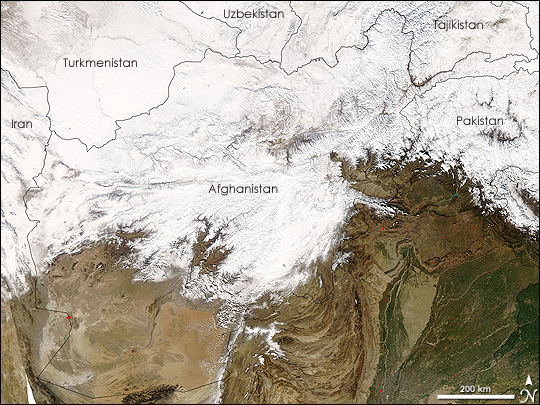
Source: Nasa. Click for more.
Later, colder temperatures than usual visited Siberia where the electricity grid was overloaded. Record low temperatures have been registered also in North America during this week, both in the Pacific as in the Atlantic coasts. The mercury also sank in US mainland and Canada; record snowfall hit Iowa.
In recent days this cold weather has spread to the Far East, affecting first northern India and then China. It is here that the fragility of the current energy supply system is becoming visible. Al-Jazeera reports:
China is facing its worst-ever power shortage as winter weather puts pressure on dwindling coal supplies.
Officials say reserves are down to emergency levels with only enough coal to power the entire country for another eight days.
According to state media the shortage amounts to nearly 70 gigawatts, equivalent to about the entire generating capacity of the United Kingdom.
From Reuters:
As of January 22, coal stocks in 355 power plants that depend mostly on railways for supplies had dropped to 19.68 million tonnes, approaching the "caution level" of 18.9 million tonnes, just enough for 8.8 days of generation, the report said.
Coal stocks in power plants in Hubei, Guizhou, Zhejiang, Ningxia and Anhui provinces were insufficient for even three days of generation, and the number of plants with stockpiles below requirement for three days had risen to more than 60.
The Press has been pointing that this shortage is also being caused by recent government action to curb growth of illegal or unsafe mining activities. But as noted by the BBC:
The China Business News newspaper said that 70% of all coal deliveries were made by road, and that heavy snowfall and icy conditions had contributed to supply problems.
All this is happening in a country that has 7 million Coal miners. This is an industry at a scale that probably never existed, providing 80% of the electricity consumed by 1.6 billion people, building a new coal power plant every week. And still it seems to struggle when the mercury drops.
Coal prices doubled in 2007 as China became a net importer earlier in the year. And consumption will continue rising, like Fatih Birol noted:
By 2015, China and India will be importing 170 Mtce (million tonnes coal equivalent), and by 2030 they will be importing 330 Mtce.
Before criticising these imports, we should remember that in India there are 420 million people with no access to electricity. How can we tell them not to use coal, which is the cheapest way of providing electricity?
A peak in Coal production is decades away, but this recent cold weather is showing a considerable disequilibrium between demand and supply. In the future this gap can eventually be mitigated with efficiency measures, especially at the electricity generation stage, but for now the demand growth rate, not only in China but also in India, is overwhelming.
Is this a Coal Crunch?
Luís de Sousa
TheOilDrum:Europe
Personnel
Editors
Contributors
Peak Oil Primers
Archives
- November 2010 (3)
- October 2010 (6)
- September 2010 (4)
- August 2010 (7)
- July 2010 (6)
- June 2010 (7)
- May 2010 (2)
- April 2010 (8)
- March 2010 (4)
- February 2010 (6)
- January 2010 (3)
- December 2009 (5)
- November 2009 (8)
- October 2009 (12)
- September 2009 (6)
- August 2009 (5)
- July 2009 (11)
- June 2009 (8)
- May 2009 (16)
- April 2009 (10)
- March 2009 (7)
- February 2009 (10)
- January 2009 (15)
- December 2008 (9)
- November 2008 (9)
- October 2008 (9)
- September 2008 (13)
- August 2008 (10)
- July 2008 (14)
- June 2008 (23)
- May 2008 (16)
- April 2008 (12)
- March 2008 (16)
- February 2008 (9)
- January 2008 (13)
- December 2007 (13)
- November 2007 (16)
- October 2007 (22)
- September 2007 (8)
- August 2007 (9)
- July 2007 (16)
- June 2007 (8)
- May 2007 (7)
- April 2007 (7)
- March 2007 (10)
- February 2007 (10)
- January 2007 (12)
- December 2006 (9)
- November 2006 (15)
- October 2006 (4)
- September 2006 (5)
- August 2006 (5)
- July 2006 (9)
- June 2006 (5)
- May 2006 (10)
- April 2006 (9)
- March 2006 (13)
Vital Trivia
License

This work is licensed under a Creative Commons Attribution-Share Alike 3.0 United States License.
This is a facinating report. Thank you very much for taking the time to present it.
I've been really busy this winter so I haven't followed the hydrocarbon issues very closely. However, every little hill and mountain in the southern end of the San Francisco bay area are not only covered in snow, but you could see the snow falling during the day, which I don't remember in my 45 years.
I've been joking for weeks at work complaining about the lack of global warming.
Does anyone follow the status of the thermal conveyor in the Atlantic and know of any changes, dramatic or otherwise, which may also be affecting sea temperature?
Is anyone worried that it's going to be really damn hot this summer?
I don't know what to make of it all. But thanks to your report, I'm at least thinking about it again.
Thanks,
Jeff
I don't know about the Atlantic, but the Pacific switched from El Nino to La Nina conditions in June 07 - that's why we've got floods in Austalia rather that droughts.
Our droughts tend to end with floods. Not necessarily anything to do with climate change, our climate has always tended to swing to extremes.
Quite likely there is some sort of linkage to the Atlantic.
Here's a link where you can track thermohaline circulation in the Atlantic:
http://rads.tudelft.nl/gulfstream/
Just provides data, no analysis.
Maybe only 15 years or so. Future Fossil-Fuel Production uses Hubbert Linearization to estimate future coal production and finds there is only 1.3 tboe left (about the same as conventional oil). All fossil fuel production peaks in 2021. Coal production peaked in the US in 1999 on a btu basis.
This is yet another reason that oil prices will stay high despite the economic turmoil. China will very likely go back to generating significant amounts of electricity with diesel. Someone will be priced out, and it may well be Western drivers.
Energy Watch (German scientific body reporting to government) predicts coal output will peak by 2025.
However nett energy production for coal is likely to peak much sooner, the easy higher energy density coal, has been preferentially extracted.
See New Scientist 19th Jan 08, The Great Coal Hole, feature article by David Strahan (of 'The Last Oil Shock', 'Horizon' etc.) http://environment.newscientist.com/channel/earth/energy-fuels/mg1972639...
Man fights Nature. Nature fights back. A flooded coal mine in Queensland a day or two ago.

Hello Boof,
Thxs for this photo--will gravity drain the mine, or do they have to bring in some huge pumps to get this water out?
http://www.forbes.com/markets/feeds/afx/2008/01/25/afx4573337.html
--------------------------------
Australia's Macarthur Coal joins string of coal miners hit by floods
-----------------------------
My question: will most of these mines be back up in a few days, or are we looking at a month or more?
If shutdown for sometime--China, and the other importers of Ozzie coal, might really be hurting soon for the coal to power their genplants and metal smelting industry.
Bob Shaw in Phx,Az Are Humans Smarter than Yeast?
Did a little googling to answer my own question on shutdown timeframes:
http://www.news.com.au/heraldsun/story/0,21985,23103775-664,00.html
---------------------------
Most affected mines are transporting coal from stockpiles and port authorities at Gladstone Port, where most of the coal is shipped from, said there had not been any disruptions to operations as yet.
A spokesman for one of the worst affected mines, owned and operated by Ensham Resources, yesterday said flood waters had reached a peak on Wednesday night and had started to recede. But water was still flooding draglines, and repairs could take more than 12 months.
Ensham, which is partially owned by Japanese customers, declared force majeure on Monday.
"We're going to see some pretty prolonged disruptions here, I suspect," ANZ commodity strategist Mark Pervan said.
"Supply is going to be considerably tighter now. There are not a lot of alternative supplies so it's certainly going to be a factor in negotiations on annual contract prices."
Annual contract coal prices, which are tipped to jump almost 50 per cent in the Japanese business year starting April 1, might be pushed higher, Mr Pervan said.
Market consensus is for prices to rise to $US140-$US150 a tonne this year, up from $US98, yet they might now be closer to $US200.
-------------------------
This price rise and potential shortage could really pressure Japan to restart it huge earthquake hit nuclear plant before everything is fully ready and people trained.
http://uk.reuters.com/article/oilRpt/idUKSP34332420080116
-------------------------
ANALYSIS-Japan nuclear power plant on long road to recovery
-----------------------
So more info:
http://www.bloomberg.com/apps/news?pid=20601087&sid=aR.9e4._pjvU&refer=home
------------------------------------------
No Chance
``With the distribution network operating at breaking point prior to the floods there is little or no chance of making up this lost tonnage,'' Merrill analysts led by Sydney-based Vicky Binns said in the report dated Jan. 24.
------------------------------
Now I am wondering if China may be so short of coal soon that their Summer Olympics may be cancelled. That could certainly help awaken the world to Peak Everything!
Thanks for this info Bob, check the comment left below by Rembrandt.
Bob
I don't know the answer to that. Most mines have a sump (low point) which is constantly pumped out so when that is working the level should go down. If that's too slow they may bring in temporary pumps. This is bituminous (black coal) which can be left out in the sun to dry but in other parts of Australia lignite (brown) has to be air dried to increase the heating value.
TOD ANZ says some coal firms are declaring force majeure on contracts. Later I'm predicting kind of the opposite, when China wants more coal they'll get it global warming be damned.
I will ask the obvious:
What prevented the mine from parking their dragline on higher ground?
Surely there must be a reason; however, I cannot think of one by looking at the photo.
Why does the coal industry believe in carbon capture and storage?
irrational optimism
Here are a few figures of ships waiting at anchor at sea to load coal at Newcastle NSW.
Average Ships
Date Entered Average Waiting Ship Days
12/09/2005 17 3.7 13 48.1
20/12/2005 18 3.6 21 75.6
27/02/2006 17 8.04 0
26/06/2006 15 5.35 0
18/12/2006 19 18.68 0
25/06/2007 15 27.25 75 2043.75
10/09/2008 20 18.62 47 875.14
2/10/2007 18 18.57 44 817.08
31/12/2007 23 15.92 34 541.28
14/01/2008 23 15.47 34 525.98
21/01/2008 23 10.56 29 306.24
Many of these ships show their destination as Chinese ports.
The cost must be enormous.
I thought the whole drama of cascading energy shortages in connection with the very cold weather very educational--like watching dominoes fall. The events also reinforce BAU's inertia as there will now be an effort to ensure supplies and increase generation capacity.
The very vigorous low sitting over California has my current attention. The millions in the Inland Empire are likely using a lot of NatGas. It will be interesting to see what the national NatGas inventory level is Y/Y at the end of January and the futures price.
Luis - would you care to comment on why we saw such rapid cooling in the N hemisphere this winter. Not so long ago we were discussing record lows in Arctic sea ice.
As I indicated in the post, the fast build up of Sea Ice Area in the Arctic during the last Fall was an indication that temperatures were abnormally low there. This is where the high pressure fronts are formed – masses of very cold and dense air that are gusted towards south. The colder the Arctic the more frequent and stronger will be the polar highs formed. These highs tend to gather together in geographically constrained areas in what is usually called Anticyclonic Agglutinations.
A look at these images is enlightening (click to enlarge):
Whilst the Sea Ice Area was bigger in 1980, the ice concentration in Arctic Quasi-Triangle (the Sea north of Greenland and around the Pole) is considerably higher today. It is here and in the Greenland Highlands that the polar highs are formed (mind that these are permanent ice regions that have been frozen for some million years). The temperatures in these areas have been declining since the 1970s and the overall high pressure activity has been growing since then.
This is an exceptional month, and since Piers Corbyn was able to forecast it, I can speculate that some kind of decrease in the sun's activity must have occurred, facilitating abnormally low temperatures in the Arctic and speeding up the formation of the polar highs. Understandably, Corbyn seems to be unable to know with one month in advance were will the polar highs concentrate geographically.
Luis - I'm a little confused. I thought the Arctic Sea ice was thinning - but you seem to be saying that in the area N of Greenland it is actually thickening?
And why's all that CO2 not keeping us warm? And is it not the case that all that snow cover will be reflecting much of the sunlight (depleted) straight back into space?
I know one penguin doesn't make a winter - but if we get two or three of these good old fashioned winters in a row it will throw the GW debate and policy makers into a state of chaos.
Do we spend 10 billion euros on CO2 capture which will consume a vast amount of energy? Or might it just be better to spend that money building new low C power generation plant - following a precautionary principal - that is sustainable.
Hi there all. What most people seem to ignore is that we are in one of Milankovitch's cycles, basically entering (albeit very, very slowly) into another natural ice age cycle (much debate there as well...)must be some fighting going on between natural cycle and AGW ... so far, January 08 was 4 degrees Celsius above average in Western Europe, so... climate chaos as predicted.
No. NASA climatologist James Hansen says there will be no more ice age unless the human species goes extinct. The climate forcings from the Milankovitch cycles are much too small in comparison to the CO2 forcings from burning fossil fuels. I encourage everyone here to read Jim's papers. Then and only then will you understand global warming:
http://www.columbia.edu/~jeh1/
Jim clearly states humans are in control now of the long term climate trend, for better or worse.
Matt - Hansen may be the GW expert - but...
Here's a chart I made a while back based on FF data compiled by Luis:
The red line is CO2 from combined oil, gas and coal - PO in 2012, PG in 2029 and PC in 2046 - this is based on the work of Lahererre. I think the data it is overlaid upon is IPCC.
So its good to see that their data and ours match up to present day - but then what happens?
In this chart I see a mortal threat to mankind from energy decline with peak FF in 2020. So where does the real risk lie - Global warming or energy decline?
It is more than a little unsettling that reports of problems with electricity supplies are now virtually a daily occurrence.
Yes, while highly important, we can't simply focus on oil production decline impacts, ignoring natural gas and coal supply (and emissions) issues.
real risk to whom and to what? to those toiling on land for a subsistent living or to those with that non-negotiable way of life which can not be sustained with the energy decline?
nobody has a non-negotiable way of using energy. raise the price and things change.
The answer hinges on how much coal we really have available and end up using.
If the cost of coal extraction gets high enough then the build of coal electric plants stops and nukes replace coal. If the cost of coal extraction stays low enough then CO2 emissions continue to rise.
I think Peak Coal doesn't get the attention it deserves. One reason why Peak Oil gets analyzed more than Peak Coal is that Peak Oil happens first. Another reason is that oil is just a lot more useful, especially for transportation. Another reason is that the oil industry is larger and more visible and politically more complex.
But maybe another reason Peak Coal doesn't get the attention it deserves is that we simply have less data about it. So there's less for the analysts to work with.
Matt, as I see it, both you and Sun_Tzu_Sun may be right. There's some figthing going on and we are winning big time.
And as I see it, the fact that man is overpowering the Milankovitch cycle is definitely for better. I show why next, reproducing a post I made yesterday on another thread. (In all the charts, time goes from right to left.)
First let's look at the temperature record of the last 450 ky, derived from ice core readings at the Vostok site in Antarctica (blue line):
It is clearly seen that during that span the Earth has been in a cycle where benign interglacial periods like the Holocene (last 11.5 ky) are very brief spikes between much longer cold periods with temperatures around 6+ Celsius lower than today's.
From that chart it is also clear that the Holocene has already been an unusually broad top, and that coolings from tops, although not as steep as warmings from bottoms, are nevertheless quite fast.
Then, to see better where we stand today, I made the following graph based on the first in Stuart Staniford's post "Living in the Eemian". I took the Holocene's last 12 ky and superimposed it onto the corresponding period of the Eemian (the previous interglacial), 121 ky ago. This is exactly what Stuart did in the second and third graphs of his post, only that here I show it within the bigger picture.
From that chart it is clear that, if there were no human-caused rise in CO2 levels, the astronomical forcings that drive climate change ("Milankovitch cycles"), if left alone, would have the Earth's temperature start to drop very soon (in about 3 ky) and be 6 Celsius lower than today's in about 15 ky.
And finally, the following chart illustrates that sea levels during glacial periods have been substantially lower than today's.
To note, in the cited article Stuart was worrying about the possibility of a sea level rise of 5 (five) meters. We see here that the glaciation cycle would likely cause a sea level drop of 50 (fifty) meters in 10 ky. I wonder which outcome would be more disruptive.
From the above, it is clear that the only way for mankind to get the Earth out of this cycle was to introduce a new forcing (greenhouse gases) strong enough to overpower the astronomical forcings in play. And that the real alternative to global warming (which indeed means a higher sea level and an ice-free Arctic) would not be an extension of the Holocene. It would be a new ice age with a substantially lower sea level and an ice-covered North America. And at a time when there will be no fossil fuels to keep people warm.
Well that's different.
Pretty sure I don't agree, but I'm going to have to ponder that one for a while...
Thanks, I think...
--J
A bit off-topic, but while we are here...
Your chart showing temperature and CO2 is out of date. The current CO2 level is over 380ppm.
And attempting to extrapolate using one data point (Eemian) violates a number of statistical rules (i.e., Hypothesis Tests of Proportion, for starters).
And you show no sign knowing about the evidence for a long interglacial period (i.e., the current warm climate may last another 50,000 years);
http://www.agu.org/sci_soc/policy/positions/climate_change2008.shtml
So your 'analysis' is unfounded. On top of that, you do not address current and future impacts to agriculture due to ongoing global warming, but advocate the continuation of the forcing. How many millions would need to starve to prove you wrong?
Want opinions from the experts or from some guy with a keyboard? The American Geophysical Union (50,000+ scientists) released a statement last month;
http://www.agu.org/sci_soc/policy/positions/climate_change2008.shtml
"The Earth's climate is now clearly out of balance and is warming. Many components of the climate system—including the temperatures of the atmosphere, land and ocean, the extent of sea ice and mountain glaciers, the sea level, the distribution of precipitation, and the length of seasons—are now changing at rates and in patterns that are not natural and are best explained by the increased atmospheric abundances of greenhouse gases and aerosols generated by human activity during the 20th century. Global average surface temperatures increased on average by about 0.6°C over the period 1956–2006. As of 2006, eleven of the previous twelve years were warmer than any others since 1850. The observed rapid retreat of Arctic sea ice is expected to continue and lead to the disappearance of summertime ice within this century. Evidence from most oceans and all continents except Antarctica shows warming attributable to human activities. Recent changes in many physical and biological systems are linked with this regional climate change. A sustained research effort, involving many AGU members and summarized in the 2007 assessments of the Intergovernmental Panel on Climate Change, continues to improve our scientific understanding of the climate.
During recent millennia of relatively stable climate, civilization became established and populations have grown rapidly. In the next 50 years, even the lower limit of impending climate change—an additional global mean warming of 1°C above the last decade—is far beyond the range of climate variability experienced during the past thousand years and poses global problems in planning for and adapting to it. Warming greater than 2°C above 19th century levels is projected to be disruptive, reducing global agricultural productivity, causing widespread loss of biodiversity, and—if sustained over centuries—melting much of the Greenland ice sheet with ensuing rise in sea level of several meters. If this 2°C warming is to be avoided, then our net annual emissions of CO2 must be reduced by more than 50 percent within this century. With such projections, there are many sources of scientific uncertainty, but none are known that could make the impact of climate change inconsequential. Given the uncertainty in climate projections, there can be surprises that may cause more dramatic disruptions than anticipated from the most probable model projections. "
Well, the short bottom line is (and the IPCC does now agreed on that one, quote "there is now a frightening possibility of simultaneous, rapid melting of the Greenland and West Antarctica ice sheets... ) that we are indeed warming up the planet way to fast !!
Nevertheless, natural, underlying cycles still do exists, it would be foolish to deny them. The climate system reacts to every little stimuli it seems, and the combination of all this is climate chaos, as we have seen it all around the globe over the last years.
True. (BTW, it's not "my" chart, and it's linked to the Wiki page where I took it from.) What you say is reflected in the following chart, also from Wiki (in this chart, time runs from left to right).
I strongly disagree. The data point I chose was not arbitrary, but one among the four that are suitable for the extrapolation.
From the chart it is unmistakably clear that:
1. The global temperature has been in a cycle for the last 450 Ky.
2. We are now at the top of one of the brief interglacial spikes.
Therefore I could have chosen any of the other 3 interglacial tops in the chart and have arrived at the same conclusions. (Moreover, the one preceding the Eemian, which has a temperature more like the Holocene, has a much steeper temperature plunge.)
And on the other hand, it would have been incorrect (and idiotic) to choose any other point in the cycles for the extrapolation.
And you do not address future impacts to agriculture due to the ice age that would be coming in a few millenia if mankind had not released massive CO2 quantities.
First, this picture implies the loss a big share of the world's best arable lands.
Secondly, I'll quote from http://en.wikipedia.org/wiki/Last_Glacial_Maximum
Just in case you don't know, Australia and the Pampas in South America are prime agricultural regions too.
BTW, the quoted Wiki page takes its information from studies at the Paleoclimate Modelling Intercomparison Project page http://pmip.lsce.ipsl.fr/publications/pub21k.shtml . Those folks don't seem to be just guys with keyboards.
As for the AGU report, either their reasoning or their perception of the big picture (in time) is downright regrettable.
Sure folks, but the record for the last 450 millennia shows that periods like this of benign, stable climate have a length of just a few millenia, and that they are always followed by plunges into much longer ice ages. So prolonging the climate of the last 8 millenia is not an option in the design specifications. Either we break out of the cycle into a warmer period or we plunge into a new ice age soon.
So, should we do our best to stay within the range of the past thousand years while waiting for the Milankovitch cycle to push us down the slope? Would planning for and adapting to a new ice age pose no global problems?
So, should we opt for cooling greater than 6ºC instead? Because, per the quoted Wiki page (again, based on many scientific, peer-reviewed studies), that path looks way more disruptive and ruinous for global agricultural productivity. Unless they are betting on the ensuing sea level drop of more than 50 meters to solve all those problems.
You completely punted on the subject of an extended warm period (50,000 years) during this interglacial period;
http://www.agu.org/sci_soc/policy/positions/climate_change2008.shtml
You focused on the Eemian period, which fails simple statistical tests (one of which you also punted on), then you bring up other periods that have sharp fall-offs that are not replicated by this Holcene period, hence you fail your own 'look at the charts' embarrassment to the scientific method.
I don't have to because this projection has not been established by any scientific body. Beach Boy "look at the charts" does not establish such a projection.
Your attempts to discuss agricultural impacts were not clear (first sentence did not parse, second link wandered with no thesis (and WIKIPEDIA on top of that!)). Attempting to counter the American Geophysical Union with such a sparse argument invariably leaves you in the unavoidably losing position.
For which you are providing the wrong link. From the chart of the last 450 ky, the widest interglacial is the oldest (4th before the Holocene), both according to Vostok and Epica records.
Using it instead of the Eemian would mean a 5 ºC drop in 20 ky instead of a 6 ºC drop in 15 ky. So my conclusion is still valid.
If you actually mean "sharp fall-offs", it is obvious that they have not (yet) been replicated by the Holocene. Thank God NO fall-off has been replicated by the Holocene yet!
If you instead mean "sharp peaking", the two interglacials that have more resemblance to the Holocene in this respect are the Eemian and the mentioned 4th previous.
So the studies linked in http://pmip.lsce.ipsl.fr/publications/pub21k.shtml have no value until the authors establish a "Global Association of Paleoclimate Modellers" and issue a position statement.
Yes, there was an "OF" missing. It should have been:
First, this picture implies the loss OF a big share of the world's best arable lands.
Personally, I'd have inferred that there was a missing "of" and not make an issue of it. And I think most people in this forum also would.
The second link and the quoted paragraph thereof does not present any thesis. It describes the global climate and vegetation during the last ice age. It is up to the reader to draw the appropriate conclusion from points such as:
"In warmer regions of the world, climates at the Last Glacial Maximum were cooler and almost everywhere drier."
"In Australia, shifting sand dunes covered half the continent, whilst the Chaco and Pampas in South America became similarly dry."
As for Wikipedia, I had already said that "the quoted Wiki page takes its information from studies at the Paleoclimate Modelling Intercomparison Project page http://pmip.lsce.ipsl.fr/publications/pub21k.shtml ."
Sure, there is the possibility that the Wiki authors' work was not in line with the scientific studies. Since most of the studies linked in that page require a journal subscription for access, I could only have a look at The Paleoclimate Modeling Intercomparison Project, S. Joussaume and K. E. Taylor, proceedings of the third PMIP workshop, Canada, 4-8 october 1999, in WCRP-111, WMO/TD-1007, edited by P. Braconnot, 9-24, 2000.
The intended link about an extended 50,000 year warm climate interglacial period;
http://www.sciencemag.org/cgi/content/summary/297/5585/1287
Just like that? Then why should we listen to all the PhDs in climatology that seem to come to completely different conclusions? Because you are a guy with a keyboard that interprets data without regard to multivariate considerations, pulling conclusions out of your [a dark place]? You must think that readers here are highly impressionable and mindless.
No, if we look at the other 3 interglacial periods, we would assume that the current Holocene period was an outlier, hence your reliance solely on the Eemian period is overly selective, fails the Hypothesis Tests of Proportions at a minimum, and hence your 'conclusion' based on faulty data collection is obviated.
I have no doubt that during the depths of the glacial maximums, many areas were cooler and drier. This proves nothing, of course.
Vague handwaving like this punches even greater holes in your argument. I've added quite a bit of material to WP and understand that those with agendas and persistence usually win out, regardless of what's in the reference list. What you really need to do it to provide direct data and related analysis from suitably peer-reviewed literature to support your thesis statement. Tossing out a list of papers does not begin to answer this mail. We simply must get you signed up for some post-grad research so that you can appreciate the need for solid selection and analytical application of the significant material from said references. Hopefully, you are in a position to consider such a task, though read the provided link at the top first.
Second instance of recurrence to argument of authority. (First was the statement from the American Geophysical Union.) Arguments of authority have no place in natural science.
First, this has nothing to do with my statement "If you actually mean "sharp fall-offs", it is obvious that they have not (yet) been replicated by the Holocene." to which it appears to reply. Leaving that aside:
- We have accurate temperature and CO2 records for the 4 previous interglacial periods.
- The Eemian and the 4th previous (Marine Isotopic Stage 11 or MIS 11) are the broadest, which means those which would lend themselves the least to support my argument.
- Selecting any of both supports my conclusion.
Where is the over-selectivity then?
Again, there are the Holocene and another 4 tops. I compared the Holocene with the immediately previous and the 4th previous tops. Where am I failing the Hypothesis Tests of Proportions?
My thesis statement is supported by direct data - the measurements from the ice cores at Vostok and Epica - and by the force of reason, which overcomes bad science no matter how many scientists are behind it. And plainly stated, science which does not take into account relevant facts is bad science. Period.
The relevant fact in this case is that, for the last 450 ky, the Earth has been in a cycle where benign interglacial periods like the Holocene (last 11.5 ky) have been more or less brief spikes occurring every 100-120 ky between much longer cold periods with temperatures around 6+ Celsius lower than today's.
So any scientific approach to the subject of global warming, particularly with the aim of offering policy recommendations based on it, which does not take into account the temperature record for the last 450 ky is just bad science. Period.
And that is exactly the case of the position statement from the AGU, about which I reaffirm what I said in a previous post. Drawing conclusions and making recommendations based on just the latest milennia is downright regrettable.
In contrast, I would have no problem accepting statements such as the following:
"After having achieved a complete understanding of the Milankovitch cycle, we have unequivocally determined that, purely out of the astronomical forcings, the current interglacial period will have a total duration of around 28 Ky - i.e. it will span 14 Ky into the future - and that, as a result, mankind can safely embark on an aggressive reduction of CO2 emissions without fearing that the onset of a new ice age could take place before the Rapture."
or
"After having achieved a complete understanding of the astronomical and anthropogenic forcings driving climate change, and an accurate quantitative assessment of their relative weight, we have unequivocally determined that, if CO2 emissions are reduced according to the XXX protocol, the anthropogenic warming forcings will exactly compensate for the astronomical cooling forcings and the Earth will remain in the Holocene for ever after."
or
"After having achieved a complete understanding of the potential consequences of global warming versus those of the onset of a new ice age, we see unequivocally that the latter would be much more bearable for mankind. Therefore, we recommend an aggressive reduction of CO2 emissions while stocking up on sweaters."
Will wrote:
Beach Boy wrote:
If this were purely an argument of logic, you would be correct. However, as this is an investigation of scientific findings, the scientific process takes precedence. Note that a court of law doesn't ask any old kid with a keyboard to provide expert testimony, they select an expert witness (i.e., engineer, doctor, etc) that has been identified by the appropriate authority (i.e, engineers would need to be professionally licensed). Getting your science from cranks on the internet is one sure way to head back to the Dark Ages (Earth = 6000 years old, anybody?).
To think that you can summarily dismiss the findings of the American Geophysical Union is laughable on its face, to say the very least. You might consider submitting your finding to Science, Nature, or some other scientific journal and see if you can get it published. I'm willing to put up 1000 to 1 odds that says you fail.
You might try to learn something by reading up on the subject, start with finding out about the next minimum in the eccentricity of Earth's orbit around the Sun;
- A. Berger and M. F. Loutre, An Exceptionally Long Interglacial Ahead?,
Science 23 August 2002: Vol. 297. no. 5585, pp. 1287 - 1288
http://www.sciencemag.org/cgi/content/summary/297/5585/1287
If you don't have a subscription to Science, then see;
http://www.clim-past-discuss.net/2/1221/2006/cpd-2-1221-2006-print.pdf
http://www.realclimate.org/index.php?p=223
And since you like getting your science from Wikipedia, I'm surprised you ignored what is there;
http://en.wikipedia.org/wiki/Glacial_period#Next_glacial_period
The above is for starters; get back to us when you've absorbed them.
Beach Boy
Great long-term thinking. Mostly we are now stuck in a panic that with GW we will get all that methane bubbling from Arctic/Clathrates and trigger a superspike, bringing us back to an earlier age, dinosaur like. Earth has been relatively cold since then apparently, up and down within the current range and ice ages, switching relatively frequently based on milankovitch cycles. If, as has been recently postulated, Peak FFs limit us to 450 PPM by ca. 2040-2050, and we do not trigger the big methane release regardless of how irresoponsible we are with our resources, then I would presume that a new ice age would be delayyed by X thousand years, depanding on how long CO2 remains in the atmosphere, after we put it in, in the framework of the milankovitsch cycles of course. This would be a one-off delay in the milankovitsch cycle and would theoretically confuse future scientists, looking back. Since no new FF resources are to be expected then this will never happen again.
Basically then as I read from a Simmons interview published at Energy Builletin recently, PO is the big problem and not GW. If we can stop a PO die-off then we should be ok, if we can rely on the methane not blowing up to cause a dinosaur type age. If GW focused scientists like Hansen can get their minds around Peak FFs limiting CO2 release then they can move on from these crazy linear models going out to 2100 to 1000 PPM equivalent, which is complete madness and we all know it now.
It is now critical to convince the GW scientists and such people at RealClimate of the reality of PO and Peak FFs so that they can seriously model the possible massive release of methanes at 450 PPM CO2 and the nonlinear behaviour/collapse of Greenland and West Antarctic ice sheets by 2040-2050, which is actually the only real GW problem which should truly concern us, crazy weather hindering agriculture aside. The big effort nowis to develop GW in light of Peak Oil/FFs knowledge.
I have been this week avidly reading the two threads from Stuart and Sharon, realizing that our future hangs on the current societal construct of monetary profit mechanism/free market forces/invisible hand, to decide where our resources will be allocated, instead of what is long-term sustainable for earth and its inhabitants, animal, vegetable and mineral, for the long-term. OF course, similar ot Hanesn, et. al. Sturat could be right that big Ag will keep up its work, but when one considers the whole system, things could look markedly different, as olduvai, subsidies, food riots or alternative gardening on suburban lawns and lack of spare parts for, fertilizer(nat Gas) or whatever prevents a single system(say a mainframe from IBM 50s style) to prevail over a widely distributed internet style system with corresponding robustness and redundancy.
I just think Stuart gives away his whole game to be a criticism of the 60s generation leftwing anti coprorate, antigovt. attitudes when he put up Heinberg and Kunstler as being representatives of the second generation of POers as "reversalists". There has been so much written and thought of the 60s generation and the failure of the 60s goals and ideals, which mostly was discontinued and that they became cynical money hungry yuppies, betraying their cause for a latte. I think Stuart must think they are all hypocrites and has a latent hatred of the whole generation wtih their preachy self righteousness (hey, I certainly do for one, to be terribly honest).
This being said, it is clear that the older generation who fought the war(GI generation) were bound to be analytical, system builders who supported TPTB and the central role of the markets and govt. and that their boomer kids rebelled. This is all described in detail on the books "Generations"
http://www.amazon.com/Generations-History-Americas-Future-1584/dp/068811...
http://en.wikipedia.org/wiki/Bill_Strauss
The third generation (out of four) that Stuart did not mention is mine(and himself?), 25-45 years old now, flexible , cynical survivalists, who avoid the worst excesses of the boomer idealists (Bush/Kunstler types on far ends of the spectrum) and play mid-level leaders in the coming crisis-good cvommunicators, with the youngsters,children of boomers mostly, so-called millenialist(5-25 years old) being the new GI generation who will display the technical expertise and massive teamwork to build a new society based on renewable energy sources, permaculture, and generally new sources of distributed energy and food sources which are redundant and flexible with an eye on their long-term sustainability in terms of environment adn Peak FFs.
Stuart in his analysis leaves out the long-term cyclical generational anlysis, letting himself get caught up in a not so sublte criticism of the leftwing boomers in suppoort of the right wing boomers, who did not rebel aginst their parents(take Bush Jr.), presuming that the rebellious boomers are hypocritical losers and that regardless, they will lose this time too as they have no technical know-how or are just too lazy and idealistic to really get things done.
In point of fact "The vision thing" (thanks to GHW Bush) is critical to the rebellious boomers, and to every generational cycle and in all of mythical structure. The technical teamwork hero(GIs) needs an idealist king (Say Bush/Lincoln/Roosevelt) whose vision drives him on to form a new world out of the ashes of the old decaying system.
We will build the new zero or low growth system with permaculture, some low industrial Ag and sustainable renewables using old and new tech and revived old historical concepts and societal cooperation to form a new survivable world. No one ideological side will be right in everything but somehow it will work out in the end so that the stone age won't return.
I will next look at where current scientific knowledge stands relative to the possibility of issuing statements A. or B. above. (I don't think they will dare to state C.!) To that purpose, I will use as reference the reading materials used by Dr Ian Lawson in his 2007-2008 Palaeoclimate course at the University of Leeds, together with his comments on them.
Starting with hypothetical statement B., it is common knowledge that the natural forcings driving climate change are related to the periodical changes in the Earth's orbit around the Sun, collectively known as Milankovitch cycles, of which there are three with their respective periods:
Eccentricity (orbital shape): 413 ky for major component (eccent. variation ±0.012) (*)
Obliquity (axial tilt): 41 ky
Precession (wobble): 23 ky (actually 21-26)
(*) A number of other terms vary between 95 ky and 136 ky, and loosely combine into a 100 ky cycle (variation of −0.03 to +0.02).
Dr Lawson's comments on this subject should be taken seriously...
... and should lead us to think that scientific knowledge is still far from the point of being able to make an accurate quantitative assessment of the combined effect of natural and anthropogenic forcings that would enable the issuance of statement B.
The foremost proponents of the BH hypothesis are A. Berger and M. F. Loutre, researchers at the Institut d'astronomie et de géophysique Georges Lemaître, Université catholique de Louvain. They suggested that an orbital analogy could be made between the Holocene and MIS 11. This analogy results from a similar low level of eccentricity (the distance between MIS 11 and today corresponds to the 413 ky period in eccentricity). Notably, their first paper on the subject "Marine Isotope Stage 11 as an analogue for the present interglacial" was received by the Global and Planetary Change journal in 1999 but accepted only in 2002. The comparison was further strengthened by simulations conducted with a two dimensional climate model (the "Louvain-la-Neuve" or LLN model). Such simulations suggested that the orbital forcing would not be triggering a glacial inception until 50 ka after present. Their results were published in the 2003 paper "Clues from MIS 11 to predict the future climate – a modelling point of view" whose abstract says:
On the other hand, the foremost proponent of the NH hypothesis is William F. Ruddiman. His hypothesis is actually more radical than mine. Let's recall that, from the chart in Figure 3, I had raised the possibility that as far as the natural forcings driving climate change are concerned, and IF those forcings had now the same values as they had in the Eemian, the Earth's temperature would start to drop very soon (in about 3 ky) and be 6 ºC lower than today's in about 15 ky. In contrast, what Ruddiman postulated in his 2003 paper "The Anthropogenic Greenhouse Era Began Thousands of Years Ago" was:
A year later, using simulations with the "GENESIS 2" model, in a co-authored paper "A Test of the Overdue-Glaciation Hypothesis" (2MB PDF) Ruddiman et al reached the conclusion that, were it not for pre-industrial anthropogenic GHG emissions, global temperature today would already be 2ºC cooler. In their words:
Interestingly, Ruddiman addressed the "Broad Holocene like MIS 11" hypothesis in 2004 in "Cold climate during the closest Stage 11 analog to recent Millennia". Even more interestingly, Crucifix, Loutre and Berger published also in 2004 a Commentary on “The Anthropogenic Greenhouse Era Began Thousands of Years Ago” stating:
Keeping in mind that these are the foremost proponents of the "Broad Holocene" hypothesis, let's pay attention to the emphasized sentence: a delayed onset of the new ice age "is plausible, but not certain, depending on the exact time evolution of the atmospheric CO2 concentration"! (But fear not, for all the wise people currently advocating for drastic cuts in CO2 emissions are certainly aware of the full contents of this and subsequents studies from these researchers, and they have made sure that their recommended policies still allow for ample margin to avoid an early Holocene glacial inception.)
BTW, this is in line with Ruddiman's comment in a Dec 2005 archived discussion: "the fact that Berger’s model produced an extremely long interglaciation if he only used insolation forcing, but a much shorter one if he added CO2 (from Vostok) to the forcing;"
Moreover, the three Belgian researchers published in 2006 "The Climate Response to the Astronomical Forcing" stating:
Therefore, two years ago the struggle between the two hipotheses was still unsettled. Looking now to other researchers for guidance, in Jul 2006 Peter Huybers published the potentially breakthrough paper "Early Pleistocene Glacial Cycles and the Integrated Summer Insolation Forcing" in which he states:
After which a numerous research team, using the EPICA Dome C measurements and the "ECBILT-CLIO" intermediate complexity climate model, in their Oct 2006 paper "Past temperature reconstructions from deep ice cores: relevance for future climate change" reviewed both Ruddiman's and Berger's hypotheses, and building on the just cited Huybers papers, concluded:
While the conclusions of this study heavily lean towards the "Broad Holocene out of just natural forcings" hypothesis, a 2005 study on a completely different area yielded results supporting Ruddiman's case: "Similarity of vegetation dynamics during interglacial periods" Analysing polen records, the authors found that the pattern of relative variation of different bioclimatic affinity groups (BAGs) in the modern records corresponded to that seen at the end of previous interglacials, and they ask:
To sum up, advancing scientific knowledge seems, by the end of 2006 to have shifted the balance towards the "Broad Holocene" hypothesis, although it is still far from reaching a firm consensus. Which leaves the treatment and policy recommendations on the subject of AGW issued before that date looking rather flimsy, to say the least.
As for how far science still is from a firm consensus, a newly published paper by Raymo and Huybers is most eloquent:
I read that all very carefully and am beginning to understand this better, i.e. relationship between ice ages and various factors in the milankovitsch cycle like obliqity, etc.
Certainly I can understand how a comparativley slow CO2 relaease due to agriculture and cattle stating 5-8000 years ago could be responsible for ca. 2 degrees warmer atmosphere, delaying an ice age but also I can understand how the current fears of a massive release of CO2 and methane due to FF burning could suddenly force clathrates, arctic pemafrost methane causing a sort of Venusian situation and destabilizing either the Greenland ice sheets or the Antarctic ice sheets or even stopping the gulf stream, thereby freezing Europe and destabilizing in unknown ways the global climate system. This amount of Globalwarming gases are presumably much beyond the range of anything in the historic models for the recent ice ages.
AS we so often read, this experiment is not in a laboratory and it can only be tried once. Although we may not have much more FFs than enough to cause over 450 PPM by ourselves, it is undoubtedly true that if the arctic methane releases quickly this could be a runawy warming , which, as Methane is relatively short lived, could be of short duration , but that would be no consolation to the fried earth and the extinct life forms.
Caution is called upon.
You've taken the time to peruse some of the findings and analysis over the last few years, which is a step in the right direction. You've also acknowledged that your initial thoughts on the matter have evolved due to this examination, which is another step in the right direction.
And I would agree with this.
I don't see support for this statement in your brief above, regardless of the 'shouting' you've imparted with the bolding. Sustainability on the order of decades and centuries is an important issue. Sustainability on the order of thousands and 10s of thousands of years is also important, though cannot be given priority over the former, especially when it is not clear if the Holocene will continue for 3000 or 50,000 years. Unless your approach to sustainability is to dramatically reduce the population over a century or two so that it stands a much better chance of surviving in the long run. If so, you should be explicit in your thesis statement.
When I first heard of the supposed danger of anthropogenic global warming, my thought was that if anything it would help us come the next ice age. It is quite clear that many people's scientific reasoning is driven by ideological preferences for certain ways of life, in this case the simple life of lower consumption in general and lower fossil fuel consumption in particular. Arguing the facts to support a world view is a terrible way to do science and many global warming doomers are little better in this regard than the Creation-science types. They have a conclusion and then look for facts to support it.
There are compelling reasons to limit our damage to environment which is now reaching extraordinary levels, but our work here should be as objective and data driven as possible. Someone really needs to explain how warming the next ice age by a few degrees, supposing we are even capable of doing so, will be a bad thing. According to the IPCC we have accomplished a five inch increase in the world sea levels thusfar; this isn't going to help us much given the 150 foot drop that is coming.
You have yet to establish any facts yourself. If we seriously impair the climate in the near term, disrupting agriculture which is on the ropes as it is, and have to wait 5 thousand years or more for the next ice age to begin, then I'd say "no thanks" to such a 'solution' to a situation 1000s of years in the future. I can't believe people are actually saying this with a straight face; are your fingers crossed behind your back?
Heh...
CLZ09, what we are seeing here is the same kind of reaction that Stuart got with his data-driven, well-reasoned article on the prospects of relocalization.
The main issue with this argument is the difference in the span of time over which we can adapt. You are comparing temperature changes that occur over thousands or tens of thousands of years resulting in an ice age, versus temperature changes due to global warming that occur over decades or hundreds of years. Global warming will test our ability to adapt, whereas the civilization we have (on this planet and others) in 1 - 10K years can't even be imagined, let alone worried about.
Very good point, SWF.
Having said that, the following 2006 paper shows that interglacials can end very fast too.
http://www.pnas.org/cgi/content/abstract/104/2/450
Evidence for last interglacial chronology and environmental change from Southern Europe
"Establishing phase relationships between earth-system components during periods of rapid global change is vital to understanding the underlying processes. It requires records of each component with independent and accurate chronologies. Until now, no continental record extending from the present to the penultimate glacial had such a chronology to our knowledge. Here, we present such a record from the annually laminated sediments of Lago Grande di Monticchio, southern Italy. Using this record we determine the duration (17.70 ± 0.20 ka) and age of onset (127.20 ± 1.60 ka B.P.) of the last interglacial, as reflected by terrestrial ecosystems. This record also reveals that the transitions at the beginning and end of the interglacial spanned only 100 and 150 years, respectively."
If global warming is caused by humans, then explain the following observations:
1. Mars is warming too
2. 1,000 years ago, for a period of 200 years, it was significantly warmer than it is today (the Vikings mapped northern Greenland, which has been ice bound ever since)
3. During the last million years several of the interglacial periods have had significantly warmer temperatures than we have today
4. During an interglacial period the temperature rises, the CO2 rises (with about a 200 year time lag--note that this occurs after the temperature rise), then as it enters the next ice age the temperature falls, and the CO2 falls...if CO2 is driving temperature how can temperature fall with high CO2?
suggested reading: The discovery of global warming by Spencer R. Weart, Cambridge, Mass. : Harvard University Press, c2003
for the basic facts, go to Weart's website: http://www.aip.org/history/climate/index.html
that's a fact. who caused it? most likely human. through what? most likely agriculture. via what mechanism? most likely adaptive feedback. James Lovelock's Gaia theory and daisy experiment offer good explanation.
yes, but to anyone who could learn a thing or two from LaoZi, the lesson is don't overdo it. a cycle won't turn until certain threshold is reached. if one examine the 450ky chart again carefully, there had always been a peaking, at the level yet to be seen in Holocene (at least on the plotted chart), preceding the turning into a glacial cycle. the reason why human could have broadened the Holocene top may well be in preventing the whole system from reaching that threshold, unknowingly, by using the adaptive feedback of agriculture. the danger we are facing now is that the GHG release through the industrial process has overwhelmed the delicate balancing act in a so short period of time that's almost invisible in that 450ky chart and we may or may not yet -if we are so lucky- have pushed our luck a bit too far. the rapid warming that could bring us to that unfortunate threshold and the beginning of a new glacial cycle could well be one and the same.
为此道者不欲盈 -- LaoZi
You raise a very interesting point, I believe you are on to something. The whole reason for instigating international panel on climate was in fact not to investigate global warming - it was also to investigate the possibility of cooling leading into an ice age. The question why was not why is the world warming, but why is the world not cooling, because if you look at the charts the world "should" be heading towards an ice age.
Hansens point about "cannot have another ice age" is that human forcing far outweighs natural. Even if humans emit only a fraction of current GH gases, it would still prevent the very weak Milankovitch cycle causing an ice age. The assumption is that humans will always emit some CO2, methane etc.
From that chart it is also clear that the Holocene has already been an unusually broad top, and that coolings from tops, although not as steep as warmings from bottoms, are nevertheless quite fast.
Interesting question about about the length of the Holocene - is it related to the emergence of modern civilisation? William Ruddiman suggests that the emergence of farming has so significantly changed land use is has caused a warming for the past 8000 years. Alternatively, the length of a extended natural Holocene cold have given the opportunity for civilisation to grow. It is hard to tell which.
Graham Hancock has also uncovered fascinating evidence about early civilisations being coastal. It turns out the coastal margins are ideal place for agriculture, and is likely the seat of modern civilisations. Unfortunately these are the very places inundated by the 50m sea level rise since the last glacial maximum, and their traces are hard to investigate archeologically.
Also unfortunately, the debate has become so political that it is hard to air these sort of theories. It would take 1000s of years before CO2 reduced to a level where global cooling is a real concern, so I don't see it as a cause for inaction.
Indeed, the startling conclusion is that by making relatively small adjustments to GH gases, humans are affecting the global climate in a significant way. The label Anthropocene is justified. If we are minded to, we could actually control the level of warming to whatever we want it to be. In the far future, we may find that the lack of CO2 emissions from FF necessitates deliberately releasing CO2 just to maintain the temperature.
The level of international cooperation required to take coordinated action appears to be beyond us though. I'm not sure that will be any different in future. We are still a species dogged by superstition (religion) and ancient disputes of territory.
If people in the far future would find it wise to increase the greenhouse effect they can manufacture potent greenhouse gases like SF6.
Doesn't the ice age end up coming eventually anyhow due to the eventual decline in atmospheric CO2 once we run out of fossil fuels?
Haven't we just delayed the ice age a couple of thousand years at best?
The Arctic Sea Ice doesn't exactly “thins” or “thickens”, it melts during the summer and freezes back during the winter. Comparing to the 1970s the area of frozen sea is now smaller at peak at least by 1 million km2. The Arctic Quasi-Triangle (also called sometimes just the Arctic Ice) doesn't melt during the summer, as so the permanent ice on the Greenland Highlands.
All that snow is indeed reflecting light back into space. Glaciations probably start like this, with the general atmospheric circulation getting faster and faster, producing ever stronger polar highs. It snows further and further south; during the summer this snow doesn't melt entirely producing a colder following winter. This happens at a scale incomparable to the current climate setting, all that snow will simply melt coming the next summer.
The current month is really off the marks comparing to the last winters - that globally have been getting warmer since the 1970s climatic shift. Like it is said in warmer parts of the world: a swallow doesn't make the Spring.
Totally wrong. There is a longterm trend of thinning apart from the seasonal changes. Read the other comments I wrote here.
It is also misleading to only focus on the sea ice extent. It is very important to look at the ice thickness, which together with the extent defines the sea ice VOLUME. If the ice is thin, it melts away quickly when summer starts and then large areas of the Arctic ocean will no longer reflect the sun when it matters, in summer. The Arctic ocean then warms up faster and that is the dreaded positive feed back loop we might have entered already. Once the Arctic summer sea ice is gone, God help us. Then Greenland is surrounded by warming waters. The ocean circulation will also change as the salt concentration changes. We really have no idea what's going to happen then.
That's what happened last summer.
it seems you are only talking about the seasonal ice (have you written the permanent ice off already? ;-) for the multi-year ice, there is a thinning and thickening process, and the thickening process is mainly through winter precipitation on top since ice is such a good insulator.
Definitely not. Just like every spike of crude oil production over 74 mb/d will not change the basic fact that oil depletion will soon overwhelm the whole oil supply system.
In relation to the Arctic sea ice, what has regrown after the sun is gone (for 6 months!) is very thin. Only the summer sea ice can reflect sun light during the other 6 months of the year. Read about the summer sea ice in these links:
Already in 1999, 40% of the sea ice volume was gone
http://psc.apl.washington.edu/thinning/thinning.html
Now watch this animation of constantly moving, thickening and thinning sea ice here:
http://www.nsidc.org/news/press/2007_seaiceminimum/20070810_index.html
Scroll down to the middle of the page to:
Figure 4: Disappearance of old ice, 1982–2007
The following study found that if current trends continue, the Arctic summer sea ice will have disappeared by 2013:
Causes of Changes in Arctic Sea Ice; by Wieslaw Maslowski (Naval Postgraduate School)
http://www.ametsoc.org/atmospolicy/documents/May032006_Dr.WieslawMaslows...
We should be very careful here at TOD with global warming chatter. None of us is an expert and we should only provide links to professional sites and LEARN what they have to say.
And NASA climatologist James Hansen would answer to some of the comments: there is a well documented warming trend and on top of that there is varying chaos.
As to those cold snaps all around the world, this may be the result of increased heat exchange between the equator and the poles. But I am not a climatologist and I encourage everyone to google whether any research has been published on this topic.
Moscow had warm 0 temperatures over many days in what should normally a bitter cold January. So given the research referred to above, we'd be kidding ourselves to call off global warming.
In fact, by blowing unprecented amounts of CO2 into the atmosphere, there is only one sure thing: we are doing a life experiment with the world's climate.
If you want to check on how average surface temps are going up, read this:
Discussion of 2007 GISS global temperature analysis is posted at Solar and Southern Oscillations
http://www.columbia.edu/~jeh1/mailings/20080114_GISTEMP.pdf
Another good place to check for information from the experts:
http://www.realclimate.org/index.php/archives/2007/12/notes-from-the-gat...
It is interesting to see how a post on China and Coal becomes an excuse to reference Mann's website, an “expert” whose work has been discredited several times over.
There were some issues regarding Michael Mann's early work, but others have found similar results since which support the MBH results. I know that there are some who have claimed to have debunked Mann, et al., but they have produced alternative analytical efforts which also contain errors. Can you point to any peer reviewed studies which refute the basic results of Mann, et al.?
E. Swanson
It's unfortunately predictable that a post on China and coal attracts AGW deniers ;)
Matt, can you remind us when the IPCC forecast the disappearance of summer Arctic Sea ice and when that forecast was made?
Intuitively, it seems strange to focus on Artic ice since it averages about 10 feet thick and covers a tiny area compared to Antarctic ice which is 10,000 feet thick. Might as well measure the ice during the winter in my swimming pool.
Off topic I know, but Euan you were wondering if Scotland could get by without nukes a while past.
http://news.bbc.co.uk/1/hi/scotland/highlands_and_islands/7208991.stm
Massive wind farm 'turned down'
The wind farm was to be built at Barvas Moor on Lewis
Plans to build one of Europe's biggest wind farms on the Isle of Lewis are set to be turned down, BBC Scotland understands. The BBC's Gaelic news service, Radio nan Gaidheal, has learned that Scottish Government ministers are "minded to refuse" the 181 turbine scheme. More than 5,000 letters of objection to the proposals were received by the Scottish Government. It is believed environmental concerns are behind the decision. An official announcement from the Scottish Government is not expected for a further two or three weeks. This is going to allow us to go back to living like normal people Dinah MurrayAnti-wind farm campaigner
A Scottish Government spokesman said: "No final decision has been taken and ministers are working towards finalising and announcing a decision in the near future
Mudlogger - where do you hang out?
The thing that worries me about this type of outcome on Lewis is that a proper debate has not been held. One group of environmentalists say "we need wind power to reduce CO2 emissions". Another group of environmentalists say "windmills on Lewis will create more CO2 than is conserved when the peat gets dug up". And yet another group says "the windmills will spoil the view and tourism - which of course generates lots of CO2".
The real debate should focus on where our electricity will come from in 2020, does wind have a roll to play - and if so is Lewis a good / the best place to locate a massive on-shore windfarm?
Those who objected to this on grounds of scenery and tourism should be placed on a list to be first to be disconnected from the grid when power shortages hit.
You came to my work place at the invitation of my MD to give a presentation to the staff about PO last year. (My MD is very PO aware).
The pizza was crap wasnt it?
:-)
Ah Ah!
The pizza was OK.
The scenery-and-tourism thing is a problem in the US as well, with everything from wind turbines off the eastern seaboard to oil wells anywhere off Florida. I'm afraid that the part of it that pushes my buttons is that I don't for the life of me understand how people too stupid to think of anything to do with life except piddle it away mindlessly changing bedsheets for tourists expect even to survive in the energy-starved world of their BANANA dreams. In that fuel-free, wind-turbine-free, everything-free world, the tourists simply will not be arriving, certainly not en masse as now.
>"I can speculate that some kind of decrease in the sun's activity must have occurred, facilitating abnormally low temperatures in the Arctic and speeding up the formation of the polar highs..."
There is no evidence to backup this statement. The British Met office earlier this year clearly predicted and attributed the cooling for 2008 to the La Nina that developed last summer.
http://www.metoffice.gov.uk/corporate/pressoffice/2008/pr20080103.html
Please check the effects of the previous "Al Niña" phenomena.
That image is somewhat cherry-picked. If you compare the ice coverage to last year the differences are quite so dramatic:

Perhaps the record ice growth rate, the result of rapid cooling in the Arctic in the winter, is due to the record expanse of 'black' sea (rather than 'white' ice) radiating heat to space, sometime post autumn equinox Sept 23rd as day light hours diminish, the summers positive black feedback warming, switches to cooling. Thus greater seasonal swings in Arctic temperatures result as a higher fraction becomes black.
Just a personal observation but here in Ireland we have had one of the warmest wettest winters in years. Yesterday it went from 13 Deg C in the morning to 3-4DegC in the evening with hail/sleet back to 12 Deg this morning.
Here in Cambridge, UK the temperature reached 15C on the 20th Jan, and has averaged 7C this year so far. Just as well gevn the uncertain natural gas supply these days. We did have a cold week just before Christmas.
When I was a child (50 years ago) we had many colder winters in the southern UK than the current one. Most years brought snow.
Since then, winters have warmed. Rarely see snow now, & it melts within 1 - 2 days.
Nevertheless there have been the occasional cold ones - e.g. mid-80s. My max/min daily readings showed below -20 deg C for several weeks & we had packed snow on the roads.
Nothing like that since.
The UK Met Office predicted this winter to be colder than last but warmer than average - it's playing out that way so far...
So, cold winters elsewhere - just natural variation, maybe getting more chaotic?
I don't see any conflict with Global Warming predictions...
Dave, Oxford, UK
Cold weather may be one of the reasons for such tensions on the Chinese electricity market, but in my opinion, the main one appears to be the growing coal costs and the state-fixed electricity costs.
In such a game, Chinese electricity operators may have interest to switch off their power plants, since they do not earn enough money when producing.
In order no to be lynched by the population, they may then explain their position by using exotic arguments on weather - personally, I don't see why some snow in Baghdad would impact the Chinese coal supply chain.
I Just received this from a contact of mine about the coal shortage in China. It is from a report by Credit Suisse:
"China is experiencing a severe power shortage, according to the People's Daily
newspaper. Reportedly, thirteen provinces are already rationing their electricity usage,
primarily due to reduced coal supply. Part of the supply problem lies with the closure of several
small illegal coal mines, while coal deliveries to power plants have also been disrupted by the
bad weather conditions. In addition, the recent price cap on public utility tariffs introduced by
Beijing, aimed at easing inflationary pressure, also added to the strains on electricity
producers in China, which are already burdened by increases in coal prices. If the squeeze
from rising costs, capped fees and limited coal supplies continues, we think some power
stations may have to shut down or cut production for fear of incurring increased losses from
attempting to maintain normal production. According to the State Grid Corporation, China's
state electricity distributor, 5% of coal-fired power plants have been shut down and the
current inventory of coal reserves would only be sufficient for 7 days of current electricity
supply in China. We expect the power shortage may even worsen further in the summer,
when China's electricity demand usually peaks, but especially so this year due to the added
demand caused by the Beijing Olympics. In our view, the problems of persistent power
shortages may not be eased in near term, as China's electricity problem is also caused by
capacity constraints. China's existing power capacity remains insufficient to cover peak
demand, as the government slowed down significantly its infrastructure investment in 2004's
austerity program. However, while the government is determined to eliminate this shortfall
with new investment, it will likely be some time before periodic shortages ease."
http://news.bbc.co.uk/1/hi/world/africa/7208542.stm
SA gold mines shut by power cuts
Mining plays a key role in South Africa's economy
South Africa's biggest gold and platinum mining companies have suspended production because of a spate of recent power cuts.
They took the drastic measure after state power company Eskom said it could not guarantee supplies, raising fears of miners being trapped underground.
South Africa is one of the world's biggest producers of platinum and gold.
The power cuts are a "national emergency", according to Public Enterprises Minister Alec Erwin.
"We are viewing the next two years as being critical," he said but denied reports that the power cuts could hit South Africa's hosting of the football World Cup in 2010.
Mudlogger - it would be even more worrying if the headline was "SA coal mines shut by power cuts"
I thought so too.
Sasol is loosing its ability to do Fischer Tropsche CTL as well
That means no diesel, no crop harvesting and no food to market.
As set out in the Olduvai Theory - Electricity underpins Civilisation.
We should stop thinking in terms of Peak Oil and start thinking in terms of Peak Energy.
Also, see above regarding Wind Farms on Lewis - Blocked by Objectors.
They had a guy from Lewis on Radio Four on the way home from work tonight:
''We need this, what do they expect us to do here?, how are we going to keep our young people if there is no work here? how will we keep our culture alive?''
Quite.
Interestingly, Leanans saturday drumbeat headlines with exactly what you just anticipated: SA Coal mines shutting down due to electricity blackouts...
http://www.bloomberg.com/apps/news?pid=20602099&sid=aoRmNutlwptw&refer=e...
If you take apart this article you see that various reactions are taking place which can bne applied everywhere else:
1)National Emergency is recognized only after occuring-no foresight here
2)Plan of action is announced
a) Raise end customer prices 14-20% on elctric supply in order that new conventional supply buildup over 5 years can be finaced.
b) Conserve energy
c) Rationing plan
d) alternative energy sources encouraged with subsidies-solar thermal
e) price controls on and import of cooking fuel for the poor.
f) switchover from wasteful forms of use to efficient forms,i.e. light bulb switch
We have had a lot of discussion over what to do but I think and bitching that nothing much is happening. It seems typical that nothing happens until a crisis but it is fairly predictable what will then be done with various time frames for various courses of action, alternatives, conventionals, price controls, rationing, imports, etc.
Any thoughts as to the weather patterns for the next 30 days or so?
My experience is that once you get settled into these kinds of weather patterns, they tend to last until spring. One big reason for this - if you get snow cover over a very large area, then the sun isn't able to warm the ground as effectively as it would were the ground to be bare. That's the way it used to work in Minnesota when I grew up as a kid - if they got a good snow cover in Canada early in the winter, then the odds were higher for a cold winter for those of us a little further south.
About the Milancovich cycles, I remember reading that this Interglacial period is different from normal in that it will last a lot longer, possibly 50,000 years. When the axis shifts and the Sun is closer to the Earth in the Northern Hemisphere Summer it will get warmer. So there may soon be no conflict between nature and global warming.
That's right, there is just one of the three cycles that's in "forcing" mode I recall, still, the system is very sensitive and this might contribute to the freak out.
Just for review:
http://en.wikipedia.org/wiki/Milankovitch_cycles
Please take a few moments to ponder the profound difference between climate and weather.
The word "climate" is absent from the text.
I think he was referring to the usual "if it's cold outside, Rush/Sean/Glenn have convinced me that must mean global warming is all bunk!" mentality, not to your article.
Also see coal estimates in the US by the National Academy of Sciences;
http://books.nap.edu/openbook.php?record_id=11977&page=44
No surprise, but CNBC is reporting that China is stopping all (coal) exports.
Despite this impressive buildup, December is pretty much inline with the 1979-2000 trend:
Note also that there is ice and ice, old multi-year ice is disappearing in the Artic and ice older than 9 years has vanished.
I didn't missed this sentence. I just wanted to emphasize the point that within a 40 years context the anomaly trend for the Arctic ice is still holding.
NPR's Morning Edition, a little bit before before 8AM Eastern today had a story that said that energy demand will outrun supply by (?)2011(?). I tried finding that story on their website, but I don't see it.
Anybody here hear it?
That may have been this morning's Marketplace segment. The story is also on their homepage. Scott Jagow, their host, was discussing the internal Shell memo that was released yesterday, with their European correspondent, Stephen Beard. The Shell memo was in yesterday's Drumbeat and is Jerome's other big article on TheOilDrum this morning.
Wow, this news cycle is causing me to lose my mind. I know I read about that Shell letter yesterday, but I don't see it in yesterday's Drumbeat. Now I'm mixing up Jerome and Luis as well. Man this has been a long week.
Hi Luis,
Thanks for the great post. It gives us plenty to think about.
Dave
Hi Dave, if you haven't done so, please check the comment left by Rembrandt up the thread. I think Coal will make big headlines in 2008, for the wrong reasons.
Hi Luis,
Thanks for the lead, and Rembrandt, thanks for the article. I am surprised by the electricity supply problems in China. I am just guessing, but since the article you linked to talks about assigning railroad priority to coal, this could be a transportation bottleneck rather than a mine production limit. A lot of their coal is also shipped by truck, and there have been shortages of fuel for trucks.
Dave
I read an article on the net about coal reserves, and how the estimated remaining years of available coal has changed so much and so many times over the years. Here are a few highlights: In 1868 it was believed there was 10,000 years worth of coal, then in 1905 that figure was revised down to 1,000 years, in 1967 it dropped to 500 years, in 1990 it slid downward to 200 years and now it ranges from 15-25 years depending on the source and depending on how fast we use it. Interesting isn't it how those 10,000 years of coal reserves went so quickly!
Fact is, the world uses the equivalent of 200 million barrels of fossil fuels a day, including oil, gas, and coal. And at that rate, which is always rising due to increased economic productivity, all 3 main fuel sources will peak and then steeply descend. As we run low on oil and gas, coal use as a percentage of energy usage will increase dramatically. Probably faster than we can afford to sequestor the CO2.
Imagine how much energy we'll need if we slip into a new ice age? We need Fusion energy now, not in 2030-2050.
It seems to me that supply estimates for coal are highly speculative.
1st, many analysts have made the incorrect assumption that the declining average BTU content of US coal is a sign of peaking supply. In fact, it's a shift to lower-sulfur western coal - there's plenty of higher BTU coal left in places like Illinois, if we're willing to pay to scrub out the sulfur.
2nd, new coal plants are having a very hard time getting permits, and wind is expanding very quickly - the rate of new installations doubled from 2006 to 2007, and there's 125GW of wind interconnection requests pending, far more than than any other source.
Oil shale in the US is likely to be a very expensive & dirty way to get oil, but as a primitive form of solid hydrocarbon (kerogen) it works perfectly well as an electrical generation feedstock - it's been used that way for many decades in Europe. And, as we know, there is an enormous amount of it.
So, in North America at least, it's hard to imagine electricity shortages due to supply limits.
We're are looking pnm electric.
What's going to happen with coal?
cheers
Not content with merely using very obscure English words, we are now inventing new ones.
perdure (adj): contraction of "persistent ordure" ?
Whatever the language, the weather we are seeing is consistent with global warming. Rapid spread of arctic ice was expected after last summer's record melt. How thick it is remains to be seen. In southern Asia at this time of year temperatures are normally very cold. The unusually great snowfall indicates more water in the system and perhaps even a rise in temperature. England looks as though it is going to have a record warm and wet January. We are going to have to get used to extreme weather events, warm and cold, at different times and different localities as global average temperatures increase.
Naturally there is a global aspect to coal shortages, coal prices and energy shortages....
1. South Africa's ESKOM rolling blackouts
The SA Power Pool - (this was Jan 2007) a body that co-ordinates the planning and operation of electricity power systems among South African Development Community member states — total annual demand will clock 44 689 megawatts by the end of 2007 against combined net generation capacity of 45 000MW.
At the current growth rate, total regional demand for electricity is projected to hit 45 827MW by the end of 2008; 47 920MW in 2009; 48 795MW in 2010; and 50 291MW in 2011.
Capital projects totalling US$5.2 Bn are required simply to meet the projected shortfall in the region.
Created in 1995, the South African Power Pool (SAPP) aims to link SADC member states into a single electricity grid. The national utilities currently participating in the SAPP are Angola's Empresa Nacional de Electricidade (ENE), the Botswana Power Corporation (BPC), the Democratic Republic of Congo's SNEL, the Lesotho Electricity Corporation (LEC), Malawi's Electricity Supply Commission (Eskom), Mozambique's EDM, Namibia's Nampower, South Africa's Eskom, the Swaziland Electricity Board (SEB), Tanzania Electric Supply Company (Tanesco), Zambia's ZESCO, and Zimbabwe's ZESA
One of the points that ESKOM made was that high energy coal was being exported - they were relying on poorer quality coal , much of which had been affected by earlier rains.
2 Australian Coal prices / availability
Dec. 31 2007 (Bloomberg) -- Coal prices at Australia's Newcastle port, a benchmark for Japan, South Korea and Taiwan, traded near a record on concern that demand is outpacing supply.Power station coal, excluding shipping cost, for delivery within three months posted its second weekly gain, settling at $89.69 a metric ton in the week ended Dec. 28, according to the globalCOAL NEWC Index, an Asian benchmark calculated each Friday. Prices are up 85 cents from the previous week and near the US$89.76 record set earlier this month ...
This is not unconnected with the massive storms at Newcastle in early June which disrupted shipping for 2/3 weeks and grounded ships, resulting in a hiccup in the supply chain to China .... remarks above by someone with delays at Newcastle and costs involved by shipping co's.
3. Zimbabwe power problems
Ben Rafemoyo of Zimbabwe's ZESA Holdings said on Jan 6th 2008 that they want to re-open 3 thermal stations at Bulawayo, Munyati and Harare, which have not been in operation due to coal shortages. They produce a combined 150 megawatts when fired to full capacity. Nearly ZIM$1-trillion has been targeted for building up stocks to fire the thermal juniors. He said the payment for coal would be made to Hwange Colliery Company once the 5.4-trillion dollars (Gulp!!!) it was allocated under the 2008 National Budget was released. Hwange recently took delivery of ten modernised haulage trucks from the Chinese based world acclaimed Norinco Industries.
To put this into perspective , Zim whose peak electricity demand is possibly around 2 900 MW, imports at least half of its national requirements from Hidroelectrica de Caporal Bassa of Mozambique, Eskom of South Africa and SNEL.... however paying for it is a major problem.
Hwange mines have payment problems with state owned nearby Hwange power station which has only 2 days stocks.... probably totally unconnected Nick Hoogstraten , major player in Hwange has just been arrested on Forex carges involving US$33 K and some porn... and the ever present Chinese are ...