The European Gas Market
Posted by Euan Mearns on December 11, 2007 - 11:00am in The Oil Drum: Europe
OECD European gas production looks set to peak in 2008. After that, falling production combined with rising demand will see OECD European gas imports wanting to rise from current 197 BCM per annum to 442 BCM per annum by 2020. Where will this gas come from and how will rising European imports affect N America and the rest of the world?
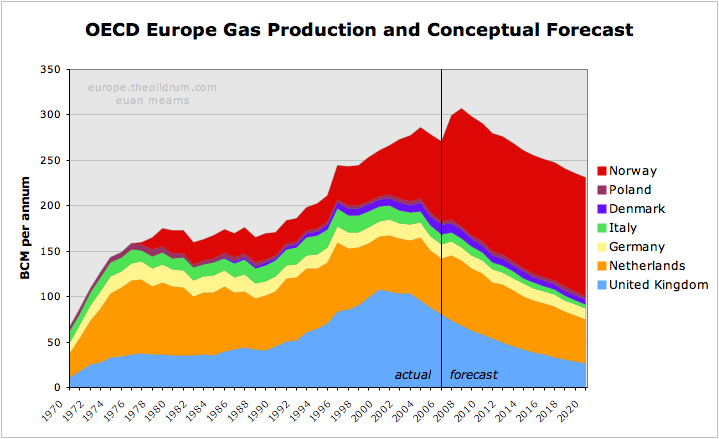
Figure 1 OECD Europe gas production and conceptual forecast. Click all charts to enlarge
Executive summary
- As of 2006, OECD Europe produced 55% of its own natural gas with the majority of gas imports coming from Russia and Algeria.
- OECD Europe has three main gas producers - Norway, The UK and The Netherlands. Norwegian gas production is undergoing a major expansion, but this is forecast to halt at 130 BCM per annum next year for political resource conservation reasons. UK and Dutch gas production are in decline, and combined OECD Europe indigenous gas production looks set to peak in 2008.
- Gas consumption has been rising at 2.6% per annum since 1980 and there are a number of reasons to suggest that rising demand for gas will continue into the future unless it is checked by high price or shortages of supply.
- It is believed that Russia will do what she can to maintain gas exports to OECD Europe. But with their three biggest gas fields - Yamburg, Urengoy and Medvezhye - in decline, maintaining supplies from second tier assets will be a major challenge. In order to maintain supplies to the OECD Europe, supplies may have to be cut to other countries.
- Algeria, Egypt and Libya will all see expansion of gas production in the years ahead, but will also experience growth in indigenous consumption, especially in Egypt. Gas exports from these North African states are forecast to peak in 2015. They may provide an additional 33 BCM of exported gas to the European market.
- OECD Europe gas imports are forecast to grow from current 197 BCM per annum to 442 BCM per annum by 2020 - if we see business as usual growth in demand and consumption. Where will this additional 245 BCM come from? Some may come from N Africa and some from West Africa and Qatar. It seems unlikely that an increase in imports on this scale will be possible and that high price and shortage will ration supply. This market driven outcome may hit the poorer nations hardest and one may suspect this may have a destabalising effect.
Introduction
This post will provide a production forecast for Europe's main gas producers (the UK, The Netherlands and Norway); it will examine existing import patterns in Europe's main gas consumers (Germany, Italy and France) and the ability of gas exporters to meet growing OECD European demand - Egypt, Libya, Algeria, and in particular Russia. This article was initiated as part of study of UK gas security. The UK faces rapidly falling gas production and an equally rapid expansion of imports and the key question for the UK is where will this gas come from? This will be dealt with in a separate post.
There are a number of ways to divide Europe for economic analysis. I have chosen to break out data for European states that are members of the OECD. This includes the important oil and gas producer Norway, which is not a member of the European Union (EU) but excludes the Baltic States, Romania and Bulgaria which are EU members but have not yet joined the OECD.

Figure 2 Map of the European Union.
Turkey is a member of the OECD but lies mainly outside of Europe and is not included in this study. Turkey is a major importer of gas, especially from Russia.
Data sources and gas units
Throughout this article I have used data from the 2007 BP Statistical Review of World Energy. I have also used billion cubic metres (BCM) as the standard unit for gas measurement. According to BP, 1 BCM is equivalent to:
35.3 billion cubic feet (BCF)
0.73 million tonnes of liquified natural gas (LNG)
36.0 trillion British Thermal Units (BTU)
6.29 million barrels oil equivalent (BOE)
Gas production forecast
OECD Europe gas production is dominated by three countries - the UK, The Netherlands and Norway, with lesser but significant quantities produced by Denmark, Italy, Poland and Germany.

Figure 3 OECD Europe gas production and conceptual forecast.
The UK
The changing face of gas production in the UK lies at the heart of Europe's emerging gas problem. In 2003, the UK was a net exporter of gas to Europe but with peak production in 2000 and production now falling at 8.7% per annum it had become a net importer by 2004. The challenge facing the UK gas industry will be the subject of a detailed post.
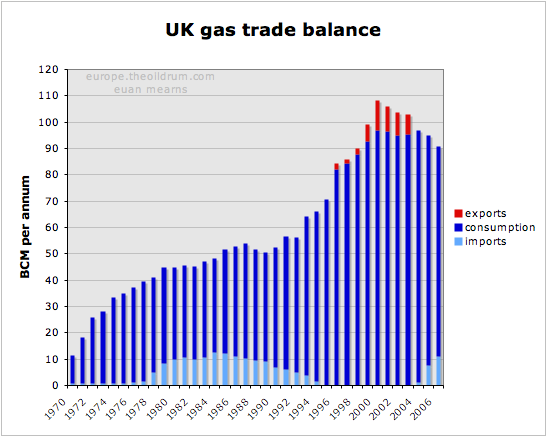
Figure 4 UK gas production and consumption history
The UK forecast is based simply on extrapolating the 8.7% decline to 2020 by which time production is forecast to be 26 BCM per annum. At peak in 2000, the UK produced 108 BCM per annum and in the space of 20 years the UK will have gone from net exporter to a major importer, being dependent upon imports of over 80 BCM per annum.
This view on decline of UK gas production is shared by the UK BERR (Department for Business and Enterprise Regulatory Reform - formerly the DTI). See for example Figure 5.2 in this report.
The Netherlands
The Netherlands is home to OECD Europe's largest gas field. Discovered before WWII, the full extent of the Slochteren Field did not become apparent until the post-war years. It was the discovery of this field in the Permian Rotliegendes sandstone that sparked the exploration for gas and then oil in the North Sea.

Figure 5 Europe's largest gas fields. Data for Slochteren from Rembrandt Koppelaar. Troll and Ormen Lange from the NPD.
Slochteren lies onshore in the Groningen area of northern Holland and dwarfs the giant Norwegian gas fields of Troll and Ormen Lange. Further fields were found around Slochteren in the on-shore and off-shore areas.
Slochteren was never produced flat out and the Dutch government has laterally set a production cap on the field. In the period 2006 to 2015 this cap is set at 425 BCM over the 10 year period. NAM (the Shell - Exxon operating consortium) can optimise production over this time frame but strictly within this overall limit. The production cap on Slochteren has resulted in a long drawn out production plateau analagous to that seen in the Saudi super giant oil fileds - a very enlightened production strategy on behalf of the Dutch government.
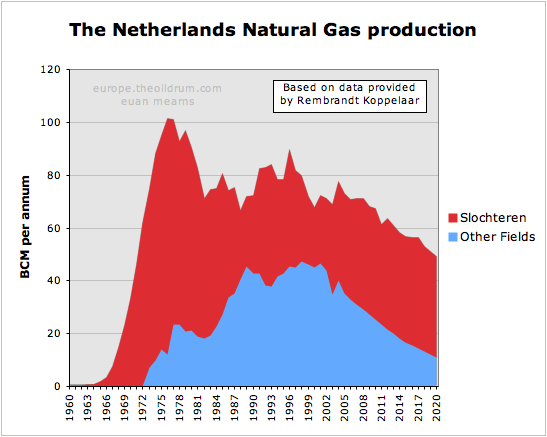
Figure 6 Dutch gas production and forecast based on data provided by Rembrandt Koppelaar. The smaller offshore fields are showing a decline similar to the UK. Note that the volumes here are substantially larger than quoted by BP (see Figure 7). Rembrandt suggested this could be due to adjustment by BP for the energy content of the gas.
The other fields were not subject to regulation and are now in decline in similar manner to the UK gas fields. According to Rembrandt, Slochteren will also begin to decline naturally after 2015 and the bottom line is that Dutch gas production is now in an irreversible decline phase.
The forecast for the Netherlands is based on data kindly supplied by Rembrandt. This has smaller fields declining at a similar rate to the UK, while Slochteren has a somewhat lower decline rate.
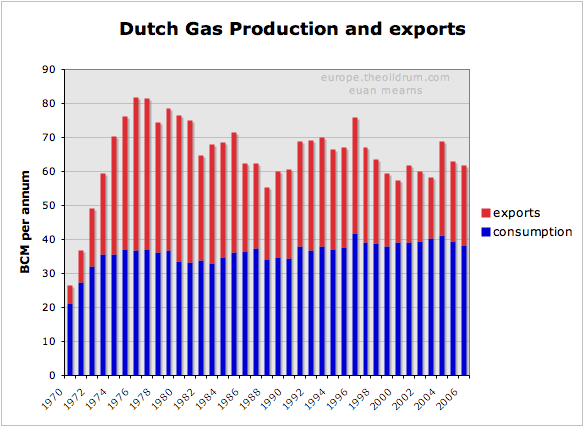
Figure 7 History of Dutch gas production and exports.
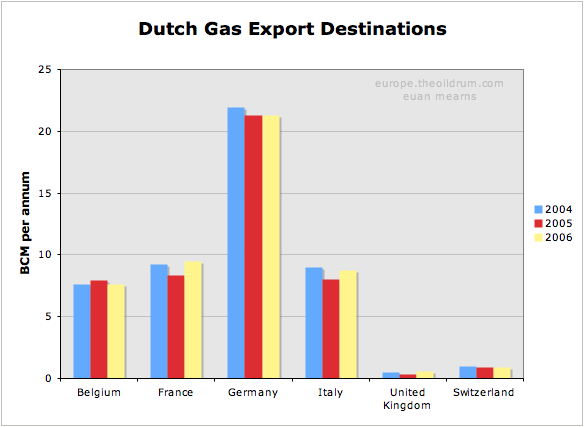
Figure 8 Destinations of Dutch gas exports. Note that the Dutch import gas from Russia and Norway for re-export.
It can be seen that Dutch gas exports have been declining irregularly since the late 1970s and that some day post 2020, the Dutch may become an importer of natural gas.
Norway
Norwegian gas production has expanded rapidly in recent years, mainly the result of the Troll Field development. This expansion is set to go on for another couple of years, but then I suspect the expansionary phase will come to a halt.
In 2006 Norway produced 87.6 BCM of gas. Since then the Langeled pipeline that connects the Ormen Lange Field to Easington in England (and also to continental Europe) has been completed. The capacity of Langeled is about 20 BCM per annum. Furthermore, the development of the Snøhvit Field in North Norway with an LNG train provides Norway with an additional 5.7 BCM capacity.
The Norwegian export pipeline system is reported to have a capacity of 120 BCM per annum. With domestic consumption running at 4.5 BCM and LNG production at 5.7 BCM, future Norwegian production is forecast to run at 130 BCM per annum.
With Europe becoming ever more thirsty for gas, there was a plan to expand production in the Troll Field by 20 BCM per annum. Most significantly, this consent was refused by the Norwegian parliament. Hence Norway is in a position of having ample reserves to sustain a short term production boost, but instead seems to be choosing the path of restrained production which will favour an extended plateau at lower than maximum possible production levels.
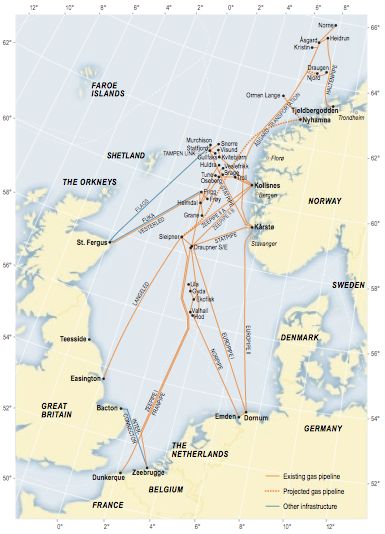
Figure 9 Norwegian gas infrastructure.
The map of the Norwegian gas pipeline export system shows where Norwegian gas enters the UK and Continental Europe. The UK imported gas from Norway during the 1970s and 1980s where gas from the Frigg Field was piped to Scotland via the Vesterled pipeline. Since then the UK has had no need for Norwegian gas - until recently where a massive expansion of import capacity has been built. The Vesterled pipeline is now connected to the Norwegian gas transmission network and has been one route into the UK for Norwegian gas in recent years. There are, however, two new pipeline systems. The already mentioned Langeled pipeline that connects the UK to Ormen Lange via the Sleipner hub. And the Tampen Link that connects Statfjord and other mature fields in the Tampen Spur area to the UK operated FLAGS pipeline system. FLAGS transports associated gas from the northern UK fields to St Fergus in Scotland and since that UK gas production is now in decline, the Tampen Link will fill that surplus capacity - for a while at least.
Five other pipelines make landfall in continental Europe at 4 import terminals. Three pipelines feed two terminals in North Germany. And one pipeline lands at Zeebrugge in Belgium and one at Dunkirk in France. These entry points are connected to a broader European gas transmission system which pipes Norwegian gas as far as Spain, Austria, the Czech Republic and Poland.
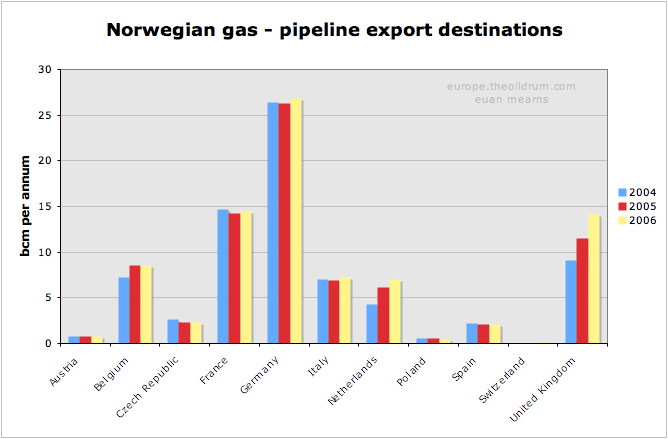
Figure 10 Export destinations for Norwegian gas. Up until 2006, all Norwegian exports were via pipelines to Europe. In 2007, Norway opened its first LNG train and it will be interesting to see where these LNG exports end up.
It can be seen that Germany is by far the largest importer of Norwegian gas, followed by France, Belgium, the UK and Italy. One curiosity in this data is that the Netherlands are shown as a net importer of Norwegian gas. I can but speculate that The Netherlands are importing Norwegian gas to meet export contracts whilst conserving their own gas reserves.
Demand and import patterns
Natural gas consumption within OECD Europe has grown on average at 2.6% per annum since 1980. Back in 1965, Europe consumed less than 25 BCM per annum and this grew to over 470 BCM per annum by 2005, fuelled by North Sea gas. Higher prices and shortage of Russian supply saw consumption fall in 2006.
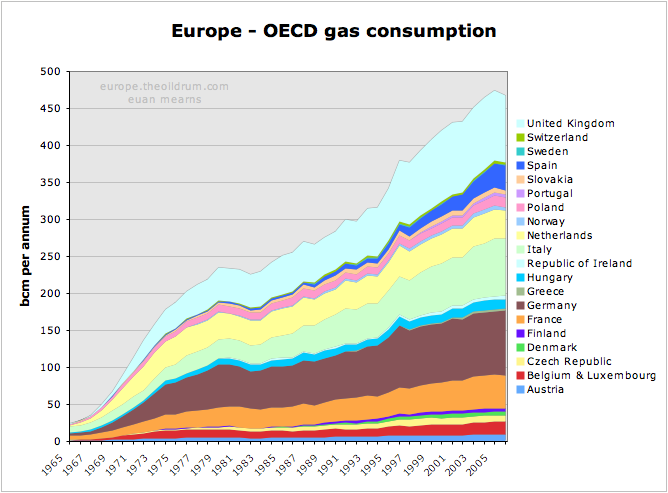
Figure 11 Forty years of gas binge in OECD Europe.
Where next for European Natural gas demand? Will the past trend continue, or will high price curtail demand? This is impossible to answer, but there are a number political, demographic and resource factors consistent with demand continuing to grow unchecked.
- Growing prosperity in former Eastern European states leading to growth in energy consumption.
- Migration from East to West placing greater strain on infrastructure and energy use in the West.
- Migration from Northern to Southern Europe leading to greater prosperity in the latter and ever increasing energy needs - see for example gas consumption data for Spain.
- Climate policies which as a quick fix continues to drive gas power generation forward as a more efficient and CO2 friendly means of generating electricity.
- Pending shortages in oil supplies may lead to substitution by natural gas in automobiles.
If demand for natural gas continues to grow then source of supply and the security of that source is highly relevant. The following section shows the main sources of supply for Europe's main consumers (excluding the UK). One thing all gas import strategies have in common is diversity of supply.
Germany
Germany has some significant and stable indigenous gas production, but is heavily dependent upon The Netherlands, Norway and Russia for pipeline imports. With Dutch gas production in decline, Germany will presumably be looking to increase supplies from elsewhere.
The cornerstone of the German strategy is the Baltic pipeline that will assure supplies of Russian gas direct to Germany that will by-pass former Soviet republics and East European states.
Without LNG, the German strategy seems constrained, since falling UK and Dutch production will place greater demand on Norwegian and Russian gas from several other states.
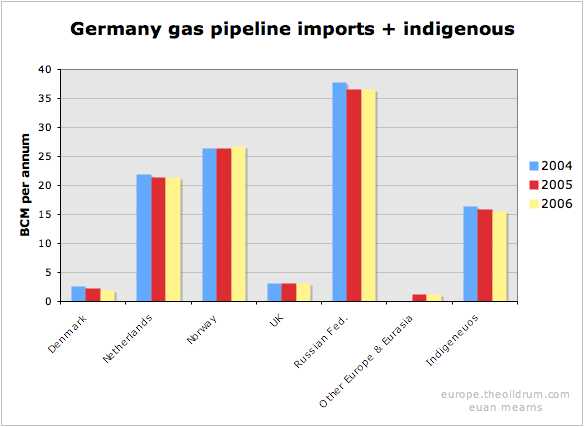
Figure 12 The import sources of gas to Germany.
France
France is unique among major European gas consumers with no indigenous gas production. France produces no oil and only a little coal - hence their reliance upon nuclear energy for power generation.
Like Germany, France relies heavily upon Dutch, Norwegian and Russian gas pipeline imports. France also has a mature LNG import trade with significant imports from north and west Africa.


Figures 13 & 14 The import sources of gas to France.
Italy
Italy has significant but falling indigenous gas production. It also has a highly diversified gas importation infrastructure born in part from its geographic location. Italy imports gas from Norway, The Netherlands and Russia but is also linked to Algeria and more recently Libya by pipeline.
Italy also imports small amounts of LNG, mainly from Algeria. Note how there were significant imports from Nigeria in 2004 - but then nothing. It seems these cargoes may have switched to France in 2005 / 06.
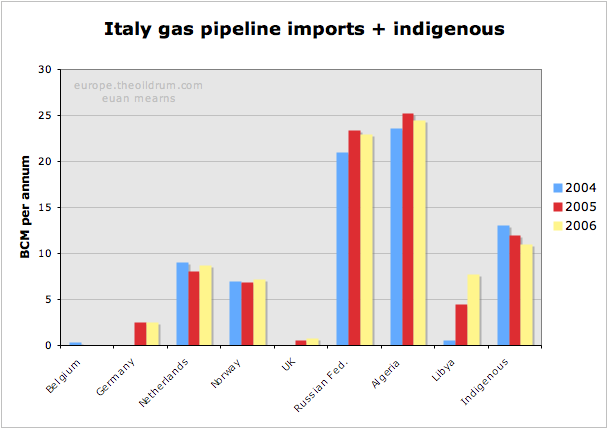

Figures 15 & 16 The import sources of gas to Italy.
Current and future sources of supply
The chart shows that Russia and Algeria are by far the most important sources of imported gas to OECD Europe. This raises the questions of whether or not these countries will be able to maintain or increase future supplies and if not, where will Europe's growing thirst for gas be met in the future?
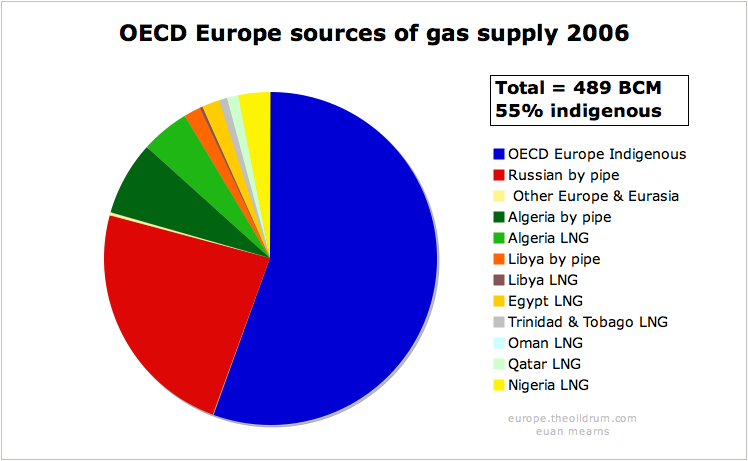
Figure 17 Sources of gas in OECD Europe in 2006.
Russia
Russian gas production had an interim peak in 1991, and with the fall of the Soviet Union went into decline for a number of years. Since 1997, production has begun to rise again and a new high was reached in 2006 of over 600 BCM per annum. The $60K question is where next for Russian gas production? This question is just as important as the future direction of Saudi oil production.

Figure 18 Russian gas production, consumption and exports.

Figure 19 Destinations of Russian gas exports
Russia exports less than one third of its gas production. The majority of exports are to OECD Europe, though a significant amount still goes to former republics. But the amount going to Ukraine, Belarus and Moldova is not documented in the BP statistics, and is presumably included with Russian consumption data. The structure of Russian gas production makes exports vulnerable to any down turn in production and / or increase in domestic consumption. Russian gas exports have been essentially static since 1990, and with the largest fields in decline (see below) it seems unlikely that Russia could at this stage raise production to meet the rising import requirements of OECD Europe.
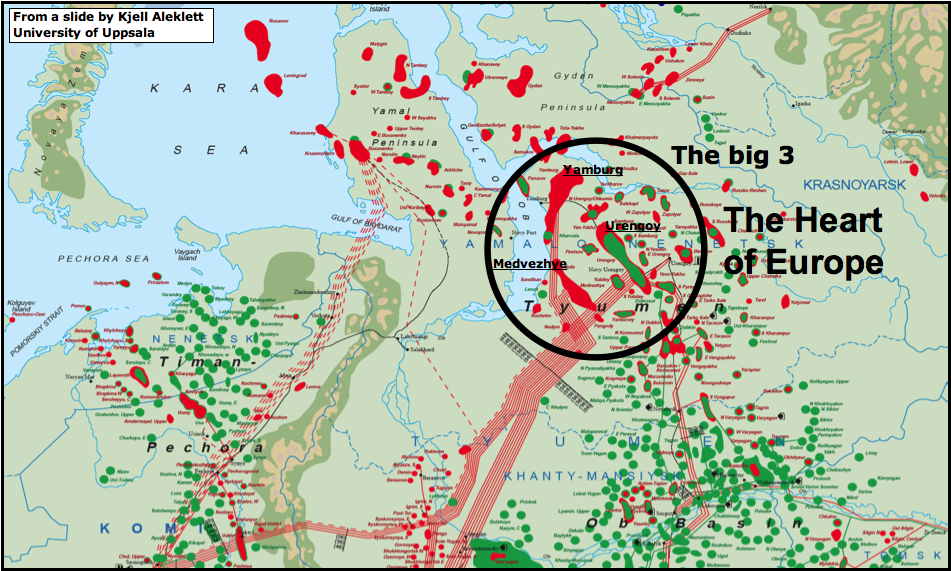
Figure 20 Map showing the west Siberian gas fields of Russia. The three giant fields of Yamburg, Urengoy and Medvezhye have historically provided the bulk of Russia's gas. All three are now in decline (see below). Much of Russia's remaining potential lies in this area, particularly on the Yamal peninsula, to the left of the circle. The map is borrowed from a presentation by Kjell Aleklett.
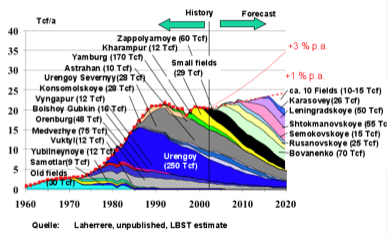
Figure 21 Russian gas production forecast by Jean Laherrere showing how second tier fields may compensate for decline in the three giants - Yamburg, Urengoy and Medvezhye.
Historically, more than 50% of Russian gas production has come from 3 giant fields - Urengoy, Yamburg and Medvezhye. This excellent chart (unpublished) from Laherrere shows that all three of these core producers are in decline. Since Russia has relied upon these three supergiants for core production they now have an inventory of second tier giant fields to develop that may compensate for the decline from The Big 3, as shown on Laherrere's chart.
The challenges for Gazprom are immense. Bovanenko lies on the Yamal peninsula below permafrost. It is at the end of proposed piplelines shown as dashed red lines on the map above. Shtockman lies out of helicopter range in the Barents Sea. Recent reports suggest that the Russians want to use a floating nuclear reactor to power the production platform.

Figure 22 Russian gas production scenarios by Jean Laherrere. WEO forecasts show rising consumption matching rising production with flat exports of around 200 BCM per annum.
This new chart from Laherrere 2007 shows a peak in Russian gas production about 8 years from now with unconstrained production which is unlikely to happen. Instead, constrained production as indicated by the slowly rising WEO 2006 forecast matched by rising consumption will give rise to relatively flat gas exports forward to 2020. So it seems likely that Russia will be able to maintain gas exports but will unlikely be able to increase exports to compensate for falling OECD Europe production.
A critical geo-political question, however, is how these exports are distributed in future? The Sakahlin projects will see East Siberian gas entering the Asian markets for the first time. Furthermore, the Baltic Gas Pipeline will witness a new prioritisation of gas energy security in Germany and western Europe.
The Baltic Gas Pipeline, which is under construction under a joint venture between Gazprom and German companies BASF and E.ON, will deliver 27.5 BCM per annum direct to Germany in the first instance with the option to rise to 55 BCM. All of OECD Europe's gas from Russia currently has to cross The Ukraine and then either Slovakia or Poland in order to reach the main destinations of Germany, Italy and France. As we saw in the winter of 2005 / 6, Russia struggled to meet all commitments given extreme cold weather at home and cut gas supplies to some unfavoured former Soviet enclaves. The spat with Ukraine at that time highlighted how dependent OECD Europe was on the goodwill of the Ukrainians and the Baltic Pipeline circumvents that problem, providing gas security to Germany at least.
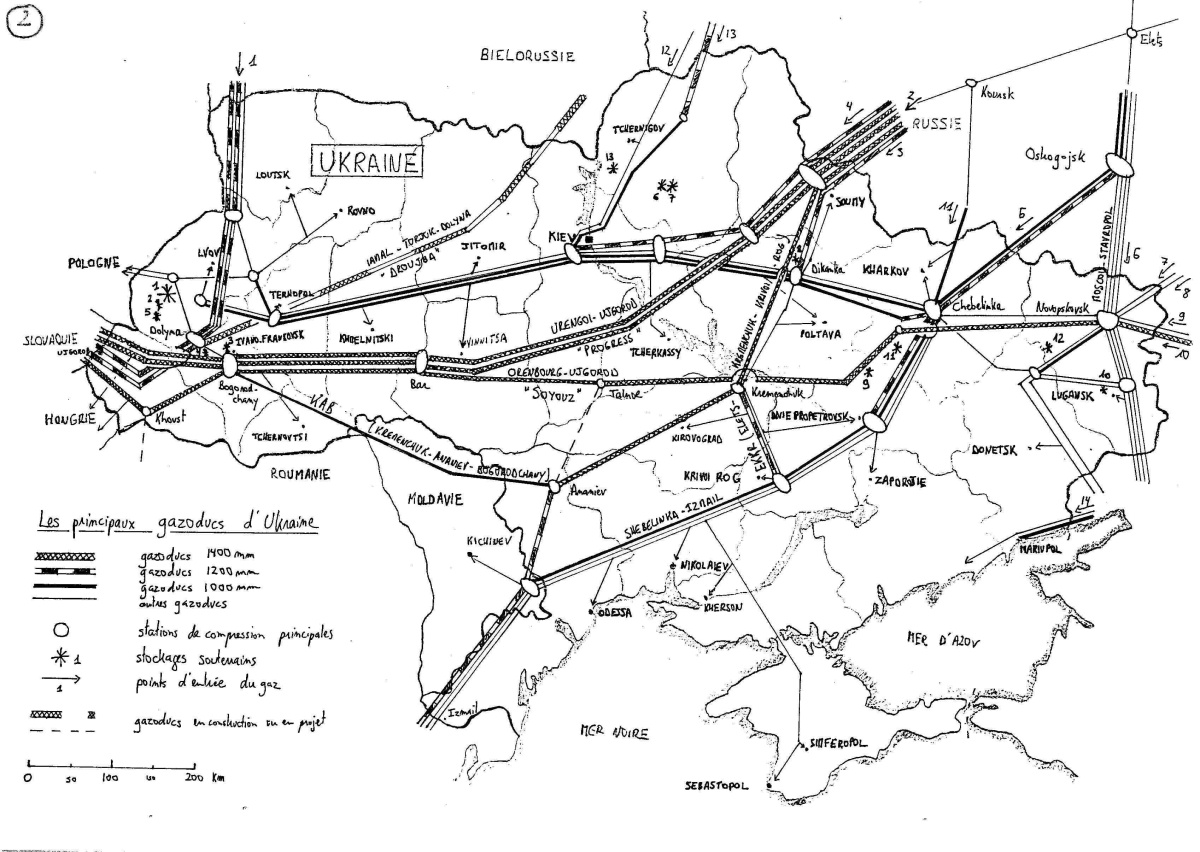
Figure 23 Map of pipelines in Ukraine that carry Russian gas to western Europe via Poland and Slovakia. From Ukraine vs Russia: Tales of pipelines and dependence by Jerome a Paris
The Baltic pipeline will be fed primarly by gas from a new field. The Yuzhno-Russkoye field, which recently started production, is located in the same area as Urengoy, is included in Laherrere's chart and is one of the new fields that will offset decline from The Big 3. This new export capacity, therefore, does not necessarily represent new productive capacity but merely a more secure route for Russian gas into the OECD.
OECD Europe currently receives 115 BCM per annum from Russia, so the Baltic pipeline may eventually secure almost half of those deliveries. However, should OECD Europe face gas shortages, it is those countries at the end of the pipeline that will still be most vulnerable. Some interesting negotiations may lie ahead.
In summary, it is exceedingly difficult to predict how reliable Russian gas exports to OECD Europe will be in future. It seems most likely that Russia will maintain current production levels of 600 BCM per annum until 2020. However, increasing domestic consumption, and exports to East Asia may see gas exports to the west declining. Germany will be in the strongest position to secure supplies. If the remaining supplies are rationed by ability to pay then some of the poorer eastern European states may suffer.
Algeria
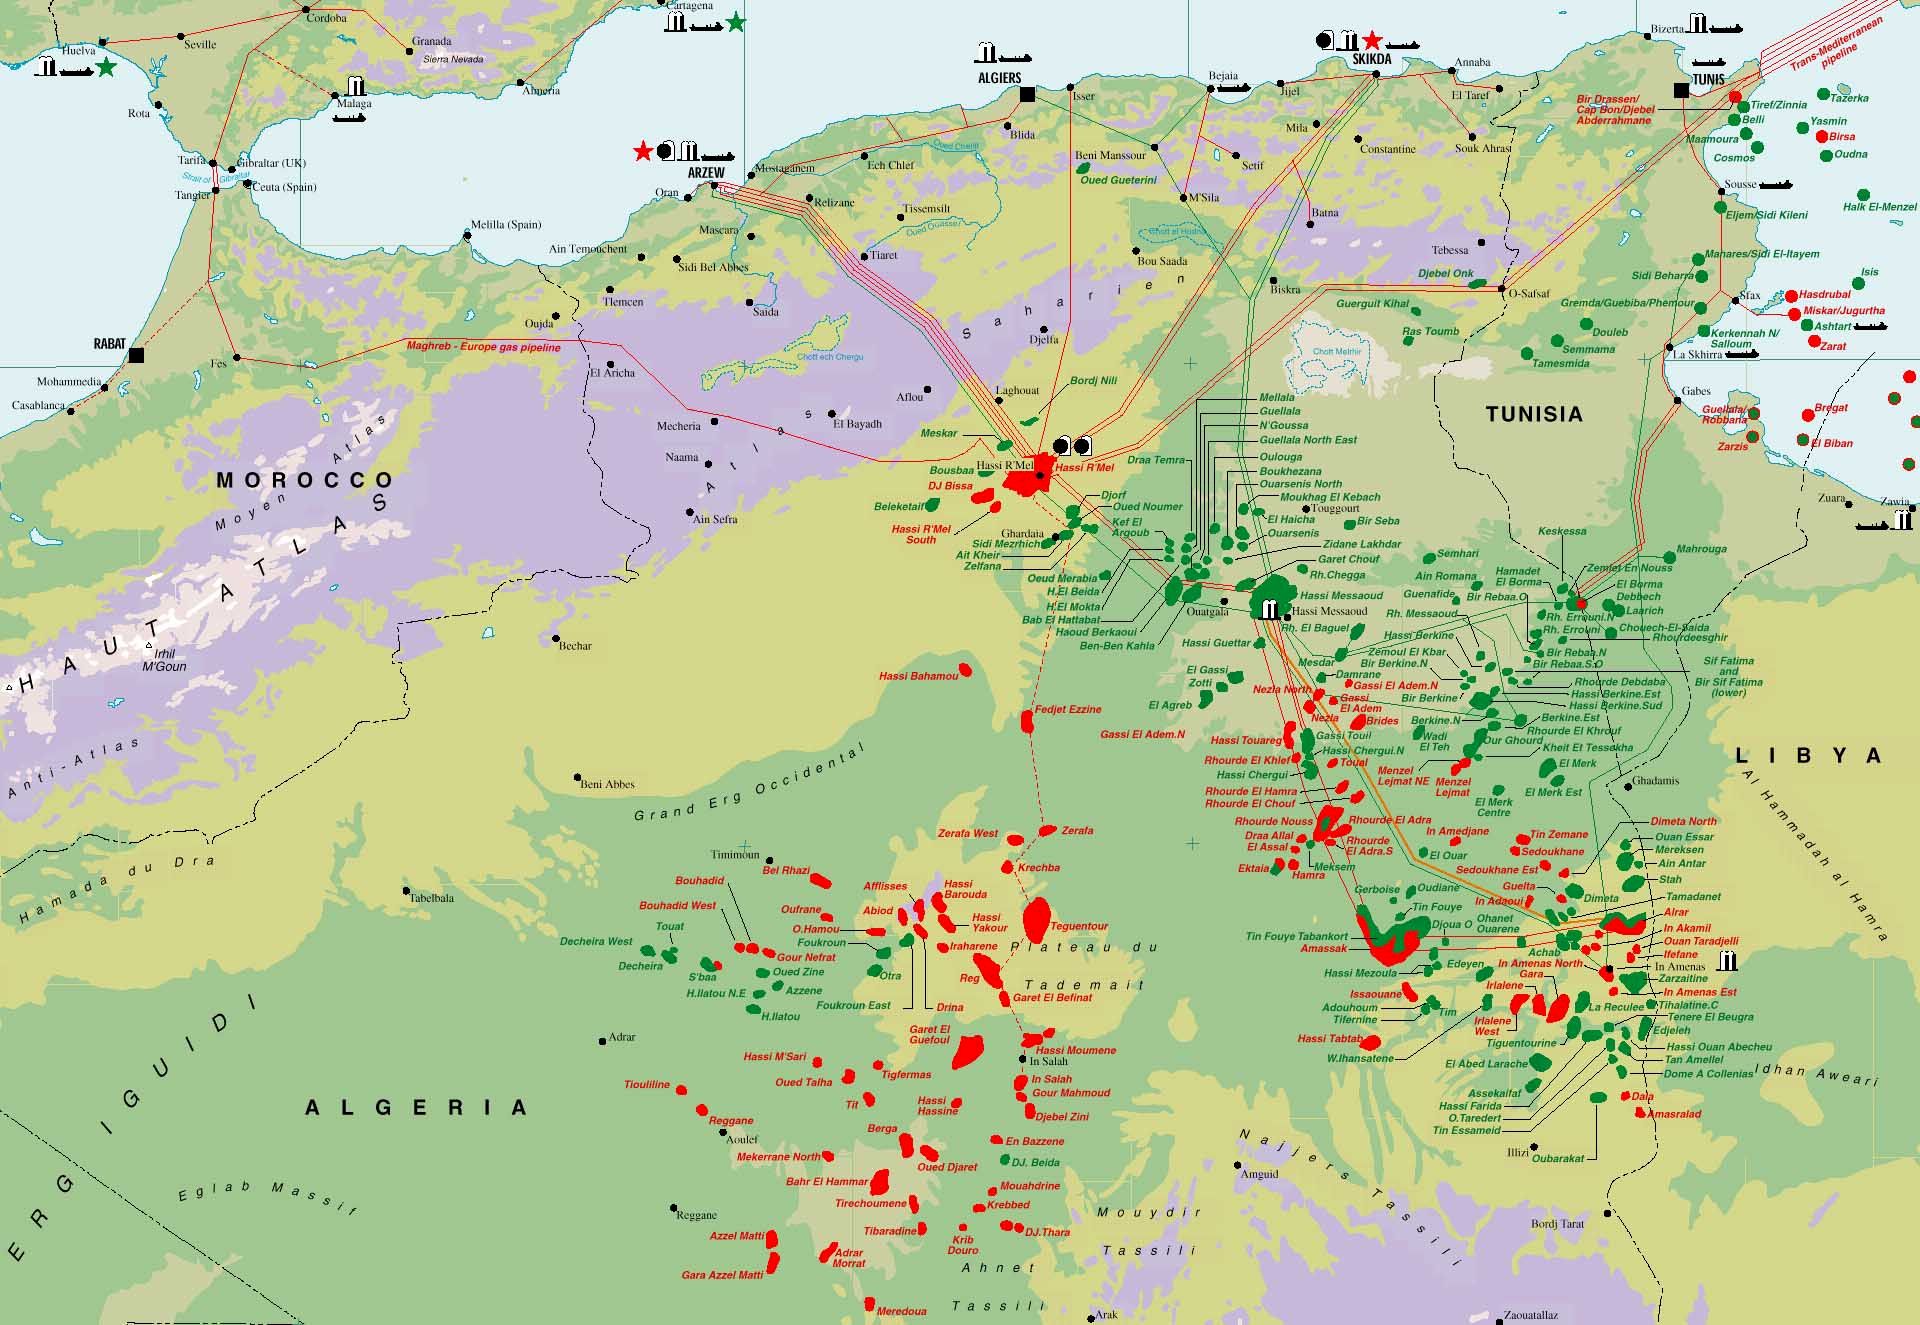
Figure 24 Map of oil and gas infrastructure in Algeria. Europe is fortunate to have gas rich North Africa lying off its southern shores.
According to the BP Statistical Review, Algeria has 4.5 TCM remaining gas reserves placing it number 8 in the world. Accordng to the analysis of Jean Laherrere, Algeria has 4TCM gas reserves remaining, which is in fair agreement with the BP figure. It is fortunate for Europe that Algeria lies close to the southern border of the continent allowing Algerian gas to be piped into Italy and Spain. There is also a significant trade in LNG between Algeria and Europe.
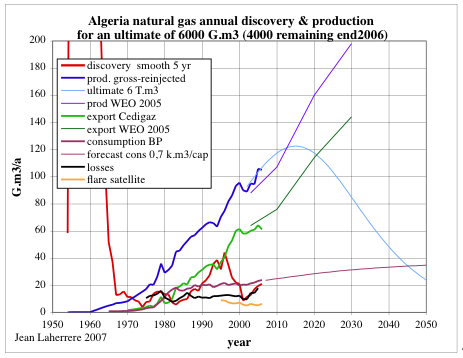
Figure 25 Discovery and production gas models for Algeria by Jean Laherrere.
Laherrere provides a more detailed picture of gas production than can be compiled from the BP data. The main difference is production reported gross of re-injected gas. An unconstrained production peak some 17 BCM per annum higher than today's production is shown around 2015.
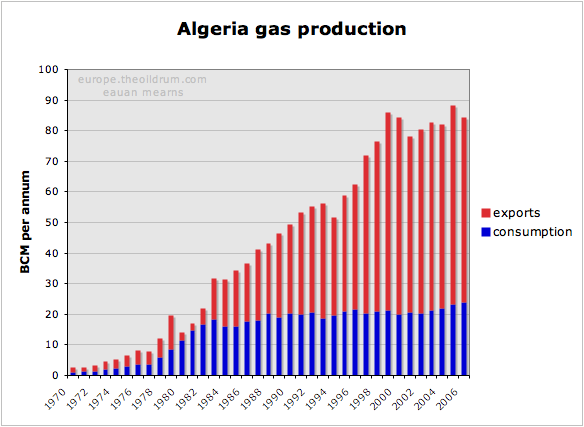
Figure 26 Algeria gas production, consumption and exports. Production and exports have not risen since 1999.
Algerian production grew steadily until 1999 but has since stagnated. There was a new discovery cycle during the 1990s and it is this that may provide impetus for some new production growth. Algerian consumptin is growing slowly and this will consume a portion of new production. New gas export capacity is estimated roughly to be 12 BCM per annum by 2012.
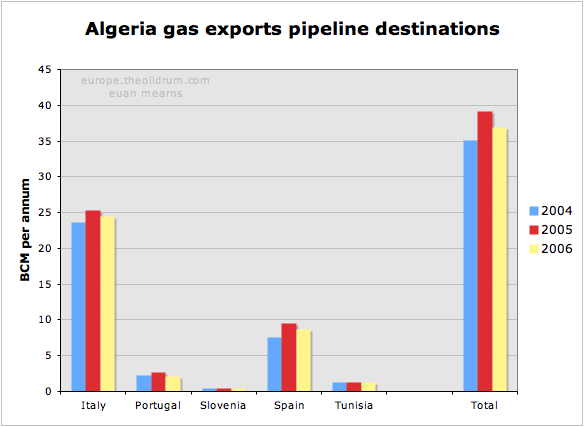
Figure 27 Destinations for Algerian pipeline gas exports.
Algeria exports about 37 BCM per annum by pipeline but is also active in LNG production with LNG exports of 25BCM in 2006. Most of the LNG was exported to Europe (and Turkey) with only small quantities going further afield. Europe is a short trip for an LNG tanker from North Africa, and in terms of tanker utilisation I suspect it will continue to be more profitable to deliver N African LNG to Europe than further afield.
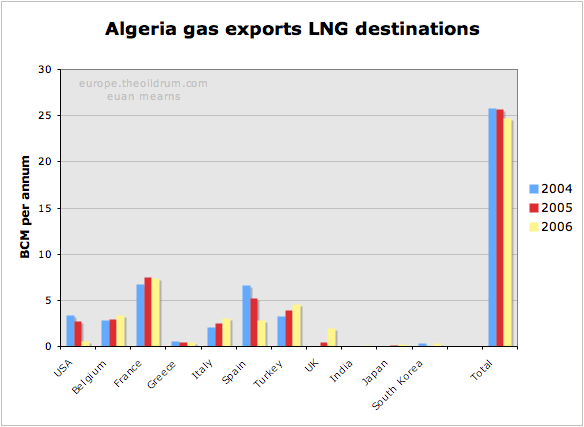
Figure 28 Destinations for Algerian LNG gas exports.
The IEA 2005 energy outlook had this to say:
Algeria is the third-largest exporter of natural gas in the world. Exports are expected to increase as pipeline and LNG projects are brought on line. Gas exports were 64 bcm in 2003 and are expected to climb to 76 bcm in 2010 and reach 144 bcm by 2030.
The IEA target for 2010 looks marginally optimistic and their target for 2030 is a reserves busting feat as indicated on Laherrere's chart (Figure 25).
Libya and Egypt
Both Libya and Egypt have seen rapid expansion of their gas production and exports in recent years. This is set to continue at a slower pace for a number of years according to these forecast models from Jean Laherrere. Growing population and domestic gas consumption in Egypt looks set to outstrip production growth and Egypt may cease to be a gas exporter beyond 2025.

Figure 29 Gas discovery and production models for Libya by Jean Laherrere.

Figure 30 Gas discovery and production models for Egypt by Jean Laherrere. In the export model (Figure 31) I have used the "slow" production model for Egypt.
Combining the three production models of Laherrere from Algeria, Egypt and Libya provides this picture of gas exports from N Africa peaking at around 120 BCM per annum in 2015. That represents a 33 BCM per annum growth from current export levels.
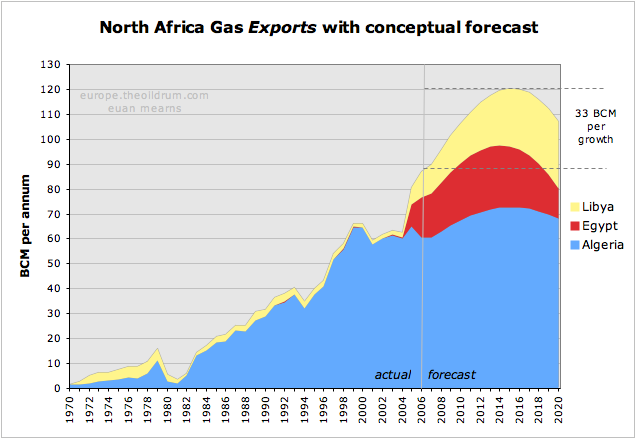
Figure 31 Gas export model for N Africa showing expansion of production and exports in the years ahead but with a conceptual export peak around 2015.
OECD Europe gas security
With OECD Europe indigenous gas production set to decline and good reasons for believing that demand for natural gas will continue to expand in the future, OECD Europe faces the prospect of importing ever larger amounts of gas (LNG) from ever more remote parts of the world. Current imports are running at 197 BCM per annum and the BAU scenario shown below shows imports burgeoning to 442 BCM by 2020. Where will this additional 245 BCM come from?
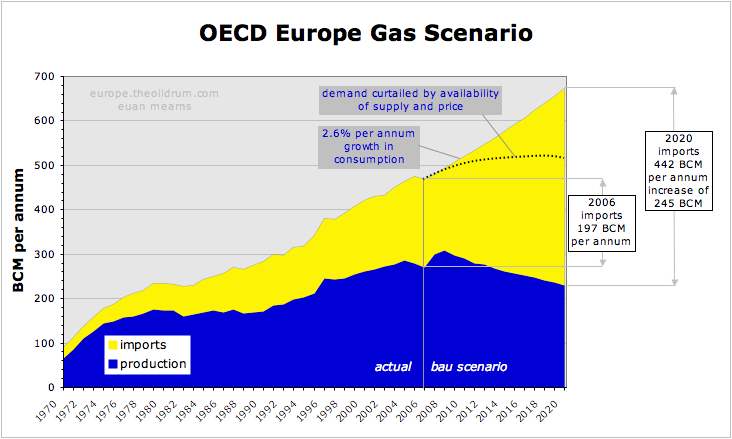
Figure 32 Gas scenarios for OECD Europe summarising the indigenous supply forecasts and demand forecasts from the preceding sections. With the BAU demand scenario, imports will need to grow from current 197 BCM per annum to projected 442 BCM per annum by 2020 - an increase of 245 BCM per annum. It is doubtful that this quantity of gas may be sourced from African and Middle East markets. It is therefore considered more likely that high price and supply shortages will curtail demand for gas. It is conceivable that conservation, more efficient energy use and substitution with alternative sources of electricity may fill the gap left by declining gas supplies.
This is near impossible to answer with certainty. My feeling is that Russia will strive to meet current commitments which will result in their gas exports neither increasing nor decreasing in the 2020 time frame. N Africa will see strong growth in production that will be offset by strong growth in their domestic consumption. Up to 33 BCM of new supply may come from N Africa and it seems reasonable to assume that the majority of that gas will come to Europe. That leaves 212 BCM to source from else where and will inevitably entail a massive expansion of LNG export and import infrastructure beyond that which already exists. In the period 2010 to 2020 Europe will face fierce competition for LNG supplies from the mature markets of Japan, South Korea and Taiwan and growing competition from new markets for LNG in the USA and most likely also in China.
In 2006, the total global LNG trade was 211 BCM and so we are talking about doubling that by 2020 to satisfy OECD European needs alone. The main sources of new supply will be West Africa (Nigeria), Qatar and Iran. Since Qatar has declared a moratorium on new LNG projects forward to 2011 it is a major challenge for these three countries alone to meet global demand growth.
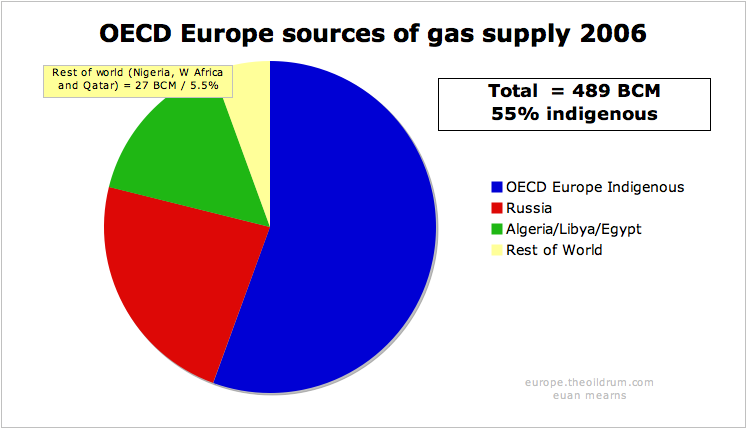
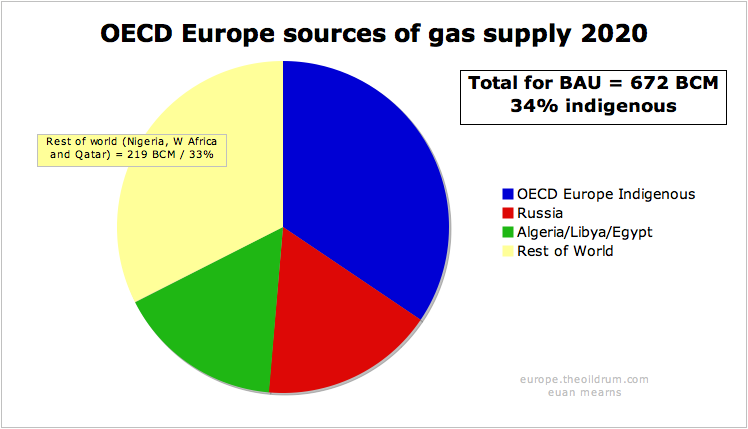
Figures 33 & 34 The changing face of gas security in OECD Europe. With a BAU demand scenario, OECD Europe will face importing ever growing quantities of LNG from remote sources around the globe.
The crux of this whole issue is how growing demand for gas is managed. The UK, and other OECD governments seem intent on allowing market forces to determine the outcome. I would be the first to admit that the dynamics of supply and demand in the European gas trade has so many dimensions that trying to regulate and plan this trade is not simple. But on the other hand, allowing market forces, national economic strength, and price to determine who gets and who doesn't get the available energy may have disasterous and unforeseen outcomes. A scenario where the former Soviet Republics and then the east European states and perhaps Turkey are left in the cold whilst western Europe uses historic strengths to secure itself energy supplies may have unpleasant outcomes flowing from a newly destabilised former Soviet bloc. Energy poverty throughout the poorer parts of Western Europe may also have undesirable consequences for the warm middle and upper classes.
The main message of this post, therefore, is to call upon the politicians of the OECD in Europe to show some rare leadership, and to recognise that massive energy conservation, and expansion of sensible alternative energy schemes, offer a better alternative to the polarisation that is likely to result from allowing market forces to determine the outcome of energy decline.
Acknowledgement I am indebted to Jean Laherrere who upon my request sent his most recent work on gas resources in countries relevant to the European market. Many of the charts come from a paper titled "Etat des reserves de gaz des pays exportateurs vers l’Europe" presented at Club de Nice Energie et geopolitique 29 nov. - 1er dec. 2007.


Euan, this is a very important work that puts Europe's Gas market into a real perspective. I'm grateful for your work, and also to Jean Laherrère that has been working on the subject for at least one year, and whose insight was precious.
To put those 200 BCM into perspective let us make a simple accounting exercise:
A conventional LNG tanker has a capacity of up to 140000 cubic meters, which translate into 3 BCF or 0.085 BCM. To have 200 BCM of Natural reaching Europe by sea we need some 2350 shipments every year, or 6 to 7 shipments per day (2350/a ~ 6.5/d).
The journey from Qatar, say to southern France, is something like 4650 nautical miles through the Suez canal. Given that LNG tankers have cruise speeds of 19 knots, the one way trip takes 10 days. Hence a tanker can perform 18 shipments per year, navigating round the clock with 5 days per year for maintenance or other service that may require the ship to stop operating.
The grand total is 130 LNG tankers shipping Gas to Europe around the clock. In the beginning of 2004 there were more than 150 LNG tankers operating worldwide, a number that has probably climbed up to 190 right now (I couldn't find a reference on this).
Can the Suez canal handle this aditional amount of traffic? Are there enough terminals, both in Europe and the Middle East to handle this amount of Gas? Can the additional required ships be built in time?
To know more:
http://www.eia.doe.gov/oiaf/analysispaper/global/worldlng.html
http://www.worldtraderef.com/WTR_site/cargo_vessels.asp
http://www.mol.co.jp/pr-e/2004/e-pr-2444.html
Luis, one of my contacts at UK BERR (formerly DTI) sent me this link this morning:
http://www.berr.gov.uk/files/file41844.pdf?
Its a pretty long and comprehensive report at 119 pages - enough material for a couple of posts that you may consider having ready for next week:-)
This report and others can be accessed via the BERR web site - so this is public domain:
http://www.berr.gov.uk/energy/energymarketsoutlook/gas/page41850.html
BERR have commissioned many good studies on European gas. However, a common theme seems to be "got pipes, got gas".
This chart from the Global Insight report is a good example:
Jean's chart presents a very different and IMO more realistic looking picture:
Jerome says that Zapolyarnoye has been developed and Yuzhno-Russkoye has also just recently started production. Thus far these fields look as though they are compensating for decline in Yamburg and Urengoy. Its a pretty big and important question to answer - will Russia be able to double exports in the next 20 years as suggested by GI or will exports remain fairly static?
....from the report:
-so Europe requires 130 and there are currently -what 190? and at peak we can make 68 per year (in itself an amazing fact given the size of these things!!)
If we say we need to triple global LNG shipments by 2015 that's a new capacity of (190 x 2) / 7 = ~54 ships/year...
So given shipyard production capacity it can be done.
Nick.
I don't know here did you got those 64 ships per year. There are but a handful of shipyards in the world that build LNG tankers and together they have been managing to build about 20 per year.
Luis,
those figures came from the UK DTI report linked to above. I didn't verify them though.
I seem to recall it mention 12 shipyards capable of making them. I must admit the figure seemed on the high side given the size of these things. In addition vessel capacity is increasing reducing overall required numbers. Build costs have also increased.
Nick.
The DTI report talk of orders, not ships built...
Even with 12 shipyards that would meant more than 5 ships built every year per shipyard. I don't know if this is possible.
Hello Luis,
the challenge is that nat gas consumption is very seasonal, with the highest demand/consumption during the heating season (alternatively huge and expensive storage facilities to keep the LNG at a steady year round flow).
This could suggest even more LNG tankers than your "back of the envelope" estimate.
A factor of 2 perhaps 3?
Alternatively more storage capacity for LNG.
Just my $0,02.
NGM2
Yes, depending on which country we are talking about, but a factor of 3 seems exagerated.
Gas storage has been done on salt caverns, empty aquifers and other natural structures. The problem as usual is the size of the methane molecule.
Luis,
Nat gas storage is now done both in salt caverns and previous nat gas fields (ref. Rough in UK).
You are talking about LNG (Liquified Natural Gas); which is mainly methane (CH4) that is liquefied, i.e. cooled down to approx minus 163 centigrades before shipment. LNG needs regasification plants. It is possible to store LNG, but these facilities (and the regasification facilities) are expensive and subject to a high NIMBY factor. Of course you could ship LNG and store it close to the consumers during the summerseason, reagsify it, compress and store it in salt caverns/previous nat gas fields.
This adds to the cost and complexity of the supply chain, and more importantly reduces the amount of useful energy available as these are also energyconsuming processes, which of course adds to the required import volume of LNG.
Still a factor of close to 3 seems reasonable to apply to your “back of the envelope” estimate above.
Do you have any reference to nat gas storage in “empty aquifers”?
So far the size of the methane (CH4) molecule has not caused serious problems for storage facilities.
Another $0,02 from me, so now I have in total thrown in..... $0,04.
Rgds
NGM2
I was speaking of storing the at surface conditions. Here's a nice article on the subject:
Natural Gas Storage
I mentioned the size of CH4 because there are always risks of leaks from this kind of storage systems.
One of these days you'll get rich commentating at TOD:E ;)
Seasonal fluctuations in gas demand are in fact a massive problem and are quite complex to model / forecast. Not only do we see a large rise in average winter use (jan) but we also have large fluctuations from day to day depending on weather and temperature. So we need capacity to meet these jan spikes.
LNG supplies only a couple of days short range storage. I think LNG trains are pretty much like a pipeline made up of ships. The controlling rate is the liquification process, so having more ships doesn't really help - but I think in summer a lot of LNG capacity and ships will likely sit idle.
Have you seen this site - lets you see the direction and amount of gas flow through the interconnector. Its cold in England today - so they are importing gas.
http://www.interconnector.com/
Firstly Euan, thx for this brilliant nat.gas update, it makes me start shivering
... may I suggest a woollen blanket for january ? ;-)
b'cus that's how the northern Indians survive the cold season … In Delhi the temperature may creep down to just above zero centigrade in dec/jan overnight …
We can (in these times of change) not expect to scale anything to meet any particular peak-time situation IMO.. You know, that I know, that you know this :-) The trouble is those other folks .... who expect a hot indoor january with a cup of freshly made chocolate
Euan,
LNG trains and the carriers are very much to compare with nat gas in pipeline(s).
Actually to serve the huge seasonal demand/consumption with LNG would reqiure that the shipment capacity was approx equal to the liquification capacity.
In other words more LNG trains and ships, of which perhaps 60 - 70 % were idle during the summer season. This is of course costly and energy consuming.
The challenge with LNG is how to design for the huge seasonal swing in consumption.
Present in the UK there is a base load of domestic supplies and nat gas imports, and peak shaving is done with LNG (ref spplies from Grain) and witdrawals from storage (ref Rough)
The below link gives you all flow in the National Grid in real time (i.e. approx 20 mins delayed).
http://www.nationalgrid.com/uk/Gas/Data/EFD/
Rgds
NGM2
Alternatively you can plan to run LNG at baseload (no summer idling) and build enough storage to cater for the summer surplus. This is probably more cost effective than having liquefaction, transportation and regas all lying idle in summer months.
In the UK this would require about 400 BCF of seasonal storage capacity, of which we presently have 120 BCF at Rough, 12 BCF at Hornsea, 10 BCF at Humbly Grove, 4 BCF at Hatfield Moor and 15 BCF coming online at Aldbrough in 2009. This leaves a shortfall of about 240 BCF, which would cost between £1.5 and £3.0 billion, depending on what was built and where. Cheapest is conversion of onshore depleted fields (of which there are plenty), followed by salt cavity, and most expensive is offshore depleted field.
For both types of onshore storage there are huge problems in the UK: NIMBYism, environmental concerns relating to brine disposal for salt cavities, planning red tape and delays, which is why companies are thinking about replicating the offshore Rough facility with other offshore depleted fields.
Luis, ships cannot maintain cruise speed for an entire trip. They have to queue normally to load and unload, they are delayed by the Suez canal, and they lose some gas enroute. The present fleet could deliver an average of 2.3 Bcf/trip, Qatar to Europe. Some bigger ships are in construction, but the fleet average is smaller than your figures. Ten deliveries per ship per yaer is probably a max for the Qatar-Europe trip. The problem is about twice as big as your estimate. Total shipbuilding capacity in 2004 was 20 per year, and with a declining order book, has probably not increased. Murray
Euan,
Thank you for putting this together, a really fantastic resource.
One area of the Russian gas dilemma that you did not touch upon, and is broadly not understood, is domestic Russian demand and the impact that will have upon supplies to Europe.
Firstly, and before Jerome starts jumping up and down, I in no way expect either Russia or Gazprom ("what's good for Gazprom is good for Russia") to voluntarily renege on their export commitments. It's just that in the case of local Russian demand 2+2 is only approximately equal to 4 and therefore the range of outcomes are fairly broad.
Following the unusually cold winter in 2005/76 Russian electricity demand was forecast to grow at 3.5%p.a. to 2015. Given the predominance of gas fired electricity generation, that would be a good proxy for core growth. Except that the economy is strutting along at a healthy ~7%, with a healthy dose of inflation. With the first steps in bringing domestic regulated prices in line with export prices having started at the beginning of 2007, Russian industry has not started out down the energy efficiency route. So in the short-to-medium term industry growth will require a disproportionately large use of energy which is principally produced with.....gas.
To stimulate demand the local regulated gas price will grow ~25%p.a. from here to 2010 and then is supposed to equal netback parity - except that given GAZP's forecasts for next years gas prices in Europe that would mean that prices would jump from $110/mcm to $190/mcm - unlikely given that inflation is not looking good locally. So, Europe can stay warm for a couple more years. But if it really is a wash whether GAZP will keep up exports if there really is a shortage of gas domestically would seem to be a tough call.
On the plus side the government is serious about stopping/reducing the widespread flaring of gas - so you should start to see plenty more associated gas coming in to the system.
And conversely, with the Chinese frantically building a pipeline from Turkmenistan, Russia will no longer be able to rely on cheap Turkmen gas to balance the equation.
Flat exports are a good call, and maybe optimistic until Shtockman comes on line; 2018 anyone?
Regarding Russian demand, I was at a conference last year where one of the speakers (from a western IOC) said that most of Russia’s gas power stations were old, non combined cycle with thermal efficiencies around the 30% figure. He suggested that the most effective thing Europe could do regarding future Russian gas supply would be to finance the construction of state of the art ~60% efficient CCGTs in Russia and in exchange agree a favourable contract for the subsequently “spare” gas.
Does anyone know how much gas Russia burns each year in inefficient gas power stations? What is the value of the “wasted” gas in comparison to the cost of replacing these power stations. The capital costs of CCGT infrastructure are low after all.
The last number i remember is that over 50% of Russian electricity comes from gas-fired powerplants.
Mac, thanks for your comments and insight. When I started to write this post I was trying to get a handle on the likelihood of Russian and Algerian gas ever reaching the UK in significant quantities. And as you have indicated it is a very complex picture to untangle.
This chart from the Global Insight report is fairly typical of many I've seen in reports in recent weeks
http://www.berr.gov.uk/files/file41844.pdf
I agree with the decline in UK indigenous gas that is shown. The Norwegian imports look OK as far as 2020. But then they show us importing gas from Holland and Russia and I'm pretty unsure that either will ever happen. The Dutch are currently consuming and exporting more gas than they produce - as shown in 2005, the UK already imports from Holland - but this is most likely Norwegian gas that is re-exported. If the Russians are able to and have the will to ramp production as shown by GI, then some Russian gas may make it to the UK. But as you point out, domestic Russian demand is a bit of a wild card.
I think the comments made by Chris about the OECD paying to modernise Russian gas fired power plant is the route to our salvation.
I am not seeing all the evidence that the Norwegian output will be as large as projected. The "Other LNG" category is very dubious. Algeria and Qatar cannot prop up world natural gas demand. It looks to me like these figures are forgetting about North and South American and East Asian demand when it comes to LNG. The EU is betting on Nabucco and thereby Turkmenistan and Kazkhstan but this category is completely missing in the above graph.
As for Russia, it is inevitable that their exports by 2020 will decline due to domestic demand increases and field declines, Shtokman notwithstanding.
http://www.oilandgaseurasia.com/news/p/0/news/1452
Concerns Arise Over Bridging Supplies if Sakhalin 2 is Delayed
Wouldn't domestic Russian demand for natural gas increase when oil production starts declining?
http://www.kommersant.com/p834512/r_528/GDP_Economy_2007/
Dec. 10, 2007
Russian GDP on an Unexpected Rise
Jeffery - I agree entirely that economic growth in Russia will result in higher energy consumption and that declining oil production, when that occurs, will also result in higher demand for nat gas. You can see from my Figure 18, demand for nat gas in Russia ticking up briskly, in part due to the very cold winter of 05/06.
Offsetting these positive forces is the fact that Russia is very inefficient in energy use and so modernisation of power generation plant may save much energy. But then again, efficiency gains in the OECD have normally been chewed by greater extravagancies.
Note that EIA data show that Russian crude oil production has basically been flat since October, 2006, within a range from 9.3 mbpd to 9.5 mbpd, through September.
An excerpt from an e-mail from a European corespondent follows:
http://science.reddit.com/info/62plm/comments/
thanks for your support.
The Netherlands also imports gas.
I found this PDF on Dutch Gas & Electricity
http://www.fplaw.nl/public/Bestanden/Home/def_brochure.pdf
But the numbers seem odd(page 7):"The Dutch gas reserve (1,572 billion m3
in 2004) forms approximately 25% of the total
European gas reserve and 1.2% of the total gas
reserve world wide. In 2004 77.5 billion m3 gas
was produced in the Netherlands, of which
almost 35 billion m3 from the biggest Dutch
gas well, the Slochteren field. In 2002 total
Dutch gas import was 1,500 billion m3"
Thank you for this detailed and brillant analysis. The decrease in gas will probably lead to a boom in deep CBM exploration and production efforts, which will slightly offset (for a short time) some of this wedge.
This is a fantastically useful paper.
It's not mine, but if you want I can send you an invoice?
Change in electricity generation is already starting in Russia.
Power generating equipmentNovember 12, 2007, 21:51
World's most modern power plant to be built on the Volga
Russian power monopoly RAO UES has begun building what it claims will be the most modern and efficient power plant in the world.
The gas-powered station is being constructed near the city of Astrakhan on the Volga River.
RAO Chief Anatoly Chubais was in the region to oversee the start of the building, laying the first cement of the plant's foundations.
Chubais told Russia Today he believes Russia’s power sector is now pulling ahead of the rest of Europe.
The plant will churn out 58 units of energy from every 100 units of fuel, that’s double the capacity of the Soviet-era station next door.
The chief executive of the plant's owner, TGK-8, has released figures showing why private investors are prepared to splash out a record $US600 million for the latest Siemens technology.
"The plant will pay for itself within a decade. Our investors have calculated returns of $US450 million per year, that’s an annual net profit of 16%," said CEO Viktor Gvozdev,
Anatoly Chubais claims Europe now lags behind Russia in energy sector reform.
"That’s the liberal logic, which by the way is quite advanced in Great Britain. But we’re far from the European transformation, because they just discuss how they will unbundle generation from the grid. In Russia that's already been done," Cubais said.
The plant’s principal investor is Lukoil. And as Chubais revealed to RT in September, Gazprom will be forced by law to open up its pipeline to third parties. This will allow the likes of Lukoil to control the entire gas supply chain.
Lukoil has bought a controlling stake in TGK-8 from its $US1billion SPO (secondary public offering) in October. In only the second deal of its kind in Russia, the oil giant has guaranteed long-term gas supplies to the plant, crucial in a country suffering permanent shortages from Gazprom’s focus on export.
In return, Lukoil will be hoping to make market-leading windfalls when domestic gas prices are liberalised in 2011.
Marek - welcome to The Oil Drum. It sounds like you have some local knowledge, so I hope you hang around and post some more.
Do you have a source link to the information you posted? All you have to do is copy the URL and paste it in a separate line of text.
Statements like this are quite interesting;
The UK government is very keen on deregulation, whilst others prefer a regulatory framework to aim at certain outcomes.
Do you think any Russian gas will ever make it to the UK?
The report was in Russia Today last November 12th.
There was some initial mention of the plans back in 2004.
That's great. If that kind of efficiency gains can be made, without dramatically increasing local electricity consumption then that represents a significant new source of potentially exportable gas.
Given the extensive networks of district heating in Russian Cities (I assume these are industrial size boilers rather than CHP) is there not allot of scope for the Russians to offset production declines with a move towards high efficency CHP units.
Given the Russians high reliance on gas exports for foreign currency it would make sense to maximise domestic efficiency to take advantage of buoyant export markets.
Hello Euan,
Thank you for an impressive and plenty of data and statistics on OECD Europe nat gas supplies.
The Norwegian energy site recently posted this forecast on Norwegian nat gas supplies towards 2020. Nat gas fields deplete;
”ACTUAL AND FORECAST NORWEGIAN NAT GAS PRODUCTION”
Official data from NPD and MOE suggest Norwegian nat gas exports will rise to 125 – 140 Bcm/a by early next decade. As of now there is serious reason to believe that Norwegian nat gas exports will “peak” by 2010/2012 and then enter into decline. Thus it might look like that some of the UK planners ought to have a second go at their forecasts.
Thus to me it looks like OECD Europe nat gas production “peaked” in 2004, suggesting that your forecast towards 2020 is way on the optimistic end.
------
By the way do you follow the nat gas withdrawals from Rough? It starts to look as this heating season could be subject to some GBA’s. Weather is definitely an important variable, but giving a “normal season” supplies could start to run tight by end of February 2008.
NGM2
Hello NGM2 - your forecast certainly is very different by 2020. You don't show any new fields coming on.
I guess my forecast lies within the Norwegian government forecast range - so it must be wrong:-))
Its difficult to follow the colours on your chart - but are you sure you have enough production coming from gas cap blow down of Statfjord and other fields in the Tampen area? These should be expanding going forward, for a number of years at least.
And I do expect the Norwegian government to come under significant pressure to increase production - from Troll.
Having said that I would not bet against your forecast. So how much does a farm cost in Norway?
Looking forward to the salmon fishing.
Euan
Hello Euan,
The (nat gas) forecast I have presented is based upon all producing and sanctioned fields as of december 2006. The only "major" field which is not sanctioned, yet, is Skarv, and it will not make much of a difference, then there are other discoveries which is challenging to develop, but might add some more nat gas by the middle of next decade.
My forecast(s) includes the blow down of the gas caps on Statfjord and other fields in the Tampen area with the remaining reserves as presented in the latest (i.e. as of 2006) annual NPD resource accounting for NCS.
I have made (oil, condensate, NGL and nat gas) forecasts for NCS for more than 6-7 years based upon historical production and estimated remaining recoverable reserves as estimated by NPD. I also have closely followed the development in resource classifications for NCS as given by NPD estimates/data.
Some years ago my forecasts were deemed to be too pessimistic as they gave lower oil prodction than the forecasts from the oil comapanies and NPD.
It turns out I was NOT pessimistic enough, which has prompted NPD to arrange meetings with the oil companies, trying to improve their accuracies in their forecasts.
.....
I would appreciate it very much if you would bet a Norwegian (big) farm against my nat gas forecast;-)).
Given my forecast for Norwegian nat gas production, and the emerging European nat gas crunch, one does not need to be clairvoyant to expect considerable pressure towards Norway for increasing their nat gas supplies.
You are probably aware that the reason for the recent Troll desicion was due to achieving a high as possible recovery for oil. So if the oil don't get you,.... nat gas will.
I could forward you a better copy of my chart (conversion to JPG tends to degrade the quality) in (secured)pdf.
Best
NGM2
Hello MgN2 - Yes I suspect your forecast is much better than my rather simple 130 BCM capacity statement. I'd assumed that Norway had ample spare productive capacity to fill the pipes. Your forecast makes a huge difference in 2020 - another 50 BCM to find from somewhere.
Please send a better picture. And if you could send me an XL file with the data - then I could adapt my Figure 1 accordingly. I'll send your forecast to BERR.
When you say off-take assumed as 90% of ACQ - what do you mean? And is there historic precedent for this?
Thanks,
Euan
130 BCM from norway may be a bit optimistic, atleast according to norwegian peakists. Scroll down for figures in english as always. (Is Rune Likvern AKA energyman2000)? Field by field bottom up analysis based on data from NPD.
In other news, today the finance minister managed to say that oil may become worthless: she seems to believe it could be abolished because of climate concerns.. Is she totally clueless, or is this just disinformation. I don't know what is worse. I wonder if she knows that the norwegian oilproduction is declining by 10% a year, and that this will be irrelevant to us in a couple of years. If anyone in Norway should know it is her, right after the PM and the minister of oil and energy.
BTW, the russian aircraft carrier General Kutzenov was this close to petroleum installations today, helicopters en route to platforms were ordered back to shore because of the SU-33's flying below them invisible on the radar. I can imagine this was great fun for all involved, especially the russian pilots :)
A picture (of a Russian carrier) says a thousand words:
Your finance minister understands the situation perfectly. By 2100, global oil production will be totally worthless. $10,000,000 / bbl at 10 bpd.
As for 130 BCM being optimistic - I think Norway will come under quite substantial pressure in the years ahead.
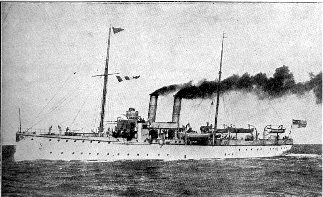
yes, with the Gullfaks platform in the background, lit by the low afternoon sun, it is an amazing picture. Note that apparantly this military excercise was unannounced. Below is a picture and a quote from wikipedia.
So then, when can we expect a visit by the HMS invincible, or the Charles de Gaulle?
Time to read up on Gunboat Diplomacy I suppose, as the russian bear is emerging from dormancy. I wonder if the Nor. coastguard will be chasing any russian or european trawlers around the Barents sea next year, as they have done the last couple of years. Atleast the Swedish minister of defence recently said that Sweden wouldn't remain passive if Norway was attacked. Not that I think it will go that far regarding Russia.
Hi Euan
link to article I posted is below:
http://www.russiatoday.ru/business/news/16850
Thanks for a very fine article! I am glad you are working on the natural gas issue. I am looking forward to your second installment, too.
I would like to see more work done with respect to natural gas. I would like to see others, besides Jean Laherrere, working on making projections of future natural gas supply. I think it gives the area more credibility if we have more than one person working on the issue. Also, it is frightening to think that our only expert in this area could become ill, and, as far as I can see, has no back-up.
Also, I think that in some respects, Leherrere's projections tend to be best-case scenarios - if Russians get all of the necessary infrastructure in place quickly for the new Russian natural gas fields, then natural gas projections will be as he projects. These fields seem to be in difficult locations, so it is not clear that everything will go as planned. I understand Laherrere's forecasts for Qatar and Iran also assume rapid build-up of infrastructure.
For dealing with policymakers, I would prefer having most-likely scenarios, rather than best case scenarios. Otherwise, they will think that there is no problem, when there really is. Laherrere's (ASPO-France's) world projection is used in the National Petroleum Council's Report. From this, they conclude that there is no problem with world natural gas supply. If there really is a problem for places like Europe, we need to get the word out.
Availability of capital to develop 'unconventional' gas in extreme conditions is a big decision. Putin does not want to dilute control of gas = power (double meaning intended).
See this article for less 'rosy' projections of Russian gas production by 2010 -
http://en.rian.ru/analysis/20061117/55747646.html
Lorenzo
Jean Laherrère's forecast peaks exactly by 2030 for a URR of 10 TCF.
We can regard this as optimistic, given that it counts on new discoveries, the South Pars/North Dome field being effectively above 1 TCF and its production coming online unconstrained.
I wish we could do some detective work, in some ways similar to the detective work by Stuart and Euan on Ghawar. The supposed natural gas reserves for Qatar / Iran are amazing. We have had stories such as this one regarding North Field/South Pars.
Is there any inside information we can tap? The lack of development in Qatar gives one clue, and it is not a favorable one.
Gail, that's exactly the post I always have in my mind when I read about the field and NG forecasts in general. This is IMHO some of the best stuff Dave left at TOD.
The only tap I can think of is for the Cockroach Dundee to show up and sheed some light on it if he possibly can.
Euan - this is really outstanding.
Thank you Stuart!
Yowsa! Great work, Euan (and Jean)! You are a master at yelling "Fire!" sotto voce. I look forward to Pt 2.
Re: "It is conceivable that conservation, more efficient energy use and substitution with alternative sources of electricity may fill the gap left by declining gas supplies," I have little doubt that this portends a massive demand for RE. With gas supply shortfalls like this in the offing, and nobody volunteering to do without electricity or heat, an insatiable bull market in solar, wind and marine energy seems guaranteed. Whoo-hoo!
Hi Euan, excellent work. Can I ask what happens if you end up with the following scenario: Intent on maintaining the income stream of European gas sales, Russia agrees to pay Kazakhstan a closer-to-market rate than the current $130 a thousand cubic meters for the enormous gas volumes in the supergiant Karachaganak, Tengiz and Kashagan fields, and to Turkmenistan for its gas. As China has with its announced pipelines to Kazakhstan, it either progresses very slowly or does not proceed at all with the $26 billion natural gas pipeline to Turkmenistan. And the U.S. and the EU do not manage to build Nabucco.
Would this scenario -- which I personally don't think is far-fetched -- leave Russia sufficient natural gas to maintain its current 30% share of Europe's supply? Would it bridge the gap until Shtokman comes on line?
Thanks again for the great report.
Steve LeVine, author
The Oil and the Glory
http://www.oilandglory.com
Steve, you are way ahead of me in your thinking about the bigger picture of unlocking the massive stranded gas reserves of Kazakhstan, Turkmenistan etc.
As a kick off I might mention that ENI recently bought UK listed Burren Energy. I used to own Burren for their oil production in Congo and so followed them for a while. They were frustrated by the fact they were sitting on significant gas reserves in Turkmenistan that they could not produce or sell. So I wonder if the ENI move has to do with securing gas production in that area.
I think a good starting point is to believe that Russia will want to maintain or grow their earnings from gas sales to OECD Europe. While it is difficult to be certain about these things, one possible outcome from the data presented here is that Russia may face declining gas production from 2020 - or even earlier. Combined with growing domestic consumption, this could pose a serious threat to their exports - albeit further in the future than post policy makers like to plan - maybe Putin is different?
And so it may make good business sense for the Russians to buy and sell Kazak and Turkmen gas - to essentially charge a transportation tariff.
Jerome has outlined how difficult it is to raise funding to build pipelines. The trade off is likely to come down to risk - both financial and political / security. Personally I've never felt threatened by the Russians. They are our historic allies. And as Jerome has repeated many times, it is in Russia's best interests to provide Europe with energy. So from a personal perspective, Russia being used as the export conduit for Kazak gas would make sense.
Building a bridge to Shtockman is another matter. From memory it is gas condensate - so two pipelines will be needed - one for liquids and one for gas. It will be a massive engineering exercise - and the fact they look like going ahead with this suggests to me that things could be better in W Siberia.
Good luck with the book,
Euan
PS - the best way forward is for Russia to replace all existing gas fired power plant with CCGT - and that may free up 100 BCM or there abouts.
Steve and Euan,
Central Asian gas is the key to gas balance in Europe, Russia and China - which is what makes Turkmenistan so fascinating right now. Russia's gas supply is pretty much known (the best source is The Future of Russian Gas and Gazprom - Stern), demand is a wild card. Without Central Asian gas the balance of supply and demand in to Europe and the near abroad just does not balance.
This gas is not stranded, its just the wrong side of a lot of capex. All the pipelines needed to pipe the gas N and W are in place, they just have not been upgraded in 2 decades (i.e. a pipes life). The Central Asian Centre Pipeline which runs N from Alexandrovsky Gai (a major Gazprom pump station in Russia , but should probably be in Kazakhstan) is running at less than 60% capacity and has recently been upgraded (I saw it with my own eyes). The Gazprom people running the next pump station up the line (Mokrous) say that the reason is that there is a bottleneck in Kazakhstan.
Russia paying market prices for C. Asian gas (and the $150/mcm for Turkmen gas at Alexandrovsky Gai is not far off the mark)will have two impacts and neither of them will be on Europe. Firstly, it will force Russian domestic prices higher and secondly it will remove trading premiums which people associated with Gazprom are making on selling gas to Ukraine (Turkmen gas at border $150/mcm, Ukraine purchase price $190/mcm, transportation cost (estimate) $7.5/mcm - $32.5/mcm on 10BCM is a lot of bling).
C. Asian gas has already been factored in to the balance. A good overall source is the work done by UBS in late 2006, where they did a detailed European supply / demand analysis. It's principal joy is that the data is consistent i.e. apples and apples are counted.
To comment on some other issues raised in the comments. GAZP would like the power generating units to switch to coal so that they can export gas. Not easily done. The comment as to UES building efficient gas powered stations is correct but at the same time GAZP is buying ownership in some of the key generators (Moscow for expample) and is reviewing the investment plans that call for gas fired power stations. There was also a plan to merge with SUEK, the largest coal producer. These are all in the air at the moment. They reflect the fact that much of GAZP's management is not professional and sees the answers to its difficulties in deals rather than being more efficient.
ChrisN said,
"With gas supply shortfalls like this in the offing, and nobody volunteering to do without electricity or heat, an insatiable bull market in solar, wind and marine energy seems guaranteed. Whoo-hoo!
Yes, but it has to be done on a big scale, done soon, and done in such a way that it builds European bridges in Africa and creates wealth and international opportunity. Sort of like this:
http://www.trecers.net/
Much like intercontinental rail and transoceanic phone service, we are going to have start sometime.
Now is the time.
RC
Roger - trecers is a great concept. We need to wait for Shell, BP and Total to realise what an energy company is and for them to start investing their massive profits in this instead of buying back stock.
Poverty of vision?
Do these projections of European Gas demand include the 20% renewable energy pledges being made around the place?
If the pledges are kept will gas demand rise as predicted?
From what I've seen, yes.
It'll be 20% of a bigger energy pie. If your total energy consumption rises by enough, even though some of it is renewable, your total fossil fuel demand and emissions can still rise.
Basically, the renewable energy in most countries is not being planned to replace current fossil fuel use, but to add to it. So it might go something like this,
2007, 100 energy units used
- 50 from coal
- 20 from natural gas
- 10 from nuclear
- 10 from hydro
- 10 from wind, etc
2008-2029, build 30 wind, etc. Retire 10 coal. Build 10 gas.
2030, 140 energy units used
- 50 from coal
- 30 from natural gas
- 10 from nuclear
- 10 from hydro
- 40 from wind, etc
"Look, we have 36% renewable energy, aren't we great?"
Natural gas produces about 1/3 the emissions of coal for each unit of electricity produced*. So in this scenario greenhouse gas emissions from electricity generation stations (not counting transport of fuel, bulding of stations, mining of fuel, etc) would go from 57 to 60 units. Factor in increased population over the 23 years and they can honestly say per person emissions are down, even though total emissions and energy use are up.
* This is why many countries are trying to go from coal to natural gas. It lets them stick to the old way of burning stuff for electricity, while putting out less emissions. Of course, if everyone does that, then as this article says, where will the gas come from? So then they'll go back to coal.
It's like diners at a buffet. The prawns run out so they rush over to the roast meat area, that gets crowded so they rush to the desserts, that gets crowded so they start fighting. It doesn't occur to anyone to share and be patient, and no-one wants to go to the salad bar.
Your allusion is not quite right. The prawns (coal) did not get crowded, it's just the diners decided they don't want them (because they're bad for health). There are still plenty of prawns out there, after all carbon started to be sequestered in coal when CO2 concentrations were 20 times current ones - and all of this atmospheric carbon gradually turned into various FFs, but mostly coal.
In the end of the day diners will return to prawns as simply there won't be any other choice.
Germany, Denmark and Spain already have significant wind capacity and Norway, Sweden, France, Swizterland and Scotland already have significant hydro capacity. So the progressive expansion of renewables is already embedded in the historic FF data. If the rate of expansion of renewables increases over the historic trend then this will reduce the growth rate of FF consumption - and that is the target outcome for both climate and energy security objectives.
It is the major acceleration in renewables development that is required.
Re Fossil energy mix for Russian power plants:
There seems to be a switch towards increase of coal use in electricity and district heat in Russia. This will be a key to liberate natural gas for export to much better prices than domestic.
We have also seen that Gazprom invests in the coal and electricity industry.
http://www.bbj.hu/main/news_22438_gazprom+forms+power+firm+with+russian+...
and
http://www.sptimesrussia.com/index.php?action_id=2&story_id=20354
and http://pepei.pennnet.com/display_article/293747/17/ARTCL/none/none/1/Pow...
Citation: “Currently, coal makes up 15 per cent of the fuel used in Russia’s power stations, but President Putin has said that this figure needs to rise to 35 per cent by 2015. Natural gas accounts for between 60-75 per cent of the country’s fuel balance, but a shift towards coal would free up gas for export, which Gazprom could sell for four or five times the domestic price.
At the end of last year Gazprom signed a deal with Russian oil company Rosneft in which both companies agreed to “join forces in the generation and sale of electricity and thermal energy”. According to Andrei Gromadin, oil and gas analyst at MDM Bank, even without Rosneft, Gazprom would have sufficient money for future investments. As gas and electricity tariffs are gradually freed up over the next five years, the prices of both will rise exponentially, as will Gazprom’s profits, Gromadin said. “
Kind regards/And1
Jeez, this is shaping up to be a disaster in the making for sure.
By 2015 we have Chindia installing the same amount of Electrical Generating capacity as the whole of Europe since 1945 -90% of which will be coal powered (and Chinese coal is very very dirty/high sulphur). Now Putin wants a 35% mix by 2015...
It's the Penguins I feel sorry for...
Nick.
Good work Euan. How about the Russian above ground factors?
My own quick, thrown together hack-assessment goes something like this:
History & Estimate of Russian gas production from mature fields (IEP,2005)

So, production from mature fields is going down.
No problem, just find more:
Oops, potential can barely match the decline.
Well, maybe the demand is going down? Let's see:
EIA forecast of EC-25 gas demand forecast to 2030

Ok, so that's EIA, they've been systemically wrong before. What about IEA?
Euro-OECD gas demand projection to 2030 (IEA,2007)

Well, a minor relief there as earlier estimates have been overestimated. Still, demand has gone up and continues to do so. Brattle considers there's a potential 10 bcmpa overestimation error for the EU-27 gas demand in 2015. That's not much. Does not change the big picture.
How about domestic demand? Maybe it's going down and there's more gas to export to Europe?
Russian gas supply & domestic demand projection (IEA, 2007

Ooops again. Domestic demand is set to cross paths with declining production between 2017-2022, unless there's plenty of new fields.
So, maybe Gazprom just invests more in upstream efforts to produce that gas. After all, there's demand, right?
Gazprom investment program (IEP, 2007, but other previous years look similar,)

Oh, that small upstream investments?
So, they are acquiring. At least that's good.
Well, let's see what happens to production once it is owned by Gazprom (and not independents):
Gas production growth rates: indies vs Gazprom (IEP, 2007)

Hmmm.. doesn't look very promising.
Well, surely Gazprom can invest more?
Debt to revenue ratio of major oil & gas companies (IEP, 2006)

Oh, does that mean Gazprom has no money to invest? How is that possible? Government taxing heavily/progressively and guiding it to acquire, not to invest? Hmm... interesting policy.
Well, surely EU can import from Central Asia (Nabucco, if it ever gets built)?
Russian Likely Gas Balance (EIP, 2007)

Well, well. Looks like Europe has to fight over for that gas too. We can build pipelines to Caspian, but where's the gas to fill the pipes, esp. if Russians succeed to make the deals there (or Americans, or Chinese...)
Surely we can get gas to Europe from somewhere else. Let's look at the whole supply/demand picture.
European Natural gas supply vs demand projection (Brattle Group, 2007)

Ahh... how about LNG?
Worldwide LNG balance (Brattle Group, 2007)

Hmm... so Europeans will have to compete on the LNG market with India, Japan and China too? Doesn't look too promising.
Are there any other downsides one should be aware of?
Pipeline age of Gazprom (IEP, 2006)

That's not totally bad, but considering more gas will be piped through the same pipes, downstream investments are quite marginal and there has already been major pipeline incidents, then at least that is an issue to consider when thinking about short term delivery disruptions.
And oh yes, there's the Ukrainian incident also.
Gas is passing countries (to Central Europe) is still 1/3 the price of what EU clients pay. A heavy winter and we might get a replay.
---
Of course the whole situation is far more complex than above, which is just a really quick-hack thrown together.
Nevertheless, personally I think there are some sizable and important challenges looming on the horizon, just as you point out.
However, Gazprom head of exports just smiled coyly when he was last quizzed on his company's export capacity, and answered:
"Russia can honor it's contractual gas obligations for the next 20 years at least."
Oddly enough, nice words do not keep me warm at night. Gazprom has been very reliable so far as a supplier. Let's hope issues beyond their control doesn't change that.
SamuM - where did the great Russian supply/demand graph come from? I have been trying to build/find one like that for a while.
Our (Khebab/Brown) middle case shows Russia approaching zero net oil exports in 2024, within a range from 2018 to 2029.
SamuM - great post. I think it pretty much says the same as my spiel on Russia. I may lift this as a guest post - if that's OK with you. It won't get read by to many folks tucked away down here.
I've been digging out some interesting stuff on LNG - the world is building regass capacity at twice the rate of liquefaction capacity - not good.
Thanks. It's ok to make it as guest post. I think I could tidy it up a bit first though.
I can also dig up the links to the presentations / papers, so people can look through them at leisure.
Tell me in which form you want the material and I can send it.
It would be great if you could tidy it up a bit - but I would stick with the simple rolling narrative.
Stick it in a word file and email it to me - I'll do the html coding. If you just paste the links in the right place. I can probably just grab the figures (or their URL) from the existing post.
You'll get my email in my details.
Euan
If you guys are so inclined, you could work with Khebab and turn it into a look at both oil and gas production and exports: "Projected Russian OIl and Gas Net Exports"
Khebab has done the Russian oil work:
http://www.aspousa.org/proceedings/houston/presentations/Jeffrey_Brown_N...
As noted above, Russian oil production has basically been flat since October, 2006, within a range of 9.3 to 9.5 mbpd (EIA, C+C).
Thanks Jeff,
I've looked at that and it is indeed interesting.
The Russian sources I've read claim it (oil) is due to above ground factors and try to make it quite clear that it is not a plateau of geological variety. At least not yet.
Of course, time will tell, but I view the situation undecided as of yet. Of course, I haven't dug into it as deeply as you have.
Also, I think the situation might be the same for gas, but it doesn't really matter if the above ground issues are already challenging enough on their own.
SamuM - if you could send me an email some time so that we at least establish contact.
Euan