The Status of North Ghawar
Posted by Stuart Staniford on April 7, 2007 - 10:49am

- Saudi Arabian Oil Declines 8% in 2006
- Saudi Arabia and that $1000 Bet
- A Nosedive Toward the Desert
- Saudi Production Laid Bare
- Of Oil Supply trains and a thought on Ain Dar
- Further Saudi Arabia Discussions
In what follows, I'm deeply indebted to Fractional_Flow, Euan Mearns, Bob Shaw, GaryP, and others, for insights and references. However, the synthesis here is mine, and they might well disagree with it to varying degrees.
Ok, let's start in the middle with Uthmaniyah. Here's a blow-up of the Ghawar oil saturation plot. My interpretation of this plot is it represents the oil saturation at the surface of the reservoir. So it doesn't, by itself, tell us anything about the thickness of the oil layer, just that there is (or isn't) an oil layer at the surface of the reservoir. Ok, so here's Uthmaniyah:
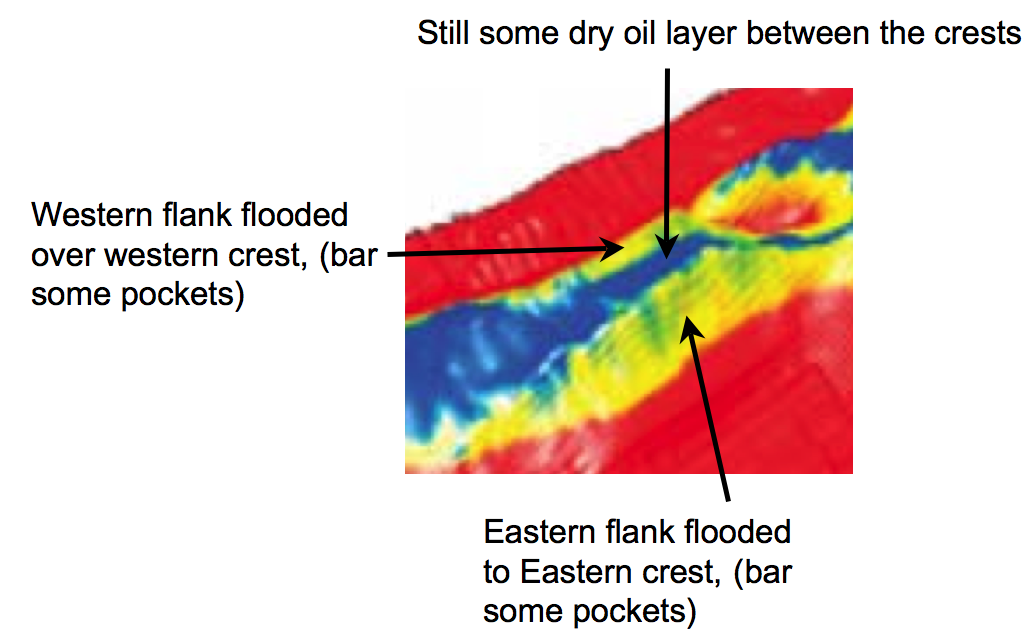
Before we go on, I'd like to stress, especially for Euan's benefit, that with all these visualizations: they have been scaled to fit on your computer screen. Ghawar is really much bigger than your computer screen. And in particular, the scaling in the horizontal direction is much more pronounced than the scaling in the vertical direction. That "cliff" on the eastern flank is really a slow rise that goes on for several miles at only a few degrees angle. However, it's very likely that even though the scales are adjusted, the shape is accurate, since it can be determined with great precision by seismic surveys.
Let's get a better sense of the shape of Uthmaniyah, running East-West. We can look at this other visualization:
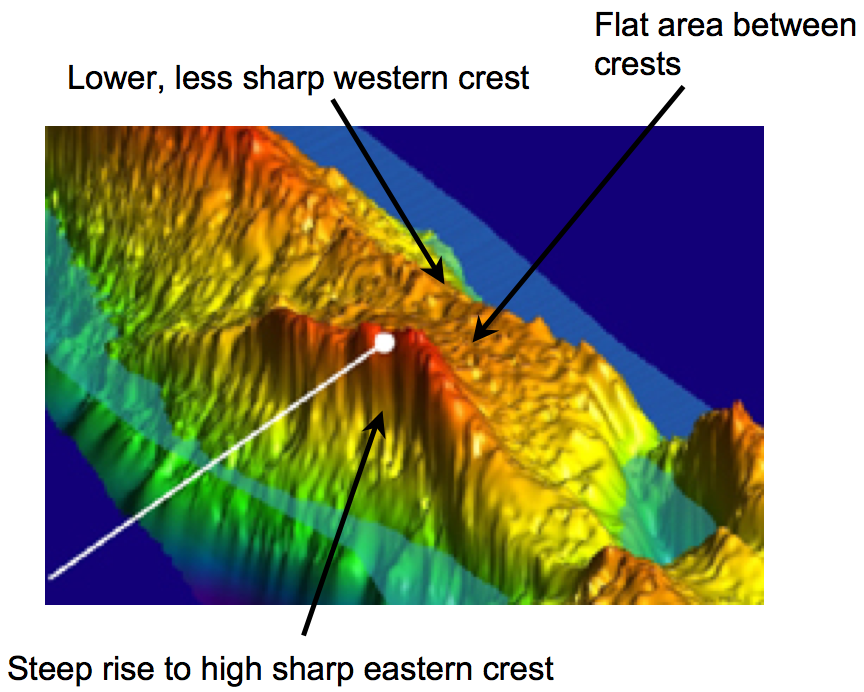
So if you stare at the shape of that field going from East to West, then I hope you'd agree with me that this next simulation profile of Uthmaniyah must be an East West cross section of the entire field:
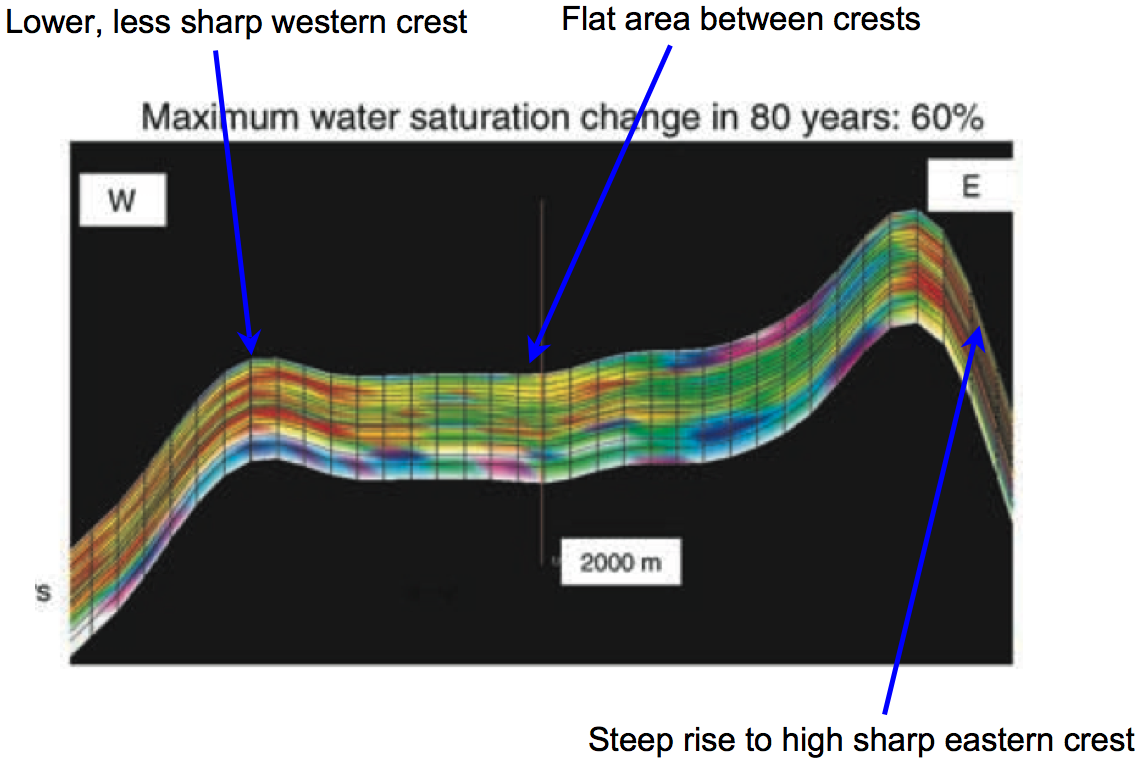
And if you agree with that, then I think you'd have to also agree that the profiles below are of the western and eastern flank and crest respectively, with each continuing to about the middle of the flat area between the dual crests:

(NB: I'm not claiming the cross sections at bottom are in the exact same north-south position as the one at the top - clearly they aren't, nor do they have the same scalings. But I do claim that the bottom cross sections must be east-west cross sections that each include about half the structure (the west half and the east half respectively).)
And if you agreed to that, then it seems that the SPE 98847 cross sections from 2004 are telling a fairly similar story to the oil saturation picture from the Linux cluster paper:
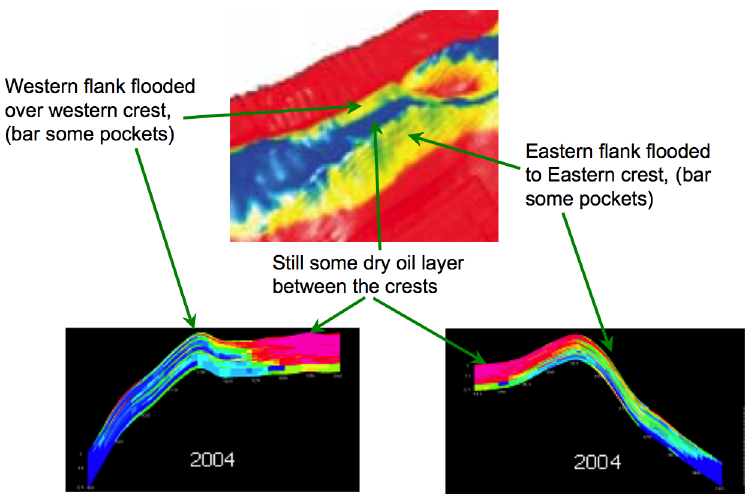
Given the general agreement, I think it is probable that the top picture is of the simulated reservoir as of 2004 (the source paper gives it as an example of the output of a super-computing cluster described as of 2004 - in principle it could have been of a year earlier than the end of the run, but that now seems unlikely).
So these sources are tolerably consistent, and what they say is that there is oil between the crests in Uthmaniyah still, but much less than there used to be. In these particular cross sections something like 1/4 of the original dry oil is left. Looking at the 3d visualization, we can see that the situation gets better to the south, and worse to the north, but overall it seems that Uthmaniyah will produce dry oil from horizontal wells for a few more years (even allowing for the three years that have passed since the time of these pictures).
I should note in passing that Fractional_Flow has a lot of issues with the left profile, in particular the extraordinarily low oil saturation left in some strata (less than 10% - much lower than 'Ain Dar). He also doesn't like the angle of the oil water contact - but a couple of hundred feet of rise in the OWC over several miles doesn't seem much worse than what we see in lots of these simulation pictures.
Ok. Let's now turn back to North 'Ain Dar. Here's the equivalent picture to the one we just looked at.
(And for those of you following the debate very closely - yes, I have become persuaded of GaryP's placement of the cross-section a few miles north of where I had it before, for reasons that will become clear).
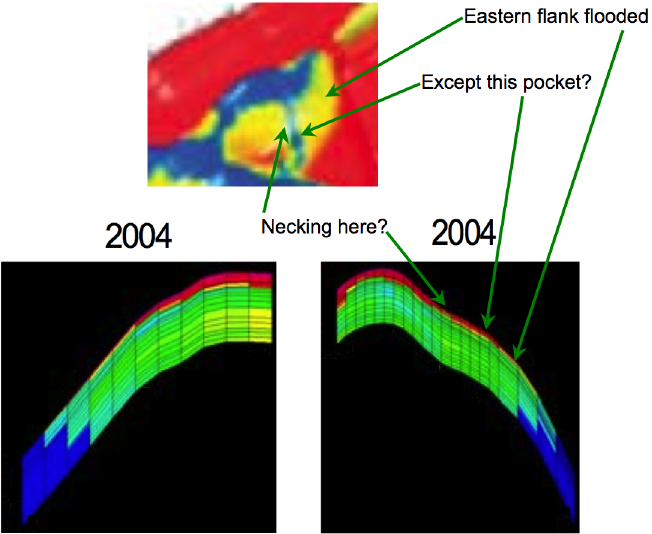
Now, if you were a reasonable person, you might be inclined to accept that since Saudi Aramco in their paper on managing water in Uthmaniyah gave us a couple of cross sections that included each flank and the ridge, they likely are following the same practice in the North 'Ain Dar paper. And given that there is only one significant pocket of unswept oil in the 3D oil saturation visualization that comes more than a third of the way down from the ridge, you might be inclined to accept that the 9b) eastern cross section must be going through that pocket. If it was anywhere else, there could be no oil layer on the surface that far down the cross section. It's particularly striking that the oil layer in the cross-section weakens about 3/5 of the way up from the OOWC to the crest, just where the little unswept patch narrows on the 3d visualization.
But we have some folks who are still going to be claiming that Ghawar is fine as their rusty V8 engine blocks thump loudly to the floor, corroded from their vehicles by excessive attempts to drive with left-over injected sea water for fuel. So let me now proceed to beat this point into the ground with a 50lb mallet, and then pound it down some more with a 2 ton pile driver (solar powered, of course).
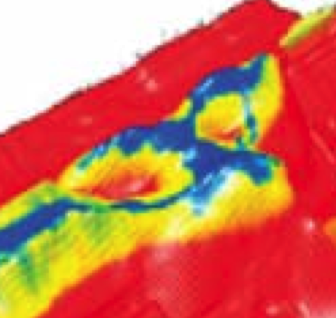
Let's investigate that little patch of unswept oil on the eastern flank for a minute. In particular, I'm going to look at it on the permeability visualization:
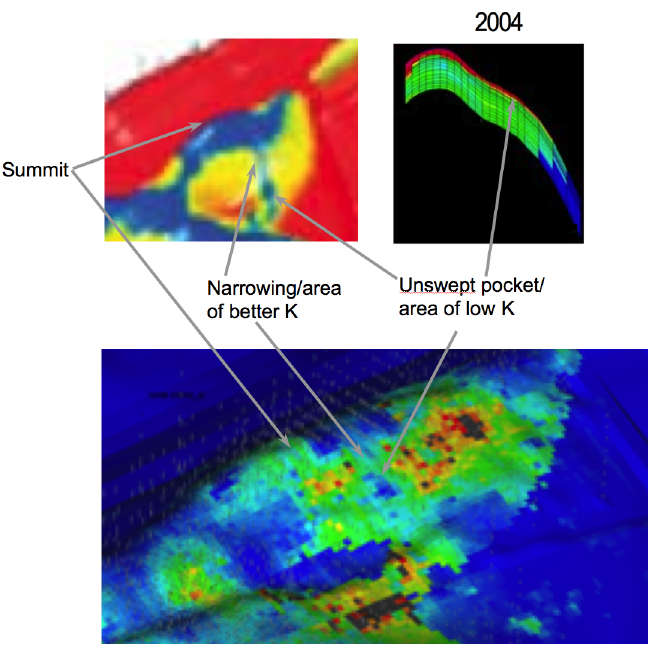
Nice, huh? It's pretty clear why that patch of unswept oil is there. And that helps us to locate on a slightly less blurry picture where we need the 9b) eastern cross section to go. In a few minutes we'll take this to our best topographical visualization. But first we need to talk about the thickness of the Arab-D reservoir in North 'Ain Dar so we can do the best possible job of establishing the vertical scale here. We know the average thickness of the oil layer from Greg Croft (204'), but it's not quite clear where in the simulation picture we should consider the bottom of the oil layer to be. There are also questions about whether the reservoir (and the layer) are reasonably uniform or not.
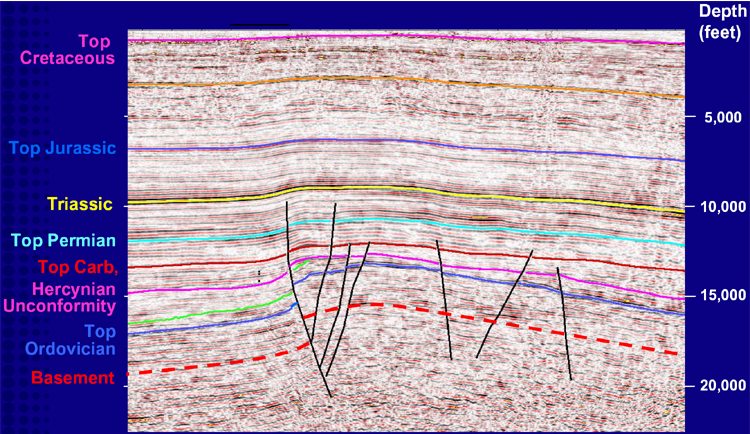
Overall we don't expect radical changes change in the strata thickness. From this extensive survey of Middle East geology, we learn:
South of the ‘Gotnia Rim’, four shoaling cycles of interbedded calcarenite and anhydrite units developed. They are the A to D Members of the Arab Formation. Throughout the 250-km-wide Arabian Basin, they show a remarkably uniform development in fabric and thickness.You get the idea from this east-west cross section of a seismic picture of the strata in the area:
However, I have come to the view that there is likely some North-South variation of the reservoir thickness through the length of Ghawar. The best map I've been able to find doesn't nail it, but hints at what to think:

Now, I think the isopachs on the map (in feet with fifty foot contour interval) must be for the full Arab A-D sequence, whereas the actual reservoir only consists of Arab D. And the contours don't go as far as Ghawar. But the picture does suggest that we might expect the rock to get thicker as we go south, and that it probably doesn't vary rapidly in the region of the North end of Ghawar.
To get any further with this, we have to resort to point observations. A very extensive USGS survey of the area's petroleum geology tells us that
For example, the Arab D reservoir at the ‘Uthmaniyah substructure (fig. 10) field of Ghawar is a 91-m thick carbonate rock sequence consisting of various carbon- ate rock types that exhibit an overall stratigraphic downward decrease in porosity with a corresponding increase in dolomite content.91m is 300 feet. Then, this paper reports that the original Dammam-7 well (which is the tip of the other blue arrow above) found 58.5m (or 195') of Arab D reservoir.
So looking at the map overall, one would assume that 'Ain Dar has something like 250' of reservoir (with a possible error of a few tens of feet either way). Furthermore, it's not very plausible that there's radical variations in reservoir thickness within 'Ain Dar.
The reason this is important is it allows us to construct a reasonably reliable vertical scale for the 9b) eastern cross section. Under the assumption that there's 200' of pay in 250' of reservoir, the picture has to look fairly close to this:
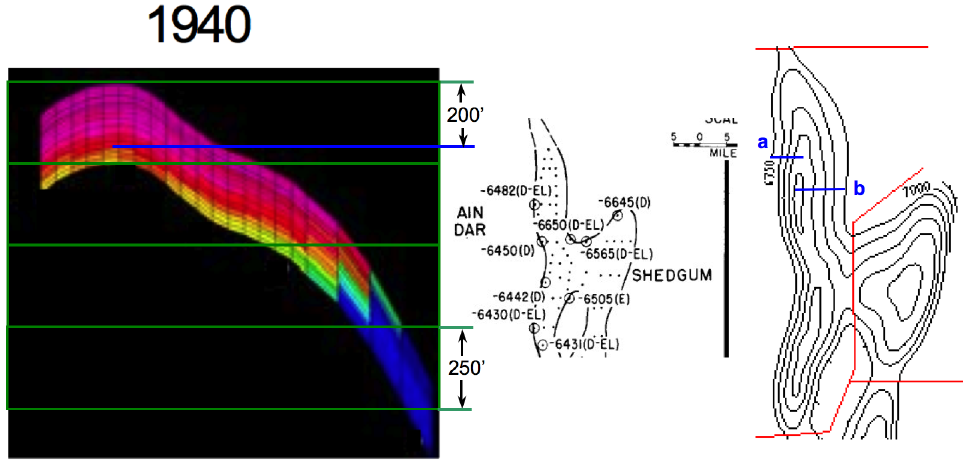
The point here is that 9b) cross section is 900' tall (measured at the top of the Arab-D) and still descending. Thus, to fit on the Greg Croft map, which has about 1000' of spacing shown, it has to be not too far from the crest, and it has wrap over the main ridge. If it was going over some subridge on the side of the eastern flank, but not going over the main ridge, it's very difficult to make the height work.
To attack the same issue from a fourth (and final, I promise) angle, we can look at the topographic visualization. After reflection, I decided I could live with GaryP's solution, and I liked it because of the match up with the visible unswept oil on the oil saturation visualization. I've marked off how I think the heights work.
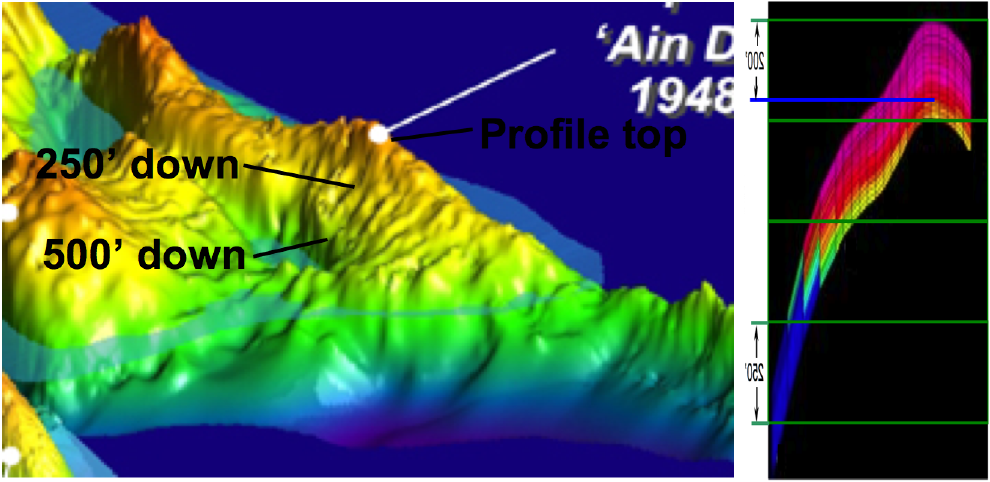
To me, this meets all the requirements in a way that only a handful of spots (all close together) do:
- A visible shoulder in the profile at the right height.
- Around 600' from the ridge top to the OOWC
- Steepening into the water.
- Room to continue for a few hundred feet down under the water.
So given all that, the implications for North 'Ain Dar are pretty clear:

Layer counting here says that 6-9 layers of red/pink have been reduced to 1 layer over the same 14 years, suggesting a similar pace. So, overall, we lose a layer about every 21 months, and there were 1-2 layers left at the time of the 2004 simulation. Now, we do not know for sure whether this simulation means by "2004", "2004.0" -- the beginning of the year, or the end of the year. However, labels on simulation visualizations in other papers shows annual data with a ".0", suggesting that is the convention. If so, then we would expect the green area to reach the top of the reservoir in some places in North 'Ain Dar in mid-late 2005, and in most places there by the middle of 2007. Thus in timing, this phenomenon would be consistent with the decline in output across production zones E-I (mid 2005 through the present).But what we now have is a much stronger argument for extrapolating this conclusion to south 'Ain Dar and Shedgum:
Eyeballing the picture, they are at about the same stage of depletion as North 'Ain Dar, or maybe a fraction behind. Assuming the flood has been done in a similar manner, there will have been a similar thinning out of the oil layer, with perhaps only the saddle between 'Ain Dar and Shedgum being left with a thicker oil layer.
Finally, I have come around to Fractional_Flow's position that the wet area production in Figure 10 of SPE 93439 is that it is coming from wells with both oil and water coming in different zones, but that in any given zone, pretty much either water or oil flows - breakthrough is close to a binary affair. Two lines of argument support this (in addition to FF's reasoning). One is the well profile data that Euan highlighted the other day:
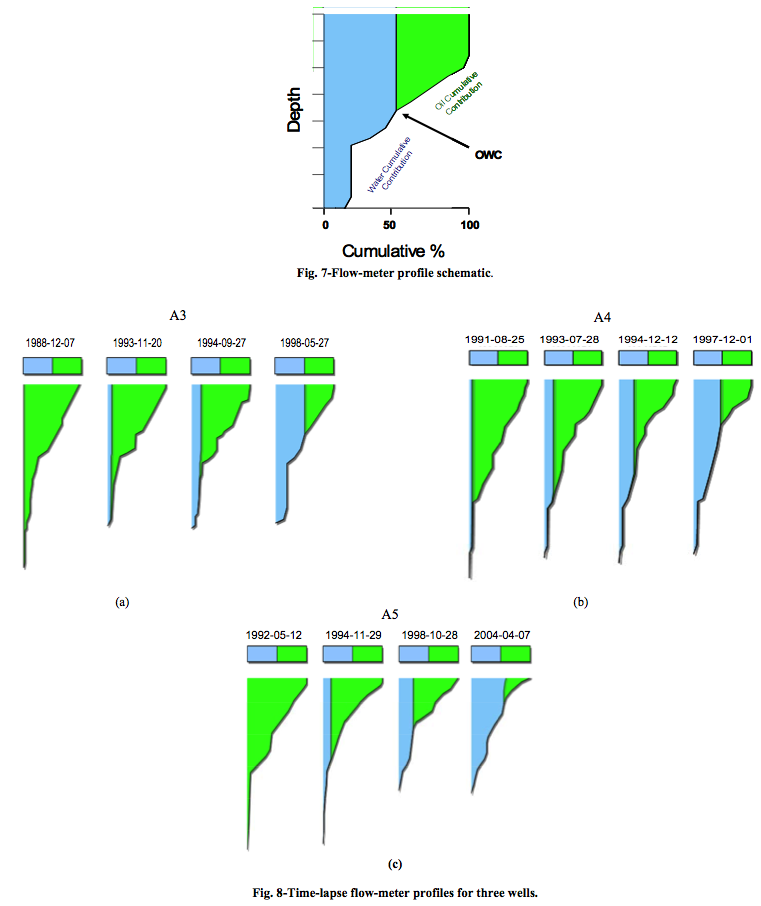
The line between the blue and the green zone in each case is very close to vertical all the way up the join between the two colored regions. That means hardly any water came out where oil was coming out, and hardly any oil came out where water was coming out.
Additionally, we can see in these pictures:

Once a given cell turns green or pale blue early on, it never changes again. Clearly no meaningful amount of oil is coming out of there.
This, finally, implies that I'm now willing to accept Fractional_Flow's idea that:
Contact
- Content: editors at theoildrum dot com
- Tech support: support at theoildrum dot com
License

This work is licensed under a Creative Commons Attribution-Share Alike 3.0 United States License.
Stuart, guess what I've been doing in response to a question from Bob....
Here's the copy across from the previous discussion that I just posted there.
-----
OK Bob, doing the same as yesterday (and wasting even more time).
First off the modeling grid from the "When 4D seismic is not available: Alternative Monitoring Scenarios..." and "Reservoir Monitoring with Permanent Bore Hole sensors", both by Shiv Dasgupta are the same. You can have great fun lining the things up and finding that there are more bore holes on one than there are on the other. That means we have the top down data from one and the cross section data from the other to compare.
Doing the now normal and arranging each on top of the 3D view leads to the two resultant image below. Its harder to decide exactly where these lie this time, but I think this is about right. I've highlighted the area I think is oil from the cross section in the overlay.
Thus in 2004 there was a good 120feet of oil across a reasonable area of Uthmaniyah.
Everyone can now commence saying I've got it all wrong !
GaryP - thanks for this amazing work.
I was wondering if you would care to comment on what exactly the "saturation profile" is showing. Based on 4D seismic, it seems that the authors are saying that the Arab D is being depleted so slowly that differences in impedence are not detectable from one year to the next.
(Note that Gullfaks is a giant oilfield Norwegian N Sea and that the Tarbert is the uppermost sandstone reservoir of the Brent Group)
You indicate that the dry oil column in Uthmaniyah is around 120 ft thick - and accepting that as valid would point to the summary saturation model posted by Bob yesterday (and reposted by Stuart here) is showing dry oil at top reservoir and not necessarily a full dry oil column.
Notwithstanding that, the layer of oil shown in your profile seems to tie in with the big tongue of oil on the saturation model..
Different folks tend to look at this in different ways. Some think "My God" Ghawr is dying - which is of course true. Others, like me tend to think - thank God look at all that oil that is left after 50 years of production.
It seems to me that by replacing vertical wells with horizontals (to limit water production) that Aramco will be able to maintain oil production here for a number of years yet.
Taking the Uthmaniyah tongue as 20 miles long, 5 miles wide, and 100 ft thick I get 279 billion cubic ft of rock. At 5.6 ft3 per bbl I get 50 billion bbls of rock, at 18% porosity and 89% water saturation I get 8 billion barrels in place or around 4 billion recoverable.
At 1 million bbls per day, this will be gone in 11 years (very roughly).
It doesn't seem very much to me - I've been generous with length and breadth, probably conservative with depth. If anyone would care to check the sums...
Euan,
Personally I skipped over the discussion of acoustic velocities etc. Something for those with more knowledge than I. I focused on the 2004 simulation run with a big area of zero change in water %age. I contend that this is the dry oil area, a reasonable assumption I think. Cross section and area plot seem to tie up in the plots above.
With regard Uthamniyah and horizontal drilling, see the posting I just made below on what a patent app has to say about Uthamniyah faults. This might shed some light on why the oil has a high water cut at the peak, but not downslope.
Next stop Uthmaniyah.
Euan...
As you know Saleri says Ghawar was 48% depleted at 55 billion. That leaves 60 billion barrels of field reserves.
He gives an aggressive 13.9 billion for AD/s, and the Haradh at 900kBOPD is 10 billion over 30 years. That's 24 billion at 1/1/04......
Houston we have a major problem with Uthmaniyah and your numbers (mine are similar- maybe wrong as well).... especially at a billion barrels per year. 2 MMBOPD AD/s, .9 Haradh, 2.7 Uthmaniyah.
Thanks for your contributions here.
FF
Hello TODers,
Great work by all!
I refer everyone to Garyp's great find:
http://www.blackwell-synergy.com/doi/pdf/10.1111/j.1365-2478.2004.00473.x
"Houston we have a major problem with Uthmaniyah"
I think we need more information on the moving mud wave in the pressurized waterfront [in all areas of Ghawar] as it pertains to horizontal/vertical permeability/porosity ratios--could the mud wave be making the waterfront behave more like a breaking wave than a rising tide through the payzones?
General carbonate reservoirs have greater permeability and porosity as you go from payzone bottom to top. The mudwave is clogging the bottom making it easier for ever increased waterfront vertical permeability through ever more porous payzone toprock. Increased injection pressure maybe making it very hard to keep the mud moving causing a waterfront 'breaking wave action in the reservoir sweep.
Sorry, wish I had more time, but busy today. Please flog this mud wave implication as best as you can--Good luck!
Bob Shaw in Phx,Az Are Humans Smarter than Yeast?
Bob - I've not forgotten about your question on a tilted contact - but it is a complicated question to answer - which evidently has been discussed by the SPE for 30 odd years - so I'm not sure that I can contribute a huge amount in a short post.
Suffice to say this:
1. Any aquifer (water) pressure gradient across the field related to a tilted contact is unlikely to be significant to the present debate on reservoir depletion. Variations in pressure caused by production and injected water are likely to be over riding.
2. The geological processes responsible for the tilted contact will be very important in understanding the "hydrodynamics of the reservoir" and how it responds to production.
I know this won't help much but the key issues right now are the size of undrained reserves in good quality reservoir in Northern Ghawar.
Hello TODers,
http://www.spe.org/elibinfo/eLibrary_Papers/spe/2006/06EURO/SPE-98847-MS...
-------------------------------
ABSTRACT/details behind paywall =(
Water Production Management Strategy in North Uthmaniyah Area, Saudi Arabia
A water management strategy was initiated in the North Uthmaniyah area of Ghawar field in late 1999. The strategy main objectives are to reduce operating expenses associated with water handling and avoid capital investment required for the expansion of water handling facilities while engendering a more efficient recovery process. The strategy was implemented through four initiatives: operating of high water cut wells on a cyclic basis, conducting rigless water shut-off jobs, drilling horizontal sidetracks of existing vertical completions and drilling wells with partial penetration completions. [There is much more detail in the abstract, please read]
-------------------------------
http://home.entouch.net/dmd/ghawar.htm
Specifically, I refer you to the second graphic of Alexander: http://home.entouch.net/dmd/ghawarwaterfront.JPG
Does the oilwell placement make sense? I expected a more even spacing, or else well concentration along the top of the incline [the eastside injection well pattern just above the bottom tarmat makes sense]. Also, can someone access the graphics and charts in this article [I can't]:
http://www.oilandgasnewsworldwide.com/bkArticlesF.asp?IssueID=115&Sectio...
---------------------------------------------
[Selected excerpts]
Robert Phelps, Richard Black, Harold Triebwasser, Ali Al Shahri and Fahad Al Ajmi of Saudi Aramco discuss ways to integrate data to identify high-stratiform permeability regions in the 'Uthmaniyah area of Saudi Arabia.
A PROJECT was undertaken at Saudi Aramco to develop a quantitative definition of super-K; map this quantitative definition of super-K and compare to other geological and reservoir properties; determine a possible correlation between the data in order to determine what parameters may be influencing super-K events; and use 3D visualisation to review the data to determine if there are trends or similarities in the data.
Using all open-hole flowmeters in the 'Uthmaniyah area, a Fluid Flow Index (FFI) was calculated.
To better understand the quantity of data used in this study it is important to note that there were 1,366 'Uthmaniyah wells analysed.
This represents about $82 million-worth of open-hole logging cost. A total of 799 wells had flowmeters run at a total cost of $16 million, of which 462 wells were open-hole flowmeters.
The majority of these wells had several and some as many as 16 open-hole flowmeters. Since a data point is taken at every 0.3 m interval, measuring both water and oil, this translates into approximately 2.5 million data points that were used in this study.
-----------------------------
But, I want F-F,SS, and Euan, plus interested others to see this MOTHERLODE OF GHAWAR INFO [WARNING 540 page PDF]:
http://pangea.stanford.edu/~jcaers/theses/thesisJoeVoelker.pdf
----------------------------------------------
page 54 -- placement of all wells in Ghawar
page 106-120 --UTHM waterflood detail and super k
The rest of the PDF is extreme detail that I haven't had time to study.
Other links here:
http://pangea.stanford.edu/~jcaers/publications.html
Bob Shaw in Phx,Az Are Humans Smarter than Yeast?
Well that puts paid to me doing any real work tomorrow.
Can I point to two papers that result from the trawl to find the original paper for the oil and gas ref.
Integration of Data to Identify High-Stratiform Permeability Regions is the original paper, complete with pretty pics.
&
Simulation of Super-k Behavior in Ghawar by a Multi-Million-Cell Parallel Simulator
There are many more illuminating papers via here. These are Aramco's own papers and there are lots of bits of data to ingest.
-----
Edit: And Fractional Flow REALLY needs to comment on this paper:
Equations for Water/Oil Relative Permeability in Saudi Arabian Sandstone Reservoirs
Hello TODers,
When you use the PDF magnifying tool to zoom in on the oil wells on page 54 of the Motherlode link--alot more detail becomes visible.
Does it show OWC at the various stratigraphic levels inside the well, gas condensate output for some, Horizontals & MRC?
What details do the shapes, and colors mean for each extraction well? for each injection well? Is there any way to figure this out?
Bob Shaw in Phx,Az Are Humans Smarter than Yeast?
Bob, and anyone else looking at the data, I heartly suggest going through the Aramco Journal of Technology. There is much there that informs and provides evidence that can be pieced together.
The page 54 oil well pic doesn't tell me much, the resolution is too low. However there is enough in the JoT articles to give a fairly complete picture I think.
As an example Simulation of Vertical Fractures and Stratiform Permeability of the Ghawar Field provides a figure that answers precisely the question of where the Uthmaniyah map and cross section output we have goes.
Hello Garyp,
Great Job! This area is/has been studied extensively by Aramco because:
From the Motherlode link:
---------------------------------
Moore[55] reported superficial flood front velocities
v = 15 ft=day over an 8 km span
on the Uthmaniyah flood front.
Saudi Aramco (SA), is attempting to resolve observed, massive, unmitigated hydraulic conductivity between injection and production wells separated often by more than 1 km.
The first fundamental fnding: the predominate, repeated waterflood pattern is that of line drive, specifcally under long and thin, rectangular pattern boundaries. Second: Ghawar water injection wells are often inadvertently hydraulically fractured with unpropped fractures [basically, shooting themselves in their own feet!].
We conclude that these conditions exacerbate the problematic super-k condition, that of early water breakthrough. Our hypothesis for the structure of super-k, containing essential discrete fracture network components, naturally leads to a supposition that the two conditions stated above, are conducive to the formation of highly
conductive pathways, consisting of hydraulic fractures at injection wells, connecting to natural discrete fracture systems, culminating in a network that may significantly
affect production well performance, because it resides in a long, thin bounded region, the tight waterflood pattern.
-----------------------------------------------------------
I haven't read everything yet, but Aramco mentions horizontal wells watering out instantly, water over-riding oil, loss of drilling mud, and other anomalies due to widespread DFNs.
Bob Shaw in Phx,Az Are Humans Smarter than Yeast?
Euan,
I've been playing with Uthmaniyah dimensions, doing similar calcs to you. I've got slightly different numbers. Assuming you mean 89% is oil, not water I end up with ~10 billion barrels in place. Isn't there a factor you have to use to take account of gas in oil, etc. I seem to remember a 1.4ish factor?
Uthmaniyah is supposed to produce at 2Mbopd, so assuming 50-60% recovery puts us at 5-6bbl and 2500-3000 days (6.8-8.2 years from 2004). That is 2011-2012, although in reality we should expect a drop off in production and a longer tail. And this assumes nothing major prevents capture of the remaining dry oil.
It does seem a relatively close date and there may be much recoverable oil behind the waterfront - but like you as a rough back of the envelope calc it is worrying. It seems as if 9mbpd rising to 12 is less the order of the day than trying to maintain near the 8-9mbpd level as volumes drop off from the Northern fields.
89% was a typo.
I took 1 million bpd from Twilight, if it is doing 2 then obviously decline will be significantly more rapid.
One point that leaves me puzzled is the reference to depletion in the Arab D being too slow to monitor on an annual basis using 4D seismic - they say they need 5 years to see it.
On these calculations - going, gone.
So I wonder if the oil column may thicken southwards?
Euan-
Wall Street Journal said 5.6 MMBOPD last week.
Saleri said North Ghawar (AD/s) would make 2 MMBOPD at "modest water cuts" for decades to come.
The 3 haradhs are 300 K/ project
That leaves me 2.7 for Uthmaniyah.
FF
What about Hawiyah?
Damn stuart that is the big mystery.
You had a fractional flow curve which showed a 43% initial water saturation and a 30% residual oil saturation which means it doesn't compare
Then GaryP shows a little oil being pumped (don't jump me) from there.
Gary P I see 2.5 MMBOPD for North Uthmaniyah on your ref... but I have been wrong before.
Now Hawiyah - it is not on any development plan I have seen why was it skipped over.... somebody had to say something once. Maybe it is an active caldera (just kidding). But that is the way they pronounced Hawaii in my Appalachian home.
FF
Hello SS,
Look at all the wrinkles in the Hawiyah area of the Laherrere 3D---many,many fracture networks. See page 126 of the motherlode link for a quick look at all the Southern Ghawar fractures that will make a uniform waterflood very difficult. Unfractured rock in South Ghawar has lower general perm/porosity so the water will 'look' for fractures to follow. Yikes!
Bob Shaw in Phx,Az Are Humans Smarter than Yeast?
I got 2mbpd from here, figure 2. According to this Uthmaniyah South doesn't really count from a production standpoint. Why? Your guess is better than mine.
I'm not certain that's a reliable source. At the bottom of his graph where he shows the Ghawar production breakdown, he lists his source as "modeled by Jud", which isn't exactly comforting. I emailed him asking him how he knew, and he hasn't responded. I hate to accuse the guy of anything, but I just have no idea how he would know what the graph claims to know, and since he doesn't say, I don't know what to make of it.
Admittedly, I have no better idea for how the EIA or the IEA come up with production numbers on Saudi Arabia than for how Jud comes up with his numbers for Uthmaniyah, except I suppose that a large government department has more to lose if they make up the numbers, and a longer track record, and everybody else quotes them...
I'd agree that the source has question marks associated - but since I can find no other source that really addresses the question, and because it goes up and down with authority (sic) its the numbers I've taken till now.
Put it this way, I've no better idea myself.
Greg Croft says the formation volume factor for Uthmaniyah is 1.31 (that is 1.31 barrel of oil seeping into the wellbore become 1.0 barrels of oil in a tanker by the time the gas has all come out of solution).
That would assume constant flow rate of 1mbpd. Would that be realistic given this geology or would the last scraps be harder and harder to get to - perhaps averaging 500,000 per day over 20 years?? Or is the way the oil is pushed into that column make the future extraction rate pretty constant?
Ultimately Im asking if we should expect a high flow rate of oil and then a slurping sound, or a gradual (but noticeable) decline? (politics excluded for the moment)
Haven't been on here for a long while, certain issues prevented me from posting.
At the bottom of your article you have DasGupta's reservoir model and say that there is a good 120 feet of oil across a wide area of the field. That is true, but when one counts up what is on that map, you find that there is only about a billion barrels in Dasgupta's model. (I did that once.) And if even 1 million per day comes from this area, that means about 3 years of production left. And Simmons says that the perms get worse as one goes south, which would explain handily the high oil saturations down there, but it would also mean that one won't have the same kind of recovery as one does in the Uthmaniyah area.
http://home.entouch.net/dmd/Oilcrisis.htm
Where is the 3d topographicaly viz looking from the South from? That might help me settle a couple of questions still nagging at me...
If so, that would presumably shade us a bit more toward optimism on Uthmaniyah, since we already know the North end of Uthmaniyah is the worst depleted.
BTW - I still really want to know where you got that 3d visualization with a viewpoint from the South.
Originally that is what I thought as well. But as I tried to lay the area map over it didn't fit, particularly when you look to east and west at the same time. Eventually I came up with the position I found, assuming that the rectangle on this map was a rough guesstimated location (and its off centre as you can see) put on for the purposes of a quick presentation. What mainly fixed it for me was the bump in the cross section model data, tying this in to the feature on a line just south of the main Uthmaniyah peak. However, as I say, the match is less easy to get exact than was the case with Ain Dar.
Note from top down the finger of high thickness oil is tapering off to the south - limiting the upside of resources further south.
The view from the opposite direction came from an image Bob Shaw found:
Hello SS,
Here is the link for the SW-->NE Ghawar 3D:
http://lpsc.in2p3.fr/gpr/Dautreppe/Laherrere/Image78.jpg
Bob Shaw in Phx,Az Are Humans Smarter than Yeast?
Some people may wonder why that even back in 1940 there was a lot of water mixed in with the oil. Even about 100 feet below the very top of the crest, we had a water cut of about 25% before a drop of oil had ever been pumped from the reservoir.
The reason is, the entire reservoir was once 100% water. This is reservoir rock, not source rock. The oil migrated up from the source rock below, displacing the water as it slowly rose up. So even after millions of years, you still have a lot of water mixed in with the water.
This is one reason that I think "resting the fields" will have little effect on the water/oil ratio. What gravity has been unable to do in over fifty million years, a few years of "resting" will not accomplish. The capillaries in the reservoir rock are just too small for a few years of resting to make any difference.
Ron Patterson
Ron, I too had noticed the high water saturation at base - its a good observation. It is pretty unusual to see this in good quality rock offset hundreds of meters above the contact and I'm not sure this can be explained by capillary pressure.
In some reservoirs you get perched water that is trapped by a foot seal - but that doesn't seem to be the case here.
The other possibility is that this is related to the dynamic aquifer and tilted contact, resulting in water effectively flowing along the base of the reservoir - I'm not sure I like this either.
I think the resting is strictly for local coning effects and also consider if they are not pumping oil they are turning off or down the water drive on the field. So I don't think your right because the goal of resting a well has more to do with how its produced not the overall geology. To some extent resting could even be considered a way to ensure the fields and the models don't get out of sync because of local issues.
So you produce model test against data and produce some more.
Could you elaborate on the concept of source rock? A geologist friend of mine once talked about oil migrating up and then being caught under a salt dome or other impermeable cap.
Is the source rock in SA considered a reservoir that is slowly leaking oil or is it that the oil leaks out as fast as it is produced? In the first case the Saudis might consider drilling down to that reservoir. If it is simply an "oil factory" then drilling down to it would result in nothing.
Perhaps the source rock is like the oil shales in Colorado which when heated would gradually change to oil. With no cap that oil would migrate out as fast as it is produced.
How do you tell if the source rock is still producing? Perhaps it is fully cooked? Normally how fast (or slowly) is the oil produced out of source rock? (Just curious.)
My understanding is that the oil was cooked out of the source rock millions of years ago. The cooking process itself probably takes millions of years. The process for producing a reservior takes place over millions of years 30 40 to a 100 million years depending on where your counting from. The source rock is marine mud this has to bet buried and cooked and seep into the the reservoir structure and if your luck not get buried to deep or too shallow or your get NG and or tar.
You can google for all this info on the web their is a lot of good information on how all this happens. From a human perspective oil is a one time event. By the time the earth has significant quantities of oil again either we won't be human any more or we won't be here.
Neutrino, no source rock is not a reservoir. Yes, the oil shale in Colorado is a source rock. If it were buried below 7,500 feet, for a few million years, the kerogen in the marlstone, (not shale) would turn to oil.
Reservoir rock could be many types of sedimentary rock. The phytoplankton dies and settles to the bottom of a shallow sea. There it mixes with non-organic matter and becomes source rock. But like reservoir rock, it must be porous, otherwise the oil will be locked forever within the rock.
Other layers of sediment covers the organic matter in layer after layer of rock. After a few million years the source rock is buried deep enough that it heats to “coffee pot” temperatures and the large organic molecules in the rock is gradually cracked into oil. This source rock is usually very thin and spread out over a very large area.
And that, I suppose, is why the source rock is seldom, if ever, the reservoir rock also. The strata containing the source rock is usually tilted and fractured. Oil migrates out of the source rock, upward until it either reaches the surface, or a much harder rock, and is trapped.
I don’t think any source rock would be “still producing” since most were laid down over 80 million years ago. The kerogen (dead phytoplankton) would have been cracked into oil many millions of years ago.
Shell Oil does have a plan to heat the Green River oil shale to produce oil. If you get it up to around 700 degrees F it will crack into oil and gas in about three years. But it is quite complicated and I doubt if it will ever come to fruition.
http://www.aspencore.org/images/pdf/OilShale.pdf
A good but quite long PDF article on source rock:
http://mirror.perupetro.com.pe/Library/Geochem%20Eval.pdf
And to reply to Oldhippie, thanks for the kind words.
Ron Patterson
Thanks to both of you for the reply.
I have to say it Ron. Most of these technical threads have been pretty opaque. You are darn good at rendering into English. Thanks.
I think you have "blue" and "red" saturation flipped in some later images...
'Scale is not documented but presumably bright red is 100% water saturation and dark blue is 0% water saturation.'
When all but the summits of the reservoirs are blue. Probably just a cut and paste issue. Feel free to purge this comment after the fix (if I'm right or wrong!)
Thanks,
Gary
Gary, I think you are correct but it is not "just a cut and paste issue." The problem is, I think, that the top graphic comes from an entirely different source than the SPE papers which the other graphics come from. The authours are each simply using an entirely different color coding scheme.
But to use 100% water or oil is a little misleading. Nowhere is there 100% oil. As the SPE papers imply, 95% is about as close as we ever come to 100% oil.
Ron Patterson
Yeah, I was wondering if one could flip the colors so that the color scheme would be the same in both simulations. Shouldn't be hard, especially for a PC whiz like Stuart.
Yeah, the color scheme is reversed on the 3d saturation picture compared to the cross sections- it's plotting oil saturation, rather than water saturation. I think there might only be six colors (red, orange, yellow, green, pale blue, and deep blue). If so, red would represent 0-17% oil, and deep blue would represent 83%-100% oil. Yellow would be 33%-50% oil, and that would be consistent with the 'Ain Dar cross section swept areas, and also the east flank and top of west crest Uthmaniyah cross section areas.
You guys are amazing! I know Stuart was up all night working on this. Would have taken most a week, if it could even be done. Great work again SS.
On the very top graphic above the fold showing "Ghawar Field Oil Saturation Plot", roughly what is the size of the area in blue, in either feet, or area (presumably wondering how much oil is there by volume)?
And if Ain Dar/Shedgum is 2mbpd, do we have any confidence in Ghawars other 3mbpd that can be interpolated from this or is it possibly completely different?
Stuart and Khebab
Laud you for the post Stuart....regarding overlays and the relationship to maps I again urge the determination of USGS Lat/Long Positional data. Use of WGS84 datum to determine a more exact representation may be in order. This is very easy for me to say. However, my careful reading of the various SPE referenced reveal not a thing with regard to more exact geographic positioning. You guys are my heros
Regards TG80 sends
I can't think of an obvious way to related any of the pictures to absolute positioning with precision. At least not without a lot of hard work.
Note Stuart, in US patent application 7,059,180, June 2006 on "Water Cut Rate of Change Analytic Method"(you may have to register) it states that they have had significant problems with Shedgum water breakthrough and "the Shedgum Leak Area".
Quote includes the words
If SDGM = Shedgum, I'm guessing UTMN=Uthmaniyah.
Upshot is that Shedgum may well have big problems with water breakthrough in the north of the field, limiting the %age of oil that can be recovered (take a look at the bubble plots, Fig 6,8,9). Also Uthmaniyah may have similar problems with water breakthrough as a result of these faults.
The patent is worth a read since I'll guess the other graphs have more light to shed on Shedgum.
Gary,
The dual / tri porosity system in Ghawar is well known - where either faults or high permeability depositional facies allow rapid water chanelling from injector to producer. Aramco have been batteling this for decades as it creates water handling problems and may result in oil being by passed by the flood front. The wells with rigless water shut off etc are designed to combat this problem.
In answer to a question posted by nate a couple of days back - offshore installations often have a max fluid handling capacity. So once water is started to be produced this may have to be at the expense of oil. I imagine that KSA has similar problems, where flows of oil need to be limited simply because they do not have the capacity to deal with all the water.
Of course ever - higher water production is a bad sign of a maturing field / province, but water cuts of around 40% are still trivial in the grander global scheme. Most oil companies produce way more water than they do oil.
Thanks Euan - I was curious about that.
So let me get this straight. Infrastructure capacity is built to get 1000 units of fluid out of a field/area, with intent of getting 500 units of oil. At first they get 500 oil and 300 water and there is excess capacity in the infrastructure. As water cut increases they get to 500 water and 500 oil - they can get more oil out but the pipes/infrastructure can only handle 1000. Then when the water cut really increases, they are getting 700 water - even if there is more oil that can be pulled up - the fluid capacity of the built infrastructure can only handle 1000 units so they can only get 300 oil? Is it along these lines?
Another example of production differing from productive capacity?
Nate - I think so, but I'm not sure, this is correct. To expand production they would need to expand their water handling capabilities.
That's approximately right, but any field that starts production at an overall watercut of 38% has been very amateurishly developed.
The oil-speak term for the combined flowrate achievable by all production wells, at any given moment in time, producing without any plant-capacity constraint, is "potential", or "well potential" or "production potential". When calculating this you normally assume a lower limit on wellhead pressure, set by the pressure in the first-stage separators. The actual value of potential depends on reservoir pressure, rock properties, well design, tubing size and a host of other factors. As you drill more wells, the potential increases; as reservoir pressure declines, and watercut increases, the potential decreases.
The term of art for the maximum throughput of your production plant is "nameplate capacity", so-called because major items of plant normally come with an engraved metal plate attached somewhere prominent giving the place and date of manufacture, the name of the manufacturer, and a summary of operational limits for the equipment (pressure, temperature, flowrate, power output for prime movers, etc etc).
When well potential exceeds production plant nameplate capacity, you're on plateau. When it falls below, voila! - you're off plateau. A lot of the craft of oilfield operations consists of monitoring changes in potential, extrapolating into the future so you can time the drilling of new wells to keep the plant full (at nameplate capacity) without wasting money by drilling wells too early (and then keeping them shut in because your plant is full). Ideally each new well should come onstream on the day that the potential of all the other wells declines to the level of nameplate capacity. In practice it's a bit harder than that.
Nominee for understatement of the year award I believe :)
plucky - thank you for that info - this is mostly over my head but Im learning from the discussion. Does 'nameplate capacity' include all fluids (water and oil) or just oil?
I haven't worked in the oil industry, but it would typically be hydraulic capacity, with the oil/water seperation equipment being the limiting factor. You have to keep below a certain flow rate, or you just won't have sufficient residence time to achieve the required separation.
I can't believe that it is that big of a deal to increase the capacity of the oil/water separation system. Water treatment systems are usually easily upgradeable.
I think it is a big deal when your talking of millions of bpd.
A ten percent change in water injects/water cut is 100kbd/million barrels. Thats a hell of a lot of water.
At 5mbd it 500kbd of water that needs to be processed.
So I'd say for KSA at the volumes they do water cut is a huge issue. In general their papers support this notion. They could lose a lot of production just from limitations in water handling alone much less depletion and wells watering out.
So your talking about production declines going from 8% to 18%
or more if you jumped 10% in water until they got a handle on it.
GOSP
According to this paper the Saudi GOSPs are designed for around a 30% water cut. The input is a tight emulsion (means no free water) and the separation requires demulsification as the first step. Almost certainly, if the plant was originally designed for a 30% water cut at X mmbpd it would not work unmodified at a higher water cut. Upgrades would be required, possibly even one or more separation stages.
To the specific question of nameplate flowrate for the plant, it would be total design fluid feed at some specified water cut.
Does 'nameplate capacity' include all fluids (water and oil) or just oil?
It's whatever limits actually apply to any specific piece of equipment, which depends on what it's designed for. A flare tip will be rated for maximum gas flowrate, for example.
A production process train will generally consist of several items of plant in series, and the item with the lowest throughput will determine the overall plant capacity. If your separators can handle 1000 b/d but your export pumps are rated at 700 b/d, then your nameplate capacity will be 700 b/d. If your wells are all producing at a watercut of 50% (to make the illustration easier) and your separators and export pumps are rated at 2000 b/d liquids but your water cleanup and disposal plant can only handle 500 b/d water, then you can only produce 1000 b/d liquids because that will contain 500 b/d water, and you will therefore be limited to 500 b/d oil.
In other words, its likely that the totality of Ghawars wells, will sooner rather than later exhibit more water cut than they were originally designed for and the production will therefore be cut back, even though there is oil available.
If true, I actually view this as a good thing, as I prefer less production than a slurping sound.
Could this be the reason for the recent decline???
Not that the wells needed a rest, or that there was a crash, but that the % water is eating up too much of the nameplate capacity?
I think this is close - apart from the position of the cart and horse. I'd say with softening demand, the Saudis will have wellcomed the chance to switch off high water cut wells.
If push comes to shove they can switch these back on and let the oily water spill in the dessert.
And so this is the grey zone between productive capacity and a responsible production ceiling. They can of course greatly expand their oil processing facilities - but what motive would they have to do this? Given that they have already lost their potency as swing producer they may lose the desire to over-produce their reservoirs - cos all that will achieve is to postpone the inevitable crunch in oil supplies by a few months / years.
I think your on to something.
First if you think about the way Ghawar at least has been produced and the well types. When the wells water out they are gone their is nothing left to strip since their is no mobile oil behind the water front.
Next they have limited water handling capability. I'm sure they are expanding it but its a real problem for them.
They have already told us in the SPE papers that one approach they use is to mix the dry oil with wet oil to get to the water cut of the rating of the GOSP.
They rotate well generally the worst wells are rested.
Lets assume anything with a 50% or higher water cut is rotated out since they can't handle that high of a water cut.
So lets put all this together. Your right they rotated the well out but your wrong about KSA being able to produce them in any sane manner they just don't have the facilities.
So I'm asserting that they are at peak production with their current capacity. What they are doing is rotating through the watered out wells and blending with the dry oil to maximize the capabilities of the GOSP. So they cannot produce all the watered out wells at the same time. This is why they are desperate for dry oil they need it for mixing to produce the watered out wells.
So in the short term at least your both right and wrong.
The have shutin wells but they cannot produce them.
Now why are they in this situation ? Why not just expand the water handling facilities ?
First its very expensive and second these wells are dying quickly anyway go back to the original situation their is no mobile oil behind the water front so once a well waters out its a matter of months before its no longer producible.
This means this stock pile of high water cut wells is rapidly depleting over time in fact I'd suspect that in less than two years they will be few left. They have not reason to build out massive water handling facilities just to produce a small amount of oil at a high production rate.
We have had reports they are working on this and indeed they must since the amount of dry oil left is going fast but even when they do expand the water handling production rate will be much lower than today and the field will continue to decline rapidly.
As far as production goes as they manage to arrest the decline either via reworking the wells or expanding the GOSP you will see it stabilize for a few months then begin to decline again as the wells water out completely.
If they decide to do something stupid like dumping the water in the desert and over producing for political reasons I suspect you will see a brief surge followed by a even steeper decline.
I think the above ties together the facts we know pretty well.
Feel free to shoot holes in this looks pretty watertight :)
Just thought of one more thing. They have to produce the wells that are close to the water front before the oil is bypassed so they are not free to produce any wells they want.
This means they often have to deal with the worst wells in preference over the wells with lower water cut to maximize recovery. When pushed to surge they could change this and use wells with lower water cut but at the expense of destroying any chance of producing wells near the water front at a decent water cut. This gives them a good chance of doing a better surge but they are paying a high price of significantly increasing the amount of bypassed oil.
I think the above explains how they plan to pull the rabbit out of the hat. Since I feel politically they must show some production increase this summer or the game is up.
One thing. Apparently what comes out of the wells is an oil-water emulsion. You can't simply dump the oily water in the desert. Either you have the separation capacity in the GOSP for the high water cut or you might as well not produce it at all.
I took the dumping oil water in the desert comment to be related to re-injection issues not so much separation. Euan would have to expand on this. But they probably can separate with a higher water cut just can't re-inject since is hard to increase the flow of water back out to the fields thus the dumping oily water comment.
I'd suspect they would also run into pressure problems fairly quickly doing this since they are also limited on how much original water they can inject. But they should have room to do this sort of thing. One trick is to recycle the oil comming out of the GOSP back through with higher water cut oil to get the water cut into range.
If you accept they they can just dump the excessive water that they don't have re-injection capacity for and that they can probably increase clean water injects then I'd think they do have some spare capacity going this route.
Needless to say these are desperate measures.
Haradh GOSP
That's $2 billion for a GOSP for 300,000 bpd of crude. I'd seriously doubt that they built enough spare volumetric capacity at Ghawar to play games like mixing well streams of 11% water and 60% water to get 30%. Could be wrong though.
I'd have to guess that the GOSP is setup to extract oil at a certain ratio. I suspect the work similar to a good old separatory funnel in this case if your designed to handle 30% water cut your using the oil to extract oil. What you want to do is get the emulsion to split into two phases you need enough oil to create a distinct phase. Lots of different things can be used to break the emulsion salt for example.
My degrees in chemistry but I can't see the basic problem being much different. I'd guess for higher oil cuts you would use a solvent thats recycled so the GOSP is probably different for the higher cuts.
As far as spare capacity goes KSA is/was a swing producer so they would have to build out extra capacity by default.
I'd have to think that they have worked hard to figure out a few tricks.
http://bbs.keyhole.com/ubb/showflat.php/Cat/0/Number/858261/an/0/page/0#...
Speaking of dumping in the desert. These ponds are found near all the production complexes we are talking about. This one I believe is on Uthmaniyah. (Udhailiyah) The're big and appear to show oil with salt or water at the borders. They have been posted before and I don't know if they have relevance to this discussion. I'd imagined they might be a step in dewatering the oil but I have no idea at what phase. Any ideas?
Couple of clicks and you fly in there on Goggle Earth.
I was thinking this myself. You would have to guess Euan is right even if I'm off base this would mean I suspect that these ponds would fill if they are trying to handle more water than normal. I too have no clue how all this works but it could mean if you had live data you could detect this.
Depending on flight paths maybe a peak oiler with a good camera can do some cheap espionage :)
*laughs*
Yeah seems that this water is then lost to the recycling process requiring even more draws from the Gulf. But maybe they pump the breakthrough water here? I think I'm looking for evidence of high water cuts and maybe it's just business as usual. Beats me.
Then if we could just get that PO'er to put a dipstick in that pond and tell how deep that film of oil is compared to the water :)
Memmel, WRT comments further up this thread I'd more or less agree. With the passage of time the pendulum is swinging from dry oil to wet production and at some point it is just not worth the expenditure to deal with ever growing volumes of water in assets that will expire in say 10 years. It makes more sense to produce oil at lower rates for a longer period and get higher $bbl.
WRT oil-gas-water separation, I'm no expert here. But I envisage a well running at 40% water cut will provide a first stage separation - oil on water, very quickly and easily. The cost comes in stabilising the oil - it needs to be de-gassed and fully de-watered.
The first stage water phase may be the "oily water emulsion". Ideally all hydrocarbons should be recovered from this and other organic compounds, suspended solids and heavy metals removed - all pretty costly if your handling millions of bbls / day. At some stage when your separation facilities are at capacity you may just decide to spill this. I hasten to add that I suspect the Saudis are environmentally conscious and may only do this sort of thing as a last resort.
I remember looking at the images of oily pits and crop irrigation circles some time ago.
If you were in the desert, would evaporation work to seperate the water? I'm just talking off the top of my head, but would that not be a good low tech way to deal with this? It seems the salt would settle on it's own and form a basin.
What would happen first is the volatile fractions of the crude would off gas. Probably before all the water would evaporate you'd have nothing left but sludge.
Oil/water separation, even up to the high 90s percent watercut, was a solved problem decades ago. How do you think all the Mom&Pop operators in the Lower 48 manage the effluent from their stripper wells?
http://www.glossary.oilfield.slb.com/Display.cfm?Term=separator
The same applies to the management of oil/water emulsions - you can break them electrostatically, thermally or chemically. It's extremely rare to form emulsions in the reservoir. I'm not saying it can't happen, but in over 15 years of reservoir engineering I've never seen it on a field I've worked on, or heard about it from any of my colleagues. Emulsions either happen in the near-wellbore region (due to poor drilling mud design) or in the surface production facilities.
http://www.glossary.oilfield.slb.com/Display.cfm?Term=treater
http://www.glossary.oilfield.slb.com/Display.cfm?Term=demulsifier
Not much sign of channelling on those spinners - though I'm a bit suspicious of how they've been interpreted (see my screed elsewhere in this thread).
Amazing work Stuart! I can't believe how much work you have put into this over the past days/weeks. We are all in your debt and thank you for sharing this process publicly. I even think I understand it.
Now get some sleep.
If those spinner (flowmeter) plots represent correct interpretations, then yes the reservoir is flooding under vertical equilibrium (VE - mobile dry oil on top of a rising horizontal contact, no mobile oil below the contact). But it looks to me as if they've just taken the spinner curves and split them according to the surface watercut, corrected to downhole conditions using the appropriate formation volume factors. Only the final curve of twelve shows any "character" in water inflow above the contact, and that looks like it might be a scanning glitch.
For non-specialists who want in on this discussion, here is a good place to start reading...
http://www.glossary.oilfield.slb.com/Display.cfm?Term=spin%20flowmeter
If Ghawar is truly in VE then you don't need a simulator to do reservoir performance predictions, just a good set of structure and property maps, a few endpoint saturation measurements, and a planimeter. And Stu, f et al are pretty close to that point already. As far as I can tell from the published literature, Cantarell is also in VE, but this time the moving contact is the gas-oil contact rather than the water-oil contact (the aquifer was "switched-off" when they started replacing voidage by nitrogen injection).
I'm just thinking of all the simulation studies I've seen that were done by the operator, or by expensive consultants retained by the operator, i.e. with complete access to every measurement that was ever taken on the reservoir and wells, and supposedly history-matched, and still the prediction was embarrassingly wrong, even a few months into the future. I'm also remembering one case where the simulator got it only too right and the predictions were brushed off by the Pointy-Haired Boss as hopelessly pessimistic.
Still, an exemplary exercise in forensic public-intelligence work, in terms of sniffing out, assembling, collating and comparing the snippets of data that Saudi Aramco has let slip over the years. Will be interesting to revisit in a couple of years or so to see how things are working out.
If you've got time, read this excellent article by Malcolm Gladwell, originally published in the New Yorker, about the Enron affair and the perils of too much information. It's perfectly possible that the "lightweight" predictions being made here on ToD are just as good (in terms of predicting large-scale decline) as what is coming out of Aramco's hideously complex, expensive megablock simulation models running on their thousands-of-CPUs server farms...
http://www.gladwell.com/2007/2007_01_08_a_secrets.html
(Being embarrassingly wrong is also a possibility, of course).
To sum up the flow data: Ghawar declines will not be gentle, but with time, precipitous?
Great work all..reads like a Tom Clancy novel.
Yes, but the hero always saves the day and prevents global meltdown at the last moment. I don't think that will be happening this time.
Plucky, additional data shows that when they drill a short radius sidetrack above the mobile contact or set a cement plug to shut off water, they return to dry oil, or near dry oil for a period - until the water works its weary way round the plug or up the reservoir. So at least this shows dry oil production up the well. But tells us nothing of the fluid produced below the plug
What your saying is that these charts look too good to be true. I started off wanting to beleive the fractional flow story with large volumes of recoverable oil behind the flood front. Then I showed the data to a friend who is experienced in these matters and he was pleased to accept vertical equilibrium as you put it - this being an excellent quality reservoir.
This IMO is pretty important to understand - the difference between production going out like a light when the reservour is drained or trailing on for decades as wet oil is produced from behind the flood front.
Any further views...
Do you know anything about tilted contacts, hydrodynamics etc - Ron Paterson mader a point about high initial Sw at base of the oil column up the thread and Bob Shaw had a question yesterday about tilted contacts and hydrodynamics.
Hi Euan,
Do you know anything about tilted contacts, hydrodynamics
The thing that sticks in my head about the OWC in Ghawar is that it is associated with a tarmat (viscous oil zone), which would inhibit aquifer influx.
http://www.gregcroft.com/ghawar.ivnu paragraph 10
Tilted contacts and tarmats often go together - the tilted conact implies active flow in the aquifer, and over geological time the moving water strips the volatiles out of the oil in the transition zone, leaving a tarmat behind.
Euan-
The second page of that SPE paper contains Aramco's comments regarding this being a gravity dominated "purely bottoms up" process. I am not at a computer where I can post the text... perhaps you can.
The hydrodynamics of this situation.. from what I've read... are related to the difference in water salinity from West (fresh) to East (salty). The difference in hydrostatic gradients associated with such result in the tilt.... but it has been argued in the SPE for over 50 years.
F_F - thanks for comments on salinity - fresh water in west ties into artesian water (ancient rainfall) and the tar mat mentioned by Plucky. Saline to east may tie into sewater ingress. I've not read the SPE papers on this. My experince working with tilted contacts is that outside of Papua New Guinea (where rainfall and relief is somewhat higher than in KSA) that the tilt is the result of both hydrodynamics and reservoir compartmentalisation - partial seals inhibiting rapid equilibartion of pressures across the structure.
A more important question for you and PU - a major stumbing block I have with Stuart's argumentation is the vertical scaling on the saturation sections. I have no problem with scaling reservoir thickness here. But will it always be the case that the vertcial scale used for height will be the same as that used for thickness?
Euan-
I find that second question to be a very good one... Every reservoir simulator I've ever used has a single VE. Expands everything linearly. But I haven't seen every one available (of course).
And I agree with your statement below. .....May I be so bold to say we have been wrong all along.... the current problem isn't in North Ghawar but Middle.
FF
Back again.
But will it always be the case that the vertical scale used for height will be the same as that used for thickness?
I've used graphic postprocessors with a "thicken" option that adds a constant value to the thickness of each layer without exaggerating the top surface relief. You'd use this typically to view fluid movement in a very thin high-permeability layer that would otherwise fall below pixel resolution, but where everything would become too exaggerated to view comfortably if you just scaled it. The assumption being that the user knows what he's doing.
There's no law of nature, only professional ethics, that says that the illustrations in SPE papers, much less in the trade press, have to relate in any way whatsoever to the text. Common tricks include leaving out scale bars, contour labels or north arrows on maps, flipping the map N-S or E-W, leaving out the color key on a property map or resampling it so the different colors are indiscernible in important subranges, dropping leading digits on log depth scales, and much more. Allegedly. Not that I'm suggesting that any of this ever happens with Saudi Aramco's excellent technical publications.
Euan,
in the 80's, Gulf water was injected from a dozen or so wells in a place called Abu Ali. These wells flowed about 100k bpd. One issue was algae growth, not only from the water but from the heating of the water in the trip through the pipelone to the injectors.
I'd be interested in knowing if there was ever a problem with this water channeling through faults. More importantly, did this water make it's way to the hyperpermeable upper zone.
If I recall, they acidized the injectors pretty heavily. Arad D produced and injected in the open hold.
Also, I recall once we ran a neutron log on a well in shedgum. It had a HUGE spike in the middle of the oil zone. We ran probably 50 passes with 4 different tools to confirm it. It made no sense. This was a no water area.
Plucky-
Great to hear from you again. You will read that the Rocdock attacked the contingent resources argument which you brought to light 2 weeks ago.... the problem is not with what I'm saying though it is what Aramco is saying.
My huge error thus far is assuming that 4.6 ft/day velocity is perpendicular to the axis of the structure... it cannot be as it causes too fast a vertical rise. I assumed a peripheral flood and that was the most likely i, j configuration for that velocity vector in my opinion.
Now, could you please think about this...
The wet area in that paper has increased in water cut from 45% to 65% water cut over the "constant water cut" period for the entire field. Let's assume the breakthrough water cut is somewhere between 85% (i think that was your number from my synthetic fractional flow curve) and 93% my number.
Could you please help me explain to the MRC well junkies that with the 100,000 BOPD reduction in production, the water cut versus cumulative oil over the late 98 to 2004 period actually steepened. The "North Ain Dar Water Management" actually didn't happen. Not that this is critical.
But, if that wet area continued on the established trend from 45 to 65 .... it is over 80 today. Certainly it means something as to when the water cut here reaches the breakthrough water cut, whatever that may be. To produce the area at 80... many feet of that exposed reservoir are over 95. Wild stuff to think about what happens when the area goes entirely wet... when the bottom 1' of that crest is filled with water, and pulling harder on the dry area as in the past no longer is an option... what does the water cut do??
Gotta go drive the simulator now. Will think & respond...
Later,
PUD
Hi f,
Could you please help me explain to the MRC well junkies that with the 100,000 BOPD reduction in production, the water cut versus cumulative oil over the late 98 to 2004 period actually steepened.
It would certainly be interesting to see some of those production profiles re-cast into waterflood decline analysis form, though the standard approach where I work is WOR vs. N sub p rather than watercut versus N sub p - of course they will look pretty similar at moderate watercuts like in Ghawar. I don't think published f sub w or k sub r curves are likely to be accurate enough for engineering purposes though. Isn't there something in Dake's "Practice" about how it is actually useful to overlay relperm-derived decline predictions against the field observed curves?
Can you please point me more precisely at Rockdoc(?)'s critique so I can see if it's worth rebutting? The sheer volume of traffic on TOD is overwhelming these days.
Cheers,
PUD
Re: Can you please point me more precisely at Rockdoc(?)'s critique so I can see if it's worth rebutting?
http://www.theoildrum.com/node/2437#comment-176966
I've been puzzling a lot over the character of the flood. After sleeping on what I wrote last night, the Ain Dar cross sections now look to me like they support the following interpretation: the flood is in gravitational equilibrium with two exceptions 1) the initial OOWC was not level (presumably tarmat/water issues), and 2) there is poorly swept oil in the top strata:
the 9b) bears a similar interpretation.
But at least the 2004 Uthmaniyah pictures won't bear this interpretation:
A possible interpretation of the LHS is that they started producing a lot harder, so the pressure gradient from the injection is now dominating over gravity. Could this be possible?
The RHS looks very strange in 1980 - looks like some kind of artefact.
Stuart-
In the Rockdod's attack on our arguments yesterday he mentioned the formation of a secondary gas cap in Ain Dar and I saw that when I searched the elibrary but didn't download.
I read the abstract and recalled it being what we in the business call an "oilfield mystery" type of thing.
But I need to read it to gain more insight into whether that is the "drape" of oil we see, or if it is an isolated (from a vertical permeability sense) layer.
FF
Deffeyes wrote that a tilted oil-water contact was sometimes caused by water flowing through the structure.
pud, you state that "if ghawar is truely in ve then you dont need a simulator......"
well, it seems that the saudi's at least are convinced that ve is the case. why then would they buy or rent a supercomputer to do reservoir modelling ?
the answer has to be (imo): it's just not that simple.
Hi ee,
you state that "if ghawar is truly in ve then you dont need a simulator"
Sorry, I should have said 'Ayn Dar rather than referring to all of Ghawar.
why then would they buy or rent a supercomputer to do reservoir modelling? the answer has to be (imo): it's just not that simple.
Lots of reasons. Lessee.
This latter point was what I meant by "a lot of space and geometry" here => http://www.theoildrum.com/node/2426#comment-175989 by the way. If I'm required to post a list of possible complicating factors every time I make a comment about reservoir physics, well, TOD had better buy a bigger server.
Here are some more human reasons...
In practice, some combination of some of the above plus several others.
I have a very, very simple-minded question: I thought that exhausted oil fields still typically contain 60-70% of Original Oil In Place (OOIP). If this is so, then how is it possible to speak of completely "watered out" regions as entailing "100% water saturation?"
Would it not actually be more accurate to say that these regions contain 60-70% of OOIP, and thus also 40-30% water saturation, and that it is simply not possible to get any of this 60-70% of Oil Still In Place out?
In the case of the Uthmaniyah profiles, this is a mystery at present. Either a) some of the rock strata are "unusual", or b) the picture is a fake. FF has expressed the latter view. I'm not saying for sure he's wrong, but once we start thinking that Aramco is just making up the data in the technical papers, we essentially have no inferential basis for anything.
'Ain Dar seems to be watering out with residual oil saturation of 20%-40% depending on the simulation cell. The initial oil saturation seems to have been anywhere from 5%-15% in the simulation, so this would argue for an ultimate recovery percentage from 'Ain Dar of somewhere north of 70% of the OOIP - very high, but then this is one of the best oil fields in the world.
I am wondering about the oil remainimg in place after a water flood. From what I gather here once the water reaches a certain percentage, the oil no longer flows because the oil is now in discrete bubbles/particles. Would the oil migrate downward if a gas cap was introduced into the reservoir, and would it seprate from the water into a layer that could then be recovered? I suppose that the economics would be lousy, but a high quality field such as we are talking about here would make it tempting.
Wait a minute! I think you guys are making it far more complicated than it really is. If you get 100% water from a well then it is 100% watered out. It makes no difference if 60% of the Original Oil In Place is still there. You would not say it is only 40% watered out if all you got out is water, it would be instead 100% watered out.
Oil that is soaked into the limestone or locked up in capillaries that are so small that the oil is not recoverable, is not included in the water/oil ratio. Only revoverable oil can be included in the water/oil ration.
After all, how you tell is look at the water coming out of the well. If it is 90% water then the well is 90% watered out. Unrecoverable oil has no input into the ratio whatsoever.
Ron Patterson
OK. But how does it show up on these incredible 3D images we've been looking at?
Roughly speaking, the yellow areas on the 3D plot from the Linux Çluster paper are watered out and will only produce very small amounts of oil at very high water cuts in future. The dark blue areas on that plot still have an oil layer of some kind and can therefore likely produce dry oil at least from horizontal wells. The debate is all about how thick that oil layer is (which cannot be inferred directly from looking at the picture, hence the need for all this argumentation and analysis.
In the Southern half of Ghawar (Haradh, Hawiyah, and parts of Southern Uthmaniyah), there is almost certainly boatloads of oil, and the questions go to how fast it can be produced, since the reservoir and oil qualities are much poorer than in the Northern part.
JJhman, you must remember that these are not pictures taken with sonar or seismic soundings or anything like that. These are graphics drawn by a computer with human input. The water/oil mix colorations are made by the computer with human data input. They get the oil/water mix, as well as the contours mostly input from well bore samples.
Of course they do seismic soundings and get a lot of data from them. I do not dismiss the value of seismic data but they do not give you the oil/water mix. And they do not draw those pretty pictures you see of the reservoir either.
The oil/water ratio mix you see color coded in the pictures are made from samples pulled from the reservoir. They take what data they have and guess at the rest of it. The color coded pictures therefore do not include any un-recoverable oil.
Ron Patterson
ron, i'd like to add my little bit of confusion to the fire. it would appear that stuart, etal are using the term watered out or 100% water - production wise. while the reservoir would still contain residual oil
Stuart-
With regard to FF saying the picture is fake...
He is not the only one.
As you very well know if "b" is the correct xsection placement for North Ain Dar than you obviously may not have a "dry oil area".
That is why -5900 or so works so well for FF. The OWC is then -5920 or so and we don't know how high the ridge extends above the -5750' contour. But you need 204' underneath you to make dry oil on a vertical (hint hint).
But why give someone an easy nail to hit with a hammer when you don't need it (I'm sure there is an appropo saying but it escapes me).
You do have an out though.
FF
Stuart, thanks for reposting the graphics in a more standard size to ease loading on the PC and also thanks for recanting this continuing story in more layman's terms.
I've been following all the discussions for the last week, but only now, with this post, are all the pieces starting to make sense to me, a petrogeologist outsider.
Keep up the amazing work, after some rest...Euan is starting to waver.
oooooooh ...... boundless provocation.
I'd phrase it more like Euan is taking on board new information as it comes to light and adjusting his position accordingly.
But you're right - when I did the sums on UMTH I was surprised at the outcome. Also, the information showing that the saturation plot (bob's plot) probably represents dry oil at top reservoir and not a full oil column leaves me more concerned.
There is a clear picture of progressive watering out of N Ghawar - translating that into "crashing" Saudi oil production is another matter:-)
I'm wondering where they are going to get the oil for the fake summer rebound. I have to think your right about the decline not being entirely from depletion and they took some wells offline but...
Maybe the rumor I've seen of oil going from Iraq to KSA has some truth in it. The current analysis implies that a stunt like this or maybe tricks in the neutral zone ?
Time will tell I think they have a rabbit to pull out of the hat but its looking like its a baby rabbit.
"I'd phrase it more like Euan is taking on board new information as it comes to light and adjusting his position accordingly."
and no shame in that - we're all sharing in that activity.
That seems to be the picture I'm getting here as well.
But doesn't that mean that peak is pretty much now?
If the recent SA production declines are not voluntary but a result of the "progressive watering out of N Ghawar" than is SA's claim of 12MBD productive capability just bunk?
If this is the case than SA is now production limited not demand limited.
The world has lost its swing producer. Most major producing regions are declining or nearing peak.
Am I interpreting this all wrong?
"If the recent SA production declines are not voluntary but a result of the "progressive watering out of N Ghawar" then is SA's claim of 12MBD productive capability just bunk?
If this is the case then SA is now production limited not demand limited.
The world has lost its swing producer. Most major producing regions are declining or nearing peak.
Am I interpreting this all wrong?"
Stuart's 8% decline is now shown to be a REAL decline and only a harbinger of far worse to come. Things will only get catastrophic here on out.
I believe Stuart's 8% decline was Jan to Dec 06 and the year on year decline was closer to 2 %.
I think this is the most important point that the OECD has noy yet woken up to. When demand rises again I still believe that KSA, UAE, Angola, Azerbaijan will manage to raise their game - but not enough to meet that demand. OECD ministers will be lambasting OPEC for failing to raise production enough as they watch oil prices go up, inflation and interest rates rising that feed into a debt mountain.
I don't know where you live, but I suspect the OECD (not Mexico) will chug along just fine for a fair while. Very poor countries already rely mainly on bio-mass for fuel, so I see the main catastrophe unfolding in a handful of highly populated non-OECD countries that lack sufficient indigenous energy resources - Ukraine, Belarus, Pakistan, Bangladesh, Indonesia, Thailand, a clutch of S American countries and Mexico.
Global food supplies I think are another major issue - tied to biofuel development and climate change.
Hello and thank you very much TODers,
The last 2 – 3 weeks here on TOD have resulted in (for me) many truly amazing experiences, super educational and at times both entertaining and thrilling and cast a lot of new light upon the status of north Ghawar.
Stuart has done an impressive (I am hard to impress), admirable and professional job in documenting and bringing us many productive debates on how to interpret available information generously supported by F_F, garyp, Euan, Ron and of course many many others.
I am not trained within geo or reservoir, apart from been given some insights by interfaces through my line of work within oil companies. These debates have really brought me more valuable understandings.
It is debates like these that make TOD to such a great place to visit.
nrgyman2000, ditto! I don't feel qualified to add to everyone's comments, but I've read them all with great interest.
Stuart, thanks for your brilliant work!
I have to say this.
This is the magic of a community of smart, cooperative people after the (meaningful) truth. This type of collaboration would take months if not years in the traditional academic peer review process because the authors would need to 'make sure' everything was right. Then there would be petty disagreements, revisions, political toe stepping, etc. In a world careening ahead on many fronts, to get 80-90% of the scientific 'meat' in days/weeks rather than wait months/years to get close to 100% (should) have great value to society. Too, in private industry, this would be shared only inter-company - and not have the benefit of other perspectives from other companies, for fear of 'giving up ones edge' etc.
The fact that the authors (in this case Stuart and Euan), are willing to put forward their current thinking, but be open to changing their minds upon learning new data or different perspectives, gives theoildrum a unique 'real-time peer review' ability. Whether youre right or wrong in this last pass, you are closer than when you started, and this process, which bypasses the academy, the government and industry, is revolutionary and therefore special. (I sound like PG)
This is exactly the point: Nate, you have articulated this better than I ever have. It is beautifully revolutionary and magical. I'll even drop another loaded set of words: "paradigm-developing."
I have been out of the loop for various reasons, so I am just catching up with the last few days. This is truly inspired work that everyone is doing here. Stuart deserves much laud, and let's not let that obvious fact be bypassed. However, the rest of you have truly outdone yourselves as well.
Now the wisdom has to be funneled so that it can be used.
As I said in private email the other day, I have some experience of scientific publication in my own field, and I guesstimate that I am 2-3 times as productive doing this kind of "blog-science" as in the traditional mode. The ability for anyone in the world, with who knows what skill set and knowledge base, to suddenly show up and decide to be part of the collaboration in real time is just an amazing thing.
That said, it's scarier, because one is much more likely to make errors (in public) when operating at this tempo. The only cure for that is a willingness to admit them and move on. And a recognition on all our parts that this kind of work will have more errors in any given piece of writing, and it's the collaborative debate process that converges towards the truth. And of course there's a lot of noise along with the signal.
I'm not sure the problem of clashing egos is any less severe amongst Oil Drum editors, contributors and commenters than in traditional academia, though :-)
You bet, Stuart. It has been amazing to watch you, F_F, and Euan interact, develop, and debate this topic. It has been TOD at its finest. I hope you all can agree on some compromised statements and results at the end of your analyses. What we have witnessed is what occurs in the dark office confines of close colleagues. To put it on public display is truly humbling and uplifting...giving hope that others will shed the politics and fear to collaborate, digest, and come to some concrete conclusions.
It is what we need to tackle the future...thanks for forging the trail for the rest of us.
Euan...I was joking when I said you were wavering. I think you all (even F_F) have shifted somewhat from your initial interpretations.
I think what we get here is as good as peer review .
Although many (most?) of the commenters are not qualified at the level you would normally expect for peer review, the point is that some of them are.
As long as there are enough posters who do really know what they are talking about and they are willing to contribute to the discussion, the process will work.
The quality of the peer review here is as good as the quality of the best contributions.
I too wish to extend my deep appreciation of this open discussion, analysis, and debate. It is not only instructive but inspiring too.
Stuart rightly deserves the many bouquets tossed his way, and I gladly add my own. But I would also like to extend the same to Euan in his willingness to walk the plank here with counterpoints and questions that help refine the understanding we all seek. The contributions of others is also extraordinary and to be commended, as well as the willingness of everyone involved to make public adjustments of POV when and where necessary. So, kudos all around!
One can hope that a similar type honest and decent collaboration in search of greater understanding to answering the desperate knowledge needed about the true state of our energy supplies and way of life on this miraculous earth will soon prevail upon our myriad public leaders. Until that day, TOD will remain my filling station for quenching my thirst about what bumps in the road one can expect lie ahead.
Thank you all.
For any science writers out there: What's been happening on TOD the last few weeks would make an outstanding "general science" book about PO. Such a book would be on the order of Gleik's Chaos, or Genius--perhaps it should be called Oil.
Suart - I've Dugg and Reddit - but it seems that many readers have not - tut, tut (replacing the expletives I had in mind). Lets start with points of agreement and move down the list:
Uthmaniyah
Very little disagreement here and as you will see further up the thread doing some sums on this shows a relativley short production horizon. However, there is a pretty large area of blue between the UMTH tongue and Haradh.
Fractional Flow
I have not followed all the deabte on fractional flow since F_F burst on the scene. My inital understanding here was that significant volumes of residual oil may be recovered from behind the flood front, but following consultation with my good friend / expert I learned that this was unlikely to be the case. The good reservoir of N Ghawar will perform like a piston. So when when water hits horizontals it will be lights out. So it seems we agree on this aswell.
For the benefit of other readers it needs to be born in mind that this argument for a vertical equilibrium system (VE - see PU's comment somewhere) applies only to the areas of exceptional reservoir quaility of N Ghawar. Other areas with lower permeability will have much wider transition zones between flood front and unmovable residual oil.
N' Ain Dar
My main query here is vertical scaling - question posted for FF and PU. If vertical thickness and vertical height scales are the same then you may have a point.
On the one hand I need to commend you for the energy put into trying to prove this point but on the other hand need to point out that I personally am somewhat put off by this same sledge hammer approach. And for example GaryP's post on this thread is influential in consolidating my views on Uthmaniyah.
If you are right, then a number of things do not stack up in my mind:
If there is only 10 feet of unswept oil in N Ain Dar then it is game over here.
The Saudis have only drilled one maximum contact area well on the structure - but are planning to drill many more?
I'm also reluctant to extrapolate conclusions from N 'Ain Dar into South 'Ain Dar and Shedgum:
Statements like ths leave me stone cold - but there again this was probably written at 5 am:)
Other comments
All your charts and plots etc are great and enable a great deal of observation to be made.
One I would make is that there is still oil in the saddle between N and S 'Ain Dar. However, it seems this area has low permeability and this oil may well be by passed.
Well productivity
Now to turn to well productivity. I've read the piece in "Water in the gas tank". Here's your chart and some of what you said:
What you forget to say is what I said in my post:
You also forget that many of the wells drilled using the new rig workforce are probably on Khurais - so many of the wells you compute are not yet on production. And many of these wells are injectors and observation wells.
So as often is the case between us the difference is actually paper thin. How many wells in your model for end 2007 and how many retired waiting to come back on?
Euan
Euan,
Not sure if this is a dig at something I've said or not. If so I'm sorry, I'm not trying to railroad anything - just trying to pull together any little bits of illumination I can find to try to understand what's going on. To me its very much the scientific process - put up a hypothosis and let people shoot it down. I'm well aware that others have more domain knowledge than me. Setting some bounds around what Ghawar will do is the interest at the moment, but my main interest is wider and focuses on what for me is the key question - post peak decline rate.
Post Peak Decline Rate……that is truly a tough (and possibly controversial) one.
Definitely not. What I'm saying is that your excellent plots presented with objective language have been persuasive for me.
Stuart's excellent plots tie in with yours and all this ties together with "Bob's saturation map".
I still think we need to fully understand the 4D seismic impedence paper. I've no problem accepting that the tongue of invariant data is oil - less sure about the rest.
First I agree in principle with you that some wells have been taken off line to be brought online later.
Next you have to assume that KSA is suffering some decline in production they have stated so themselves. Whether or not this decline has been made up by bring additional fields online is a different argument.
What I don't think you have done with the well data is give us any reason to guess how many well where taken off line to bring back online later and how much was lot to decline and how many new wells where brought online to compensate not to mention how well :) the did at arresting decline. And of course how many where producers or injectors and of the producers what's the well type MRC etc.
I just think you don't have enough data to draw your conclusion that decline was voluntary with the data you have presented. You need a lot more information that may or may not be available. Why do you think your well count and per well production number is sufficient ?
Since they generally drill out the injectors early and convert old producers to injectors over time simply a change in the nature of the wells drilled would have a big effect on the number above. What about wells that are reworked as laterals is this a new well ?
But to finish again I agree that KSA has probably resumed some well rotation I'm beginning to doubt that its anywhere near what they used to do. And of course if your looking at well data you cannot ignore water and gas handling issues. The general form of the argument is about infrastructure and how they are using it. It might be possible to make a case by looking at overall infrastructure use and construction.
Not sure which way it would go. And more important not sure a strong argument can be made based on well data outside the obvious that its gone down why is not implicit in the data.
Its 1 am here in Aberdeen, and I'm breaking into my second box of kleenex and second bottle of whisky - so if the spilling is a bit hity thats the reason.
1. Historically Saudi production has gone up and down and up down etc. This is related to the swing producer status. So my feeling is that the onus is on others to prove that the current down is production constrained - I think Stuart realises that and has been going to extraordinary lengths to try and do so - i.e. prove his point.
2. Recent declines are IMO too sharp to be natural - hence my conclusiion they are voluntary. This leads us into a grey zone because I'm quite sure the Saudis will welcome the opportunity to rest certain reservoirs - and this view is reinforced by recent debate on Ghawar.
3. I'm also still drawn to the fact that historically oil production is demand driven - and demand softened in 2006 - owing to high price - which is related to global production / productive capacity.
4. With respect to not having enough data to draw conclusions ... I thought the main thrust of my Bare Saudi post was drawing attention to the fact that these data existed and that there was little evidence for trouble ahead contained in them. Also that the Saudis have had this rolling program of well retirals etc. And I still believe that if a catsatrophic plunge was immenent that there would be a sign in these data. However - Gilles pointed out that we need to look at other data sets to see what happens to well productivity ahead of peak and decline - I was already planning on looking at that and will do so once Stuart drops from exhaustion and I get a chance to return to data analysis.
One irony for me here is that we are really getting down to splitting hairs - I would say however as a result of recent debate is that my horizon on Global Peak is moving forward from the 2012±3 years based on Khebabs loglets - but to be honest I need a fair time to think.
OK...Euan is hitting the whiskey and moving his goal posts closer in...you're starting to scare the sh*t out of me.
DF,
I know what you are saying and I kinda agree.
I worry that it puts an extraordinary amount of pressure on Euan. Let's let the man express his opinion (and modify it) freely.
If we put so much weight on what he (or anybody else) says he (or anybody else) will natually hesitate.
That said, there has been some amazing detective work going on here.
I'm trully impressed people are sharing work and keeping an open mind to such a degree.
Back to the sidelines :-)
No problem I happen to agree with you that its highly probable some wells where rotated out the question is how many.
So far the data you have presented is inconclusive other data in this thread is pointing to at least some of the drop being involuntary. My position is its a mix and impossible tell the percentages and its probably changing. Right now my guess is its 6% decline and 2% resting.
I hope you dig up more info. Looking at above ground moves by KSA be it water handling wells retired or drilled etc is probably as informative as the other approaches we are taking if we can get enough data.
Enjoy yourself.
To me its indicative that I see no slowdown in the development of the other fields they are looking to bring onstream over the next five years.
If you truly thought you had more oil than the world wanted to buy, and no problems with existing wells - wouldn't you keep producing the sweet stuff and delay one of your development projects?
Now maybe they are only doing all this to hit that 12Mbpd target that was set - but this is business and pushing some of the capex hump down the road slightly would always be a priority in PM terms.
The scenario that occurs to me is one where SA is looking to push the bulk of their day to day production onto these new wells, keeping the drips left in their best wells for any surge in demand. They know that Ghawar is going to lose ~3-4mbpd in stages and are looking to switch over smoothly to the new fields, keeping North Ghawar for the surges in demand.
If the decline is largely involuntary, then we must applaud the Saudis for their masterful management of the demand/supply/price equation.
Clearly, supply and demand will always balance, with price as the adjustment variable. Substitution and demand destruction are in action at $60, with the flattening of the world demand curve as absolute proof of that.
It is highly likely -- but unproven -- that there is not enough world production capacity for oil at $40 -- because at that price, you have the buyers who were priced out coming back in. More electricity in Africa etc. Presumably, the Saudis know that if they pumped flat out, they could not drive the price down very far.
So it certainly looks as if the Saudis have decided on the $60 price level, as one at which they can still be the swing producer..... OR maintain the pretense that they are still the swing producer.
I suspect that opacity as to their true production capacity is essential in regulating the oil price : i.e. if they really aren't able to hit 9 MBPD any more, then the speculators would go apeshit if it became common knowledge.
I'm assuming that there is considerable benefit for (nearly) everybody in having a fairly stable oil price. Clearly, it would be useful if everyone was certain that the price will never go down significantly -- which is not yet the case -- but wild fluctuations between $50 and $200 would certainly not create good conditions for a transition to a post-oil economy.
Which leads to the question : if The Oil Drum blows the whistle on the Saudis, are we precipitating chaos?
Discuss!
That my friend, is the question of the day. I alluded to it in my CERA post wondering if they were purposefully taking the opposite book-end position so stability can be maintained long enough to build upstream capacity in status quo environment.
Just as we are not ready to deal with a permanent decline in Saudi oil, we are equally unprepared to deal with the perception of a permanent decline in Saudi oil.
Unless it was a false alarm - then it would be a good thing - allow policymakers to make painful changes, that will seem less painful once the spigot opens just a little.
I can't see any upside at all to the CERA position : the illusion of business-as-usual for several more decades, with prices declining rather than rising, is exactly what is needed to encourage people to do nothing to prepare for the decline of oil. My only explanation of why they maintain this absurd public opinion : they must surely be giving more realistic private advice to their paying clients -- nobody would pay for their public drivel, it serves as a cover to give the paying clients a competitive advantage in preparing for the coming crisis... perhaps also to promote the oil industry, which will obviously lose its dominance once alternatives go big.
"Which leads to the question : if The Oil Drum blows the whistle on the Saudis, are we precipitating chaos?"
With all the people reading The Oil Drum, reposts, and people being e-mailed with all this( also, Matt Simmons mentioning the site), I'ld say the whistle has already been blown. Enough have seen and heard. The genie can never be stuffed back in the bottle. It is now subject to the snowball effect. Gasoline goes up another $1.00 a gallon, and everyone will be looking for answers, and it will all be here to find. It will be the supply/demand spread(and susequent demand destruction) that precipitates the chaos, not the truth as to what's really going on. It appears your argument is that most everyone should remain in the dark so that those that know can continue to profit from everyone else's ignorance a while longer. A point I believe you miss; Demand Destruction will be PAINFUL, not a quiet little equation that goes on behind the scenes. We are talking World Class Pain. Capital destruction, famine, death. On a personal level, unemployment, hunger, homelessness, financial and personal loss. Are you REALLY arguing that people should be kept in the dark until the platform has been knocked out from under them and they find themselves hanging by the neck at the end of a rope?
This will not occur. Denial is the norm and will remain the norm.
Ghawar Is Dying
The greatest shortcoming of the human race is our inability to understand the exponential function. - Dr. Albert Bartlett
I apologize for any offense caused by any snark that crept in in the small hours of last night. I think I had a "Kunstler moment" or two there :-) Only a pale shadow of the real thing, however :-)
However, there is a serious reason for putting a huge amount of energy into the placement of that 9b) cross section, in that the entire 'Ain Dar/Shedgum timing turns on that. I think you I and FF are now in agreement that at some point those 2mmbpd has to water out in a somewhat dramatic way. But if that cross section is half-way down the hill, then it could be a decade off. If it's at the top of the hill, then it pretty much has to be now.
I'm sceptical of your argument that a lot of rigs currently would be drilling for Khurais. Have a look at the Sep 06, 2006 press release on Saudi Aramco's website. At that time, 7 months ago, they were basically at the stage of digging trenches to pour foundations for the facilities. I can't believe they'd be drilling wells (with incredibly expensive rigs) that need to feed into a facility that isn't going to be finished for several more years.
Stuart,
It has been standard practice for many years off shore to "pre-drill" wells ahead of facilities completion. The NPV of assets is greatly enhanced by the ability to bring fields on at plateau as opposed to a gradual post-facilties build in production. So I imagine when Khuaris comes on there will be a blast of oil - I thought 2008 / 9 - correct me if I'm wrong.
With respect to that 9b cross section - if it is at the top of N 'Ain Dar - then N 'Ain Dar is already history - but if as you point out if it is not then there could be several years of high productivity left. Your connections between top reservoir permeability, oil staurations and topography are all noted- converging evidence?
The main point is that I believe with this data assembled in the public domain it may increase pressure on Aramco to release more. I sense that they have been releasing lots of data subtly.
There is more than enough data here for a review paper on Ghawar.
Euan
I buy that. It seems like one would want all the wells ready on the day the GOSP opens. Having them ready either too soon or too late is going to hurt the project economics.
This suggests to me a line of attack on understanding that problem. If one is willing to make some assumptions about well productivity, and extrapolate historical rig productivity, then we could estimate, for each megaproject in the schedule, how many rig-years would be needed ahead of project readiness. Presumably, those rig-years would be somewhat concentrated close to the time of readiness, but not later (as you point out).
Given that, we could at least roughly estimate how much of present and future rig count is associated with the known megaprojects, which might enable us to more clearly infer a trend in the number of rigs used for keeping the existing fields going.
I believe 2009. Khursaniyah is supposed to be the end of this year (500kbd).
I think it is time for Simmons and Whipple to run with the ball here. They can reference today's post the next time they care to write or speak on the topic. Crank up the PR machine boys and pass that third bottle of whiskey.
First time commenter, been reading since last summer. The April 6th post really served as an impetus for me to register.
I've been trying to wrap my brain around some of the basics concerning Ghawar. Do I have this "sort of" right?
1) The top of the Ghawar reservoir seems higher in the south. Simply put is Aramco injecting water in the north to "drive" oil from the north? Permeability aside...of course if the north has more permeability then isnt this the logical area to inject water, the most water, the area to start injecting water ?
2) The south end of Ghawar contains sweeter crude ? But has a lower permeability? So if the North Ghawar contains more sour crude, would it be prudent to get it out now, saving the sweet stuff for later?
So when the north of Ghawar is depleted to the point of shutting oil producing wells, SA will be able to pump, albeit slower ?, good quality, easily refined sweet crude. Which looks to me, in a post peak world (tar sands, sour crude), that sweet crude would command top dollar. Sounds good for the KSA, no?
The graphics posted over the last 36 ~ 48 hours have really spurred my understanding (hopefully) of some of the details.
First your not going to actually move the oil all that much.
The water drive is primarily for pressure. If the oil actually flowed that freely you would only need a few wells.
The carbonate source rock is like chalk so think of it as a very tight filter.
Next my understanding of the oil quality is that the north is higher in quality than the south and the reservoir is also better or more porous. I think it has less fractures also probably more correct a few big ones. Fractures are important because the flow of water through the fractures is much higher than through the rock. Our common ground water that you get from wells flows predominately through fractures in the rock not the pores.
A really porous example would be a air stone for a fish tank. This is made from fused silica. Brick is another example and of course sandstone. You can imagine that its tough to get anything to flow through rock but the pressures are very high.
Here are some links.
http://www.fossil.energy.gov/education/energylessons/oil/oil2.html
http://en.wikipedia.org/wiki/Oil_reservoir
Thanks memmel,
I think I mis spoke, I shouldn't have said "drive the oil". I think I should have said "what/where is the best place to start injecting water?".
(Ahh, the higher the Oil Gravity (Degrees API) the sweeter, oops, Ok.)
http://www.gregcroft.com/ghawar.ivnu
When I look at this
http://www.searchanddiscovery.com/documents/2004/afifi01/images/07.htm
I think I would start water injection in the north, no?
One could possibly clear out Abqaiq of oil, easily as a 1st step ?
Sorry I can't answer these questions once you get beyond sixth grade level oil geology I'm not that useful. I can understand its hard to grasp why certain fields are developed certain ways we can read about the decisions and understand what people have done but the why part is really tough to guess and seldom explained. Feel free to ask why questions whenever they come up I should more often myself.
Simple things like
Why is Ghawar such a big field in the first place what special conditions caused this concentration ?
Why is the oil concentration higher in the middle east than anywhere else?
Why is the sky blue ?
Kidding that one I know :)
I thought it was that the same geologic forces that created the Great Rift Valley and the Red Sea caused the depression that allowed the collection of organic matter to provide the biological basis of the oil. Similar to the asteroid strike that allowed Cantrell to form. But then again I have no idea what I am talking about.
:)
I was actually thinking the same thing to scared to say it.
Its one of the few places on earth that has a rift valley going through dry land/ old sea bed.
Actually I'm not sure where else this unique situation exists
maybe in Alaska ?
First your not going to actually move the oil all that much. The water drive is primarily for pressure. If the oil actually flowed that freely you would only need a few wells.
Well said memmel. The only reservoir engineering reason for injecting water is pressure maintenance (and produced water disposal in a few cases). You don't "sweep" the oil - once the water has entered the rock (and you have some control over that, but not perfect control), its movement is subject to the laws of physics governed by parameters which are mostly impossible to measure with the accuracy required to make a priori predictions of how it will move (Ghawar actually being a counterexample, if it is truly in VE). Waterflood management consists of postponing harm to the production wells as long as possible, and mitigating that harm once it has occurred.
To reiterate - you inject water to maintain pressure, and you trade the considerable advantages of pressure maintenance off against the harm that the water does in your production wells. Engineering is all about tradeoffs, of course.
First, I want to thank Stuart, Euan, garyp, Fractional_Flow and everyone else who has participated in this discussion. This has been fascinating to watch and educational in the extreme. Again, my thanks, people!
As for what this means, I think the most optimistic viewpoint is that of Euan and his still has this field nearly dead in less than a dozen years!! The other viewpoints are worse but come to the same conclusion.
It seems reasonable then to conclude that northern Ghawar is toast somewhere between right now and 11 years out or so. I also think Stuart's original bet, that KSA would never produce 10.7 mbpd, is still very safe and anyone taking that bet is foolish in the extreme. It looks to me that the best KSA can do is hold the line somewhere between 8-9mbpd and it may be far worse.
This strongly suggests that sometime over the next few years the problems are really going to surface in ways that they cannot be hidden from the public. Instead, the leaders of the industrialized world will either have to acknowledge these problems or point at other problems as the cause. And the end result remains the same - significant reductions in the amount of available oil.
Stuart: This appears to more strongly support your general thesis that "peak is now", doesn't it? Given the problems of mitigation versus the lag time of the market, what do you recommend be done now?
Euan: Even if we accept your position, then we have to acknowledge that there is no possible way that the USGS estimates of KSA oil production rising to 15 or even 20 mbpd can ever even occur and further that we have a serious decline occurring within the next few years, ahead of Hirsch's 20 year timeframe for mitigation. Would you concur with those statements and if so, what do you think needs to be done?
Again, my thanks to Stuart, Euan, garyp, Fractional_Flow and others for this brilliant bit of detective work.
Ghawar Is Dying
The greatest shortcoming of the human race is our inability to understand the exponential function. - Dr. Albert Bartlett
In my view, the short term most critical thing by far is vehicle fleet fuel efficiency - that buys us time. Unfortunately, at least here in the US, people really have not gotten the message yet:
(Data through Dec 06).
I would have liked to have seen that graph shooting up, seventies style, at 3-4% a year by now. The fact that it's creeping up only at the very slow sub 1/2% average of the last 15 years, in conjunction with this stuff on Ghawar, is not a happy combination at all. I hope that changes.
The 2 mbpd you are talking about sooner or later disappearing due to water saturation is a full 10% of ALL oil use in the US.
Vehicle fuel efficiency (which has a time lag) is important, but given your sleuth-like work here, its kind of like a brilliant doctor discovering you have cancer and recommending daily vitamin C.
Well, I disagree with that. I think the right comparison is that 2mmbd is 2 1/2% of world production. That means that world production has been almost flat over the last couple of years (increasing maybe 0.3%-0.7%, within noise of zero), instead of increasing by about 1.5%/year. So if the US and everyone else where getting a few percent more efficient each year, we would be ok in the short term. And that would give us more time to figure out the long-term.
However, the combination of the supply problem, and no efficiency response due to lack of societal acknowledgement of the need to get on the stick here, is definitely scary. That's what's keeping me up till 4am every night to do this stuff.
As far as the decline rate goes you may want to look at this post by WHT. I'm not sure you have had a chance to look at this thread.
http://www.theoildrum.com/node/2376#comment-177444
The ability to maintain a plateau without significant new discoveries is not a good thing. So their exists a chance that our situation could quickly deteriorate.
I think the current thread on Ghawar exhibits exactly this problem unfolding for the world largest oil field.
"The largest reservoir left untapped is Conservation."
I liked that one from Simmons. It's a good sound bite.
The two million barrels by itself could be managable!
But if you add that to the sharp downside to pemex and possibilities of countries like Russia cutting production fearful of collapse. (Both these have been alluded by Mr. Simmons in the recent financial sense interview). In effect the decline coupled with the behaviour of the producing countries while certain about the downslope of the world production could be key factors IMO.
I have visited this site several times and am trying to learn --- it is much like learning a foreign language.
I was intrigued by this comment: This strongly suggests that sometime over the next few years the problems are really going to surface in ways that they cannot be hidden from the public. Instead, the leaders of the industrialized world will either have to acknowledge these problems or point at other problems as the cause.
Can you explain more of your thinking?
I take him to mean:
a) our leaders will come out and explain the truth about oil depletion, our options, and the sacrifices/changes we will have to make in a new paradigm
or, more likely
b) due to continued violence in the Middle East, increased hurricanes in the Gulf, terrorist nations that dont like us and are hoarding their oil, democrats in Congress, the environmentalists not letting us drill some great reserves, sunspots, those pesky kids at theoildrum etc., we have a temporary shortage of oil - go back to your regularly scheduled activity, except you can only drive on MWF and gas will be $8 for the forseable future.
Thanks, Nate.
I was thinking the consequences might be greater not that what you describe isn't challenging. I feel the situation is worse for Americans because people don't understand the issue of oil and the dollar. And, I fear the US will pursue endless wars in an effort to control how other countries handle their resources.
I think the Iraq war has shifted public opinion massively against war, and that will last a while. That has empowered the Democrats and it's going to make it very hard for a hawkish Republican to win in 08. So the US fighting endless resource wars doesn't seem very probable in the near term. With the caveat that the Bush administration may well have a few more unpleasant surprises in store for us before they are finally consigned to the dustbin of history. They are probably restricted to air attacks, however.
Stuart, this is a crucial observation. This is why I'm not a "resource war doomer". We should count ourselves lucky, perverse though it is, that the US ruling junta didn't pick a war they could win...
Even though Iraq is the biggest foreign policy disaster in American history, and a bloddy occupation that has patently failed; the debacle could get worse; that is, if the conflict spreads throughout the region. That is the great fear in the Middle East at the moment.
Still, things could conceivably get worse, if we're not very careful. I believe the real test for the future direction of US foreign policy, is going to hinge on how we deal with the "Iranian problem". The "Iranian problem" is, unfortunately very complicated and difficult to "solve" for the United States.
What is the core of the "Iranian problem"? Is it their growing influence? Their radicalism? Their refusal to become a dependent part of the empire? I think the immediate cause for concern, is that they might develope the potential to produce nuclear weapons at some time in the future. If they had a few nuclear weapons, attacking them would suddenly become a potentially very costly affair indeed. They would no longer, like Iraq or Afghanistan, be virtually "defenceless". Attacking a nuclear armed Iran would, in reality, mean the United States getting involved in a nuclear war in the Middle East. That would really concentrate people's minds!
So the American war-party has a dilema. Attack Iran now, while Iran is still "relatively weak", with all the risks involved in that course, or wait until Iran has developed a true nuclear potential, that might/will make an attack vastly more costly, if not, unthinkable. Would the american people support a nuclear war with Iran, if Iran were not directly threatening the continental United States and not just US "interests" in the Middle East? Would the American people go to war with Iran over Israel, if the United States wasn't directly threatened?
Is there an alternative to going to war with Iran? There is, only it requires a sea-change in American policy in the region. The US must establish full diplomatic relations with Iran, recognize the terrritorial integrity of Iran, accept the full ligitimacy of the Iranian Islamic Revolution, welcome Iran as an equal partner in solving the region's conflicts, drop any sanctions against Iran... Well that'll do for starters! Clearly, this means the United States making a strategic retreat on whole range of issues and it would be a dramatic defeat for the war-party across the board. The rise of Iranian influence is now probably inevitable anyway, so why not make the best of it and come to an accomodation with them? It's arguably a better alternative than war.
Not gonna derail this fantastic thread with political commentary but all this detective work makes other things a bit more apparent.
Cutting to the quick-
if Stuart, Euan et al can puzzle out this picture, I have to believe that the CIA and other government agencies can as well. I am not a conspiracy theorist (tho I sometimes play one on TOD), but the American public is so against war right now that if we were to attack Iran in the face of such public disapproval, it could only ultimately be about the oil. As Iraq was, despite the rhetoric about Saddam.
If you look at the US remaining reserves, how much of that is actually recoverable at an energy profit? And Canada too? And Mexico?
Permanent military bases surrounding the sweet spot where 2/3 of the worlds economic lifeblood still lies underground would be an entirely plausible ultimate rational for deepening US presence in Persian Gulf. The proximate reasons, well - take your pick. How long after Saudi actually goes into decline does China or Russia put ground troops near Iran?
One possibility is that the Iranians themselves figure out that they will benefit more from interation trade and internal development then international terrorism and a bid on being the top dog of the muslim world. Ironically this could make them the most important muslim country within a generation or two of creative cultural and economical development.
But I am mostly an optimist.
Most of them already understand this pretty well. Ahmadinnerjacket will be out of power in a couple of years. Being rude to the Yanks is of course pretty popular domestically, but it won't save him from electoral defeat, mostly for his disastrous economic management, also because of his social conservatism.
There is a line of thought that says that the supposed Iranian nuclear weapons program is a sort of elaborate double-bluff. Remember that Saddam always claimed that he had no chemical or biological weapons, while also acting as if he had something to hide... which he didn't! It was a means of keeping the Iraqi minorities in check... fear of imaginary chemical weapons.
It may well be that the Iranians are pulling a similar stunt... according to the experts, there is no clear evidence of bomb-building activity... it could be a matter of gaining international leverage, and domestic popularity again.
Iran and Pakistan are now buddies. Pakistan has said they will support Iran if the US invades. Pakistan is a nuclear power. Iran has agreed to a pipeline to Pakistan and India. Pakistan and India have nearly settled their differences I believe as a direct result of this. I would not be suprised to see Iran, Pakistan and India form a power bloc in the region. With both Pakistan and India being nuclear powers, I would imagine the US is treading on eggshells.
I find that hard to imagine.
Pakistan and India cooperating?
Plus I don't think that Musharraf trusts Khamenei.
The USGS satements I think needs to be viewed as total bull shit.
I've had this article published on the UK Government Department of Trade and Industry Web Site
http://ior.senergyltd.com/issue13/talking-point/
And since then the Government has been talking about falling oil revenues.. I'm too modest to believe this article first published on TOD is the reason. They have yet to grasp the concept that there will be difficulties in sourcing supplies from other areas - but I think the debate we have had here today provides me with ample information that liquid fuel availability is about to get accutely worse.
As to the future - I believe the focus needs to be on future energy as opposed to future oil resources - and the impact that energy future has on climate. Main uncertainties here are coal, U and natural gas reserves. I see no reason at all why coal, nat gas and U should all peak together! I have a post in preparation on this in the Q - but need 2 or 3 weeks clear time to complete.
What needs to be done - we need to persuade our politicians of the problem. Above all we need to devise ways of ensuring economic stability / slow growth with falling per capita energy consumption.
I think Jerome Paris is the champion of energy efficiency - to plug the gap between fossil solar and fossil supernova energy decline and the hopefull emergence of fusion - we need to devise ways of improving the efficiency of thernal power stations and transportation - and build wind mills to enhance the image of the politicians who have our future in their hands.
I've bumped into Jerome @ D~KOS, always posting a good diary there.
Since you mentioned fusion, I have to mention Dr Bussard and his IEC reactor.
I've been trying to follow the story, it may be a Non profit is/has/will be set up soon to help raise money for the next step, building WB 7.
I don't think that's possible. Whilst energy efficiencies are possible, they will tend to a limit which will be well below 100%. Before that limit is reached, increased populations and economic activity will lead to greater energy use. Once that limit is reached, increased energy use is certain. Economic growth must stop. A stable economy is a very different economy from what we have now.
Tony
I am greedy for me, my neighbolurs and future generations. I realy would like to have economical growth and channeling of a lot of the created resources into long term investments that makes it a lot easier to muddle thru bad times.
Yesterday you said your chosen positioning of the cross section was "blindingly obvious" and that your analysis "removes all conceivable doubt" as to the location. Today you have a different location, on the other side of the top of the reservoir. It's good that you are updating your opinions as your analysis proceeds, but I think this is evidence that you are ascribing too much certainty and reliability to your conclusions.
I have moved it a few miles in light of new information to a position that doesn't change the conclusion. A larger change in my position is my acceptance of Fractional_Flow's account of how much production might be at stake. In some ways, this last change is an improvement in that now I no longer need an unknown field decline to explain the production profile, so my hypothesis's Occam score has improved by a unit of one epicycle.
"you are ascribing too much certainty and reliability to your conclusions."
I've been thinking about this general issue of you and others who are claiming there is more uncertainty in the overall situation than I perceive there to be (not that I perceive there to be none). I think there are two things such people might be saying.
One is "I can't follow how you get to your conclusion" which is essentially a plea to have the chain of logic explained more clearly and in more detail. Fair enough - I may or may not have time and energy, but at least it's a perfectly reasonable request. Let me call this a "weak claim of uncertainty."
But the other claim someone might be making, and I suspect that you are making this claim, is "Objectively, the data do not support your hypothesis. I understand your reasoning perfectly, but the data do not support your inferences." I will call this a "strong claim of uncertainty", because it is actually a very strong statement in the following sense. For the data not to support my hypothesis, what that must necessarily imply is that there are some non-trivial number of alternative hypothesis which would explain the data at least as well as my hypothesis, but be different in more than minor ways (ie they would have materially different implications for the rest of the overall situation - in this case future Saudi oil production).
That's why I responded as I did yesterday. If you believe this - that there are a number of equally good hypotheses - then I disagree. But if you indeed believe it in good faith, then my challenge is: exhibit such a hypothesis. From the presumably large universe of good hypotheses that your strong uncertainty claim implies must exist, pick your favorite.
Because if you won't do that, then you are making a claim of strong uncertainty without providing any evidence at all for that claim - in short, your words are empty. In order to back-up such a claim of uncertainty, you need to provide some kind of existence proof for these numerous good hypotheses that would explain the data we have as well as mine.
Of course, once you do settle on one, I will set to to find it's defects and compare it's quality to mine. Ånd no doubt we will all learn something thereby. I suspect you'll struggle to find a better.
But if you aren't willing to make the effort to do that, then what's the point in making these kinds of unsubstantiated claims? And if you haven't studied the data enough, and you don't have ready to hand a number of hypotheses that you can see clearly explain that data as well, then how do you know that there is as much uncertainty as you say?
1) You should either be a professor, or an internet energy blogger.
2) Your style reminds me of someone else....hmmm. perhaps you have picked up Mr Rapiers debating skills through osmosis.
3) I emailed Matt Simmons and invited him to post his thoughts on your findings. His reply (truncated)-"Fabulous work....when I have sufficient time, I will make some observations. TOD "detectives" are fast on the heels of the decline of Saudi Arabia's Giant Oil fields. Left is lots of oil but in rocks that will never flow like what the world assumed would last forever."
great work SS - I dont expect that the average reader knows how much effort goes into your graphics intensive posts...
Nate...so far as SS, I think the average reader knows when Michael Jordon steps on the court.
As an avid reader of this and all other threads/topics I believe that I can understand just how much SS has contributed to the huge amount of work and analysis expended here.
I am extremely grateful for his commitment to the effort. I and others I am sure, are making huge decisions that directly affect our future lifes and lifestyles so it is imperative that we understand as well as we possibly can what the future does hold.
I note that on the home page under that main banner is this statement:DISCUSSIONS ABOUT ENERGY AND OUR FUTURE.
I would note OUR FUTURE.
Airdale(me) is assuredly a fast crash doomer and the reason is that I have seen far too many events in my life to think otherwise and to NOT PREPARE for 'our future'.The crisis in 1973 goes on the chalk board of my mind each time I think of the outcome.
So I applaud the efforts and am diligently , most diligently for any clues that we will NOT have a crisis with the ensuing societal collapse. NOT! Repeat NOT!.
Thanks much. Best regards to all who toil hard at this end game.
Airdale-a doomer who prays earnestly for the opposite
As a fellow doomer who earnestly prays for the rabbit to pop out of a lot of energy hats...here is to looking at reality,ugly 'hoe that she is...
My hat is off to SS,FF,and all those who do have a clue here at TOD. Because of their hard work,I have a pretty good idea what "reality" is now.
To reveiw...looks like things are fine...for awhile.Then it gets interesting.
Halfin delights in splitting hairs, debating how many angels dance on the head of a pin.
Prediction: Halfin will not present any alternative theories because that would require that he commit to some idea, something that Halfin seems wholly incapable of doing.
Ghawar Is Dying
The greatest shortcoming of the human race is our inability to understand the exponential function. - Dr. Albert Bartlett
I don't comment here often because i have very little to add to the debate.
Inconsistency and uncertainty are not logically equivalent. A claim of inconsistency is indeed a strong statement as this is a claim of falsehood. A claim of uncertainty in conclusions when said conclusions were infered from uncertain data is tautological. It would seem the entirety of Halfin's claim is that your estimation of uncertainty is too optimistic. I think the issue arises simply from the perception that "removes all conceivable doubt" is an assignment of zero uncertainty. Halfin is just playing the part of the fastidious scientist.
All science is inductive, not deductive. We can never prove anything beyond all conceivable doubt (hence my admission below that my wording was a little incautious in my excitement). Our only confidence that the sun will rise tomorrow is that it has risen on many occasions in the past, and so we have built models, formal or informal, of the sun's behavior which explain this past data, and we have come to trust those models enough that we are willing to extrapolate them forward, and say it is very likely the sun will rise again tomorrow.
Thus any scientific exercise is fundamentally about building theories, models, narratives, which explain the existing data, and have falsifiable implications for not yet observed data. A model is never really true or false, it just does a better or worse job of explaining and predicting data. Since, in practice, any theory has odd inconsistencies and bits of data that are problematic to the theory, the test of a theory is really its ability to do a better job than competing theories.
My claim is that the theory "Saudi Arabian oil production has been declining in large measure involuntarily" explains the evidence better than other theories (I of course reserve the right to flesh that out and make adjustments in the details as new evidence emerges). I have had very high confidence in this theory for some time.
Now Halfin may have less confidence in his own views. But for him to support a positive allegation that my confidence in my theory is misplaced, which is what I understand him to be alleging, he needs to exhibit an alternative and compelling theory and show why it explains the data equally well. Since he isn't willing to even attempt that, he hasn't offered good evidence for his general contention that I am overconfident in my views. Until he does advance a hypothesis, his accusation appears to me baseless.
It is always an encouraging sign of true quality to see someone understand Hume's (http://en.wikipedia.org/wiki/David_Hume) 'An Enquiry Concerning Human Understanding' (plain text link at http://www.gutenberg.org/dirs/etext06/8echu10.txt).
The future is defined by uncertainty, to the same extent you base everything on rigorously empirical data, which is by definition forever in the unchanging past, not the unknown future.
And the real discussion begins after this point is understood. As an objection, it is without value except to prove, with empirical accuracy, certainty is not possible in any human endeavour where the future is considered.
Hume's logic is impeccable, including the implicit recognition of its own flaws.
And to stay concise,everyone will be spared links to Kant 'awakening from his dogmatic slumber.' (Or worse, links to the German original.)
Dealing with reality is difficult enough. Though it seems through the hard work of several outstanding individuals, we are all getting closer to it in one fairly bounded discussion.
Stuart, the evidence I presented for my claim that "you are ascribing too much certainty and reliability to your conclusions" is that yesterday, you said that your proposed positioning was "blindingly obvious" and that your analysis "removes all conceivable doubt" about a location which you now see as incorrect.
Yesterday, I suggested that it did not remove all conceivable doubt. I said, "Again, I'm not saying your location is wrong, just that the degree of certainty you have expressed is far from appropriate given the quality of the data."
Today, you have changed your mind about the location. Clearly, your analysis did not remove all conceivable doubt, since you yourself now doubt the accuracy of yesterday's conclusion.
It is true that in today's article you have changed your tone quite a bit. In fact reading your article closely you couch most of your claims and arguments in qualifications and caveats. I count 2 probables, 3 mights, 5 likelies. OTOH you also claim to be driving your points home with a mallet and a pile driver. It still seems that there is something of a disconnect between a lengthy chain of inference based on extremely limited data, and the emotional certainty with which you hold your conclusions.
I will agree I was a little excited and incautious in my initial wording when I very first discovered the new topography picture, which seemed to me (and still seems to me) to considerably strengthen the evidence for my views. However, I have been highly confident of my outline conclusions for quite some time, hence my willingness to bet on them, and then to double the stakes of that bet. To date, after a month, no-one has been willling to accept that bet.
Since you are unwilling to advance any alternative hypothesis, I incline to the view that your corresponding lack of confidence in your own views is due to your ignorance or inability to interpret the evidence, rather than to the fact that the evidence supports a diverse collection of explanatory hypotheses equally well. If you wish to differ, by all means go ahead and offer a hypothesis.
I agree and admit that I am ignorant and unable to interpret this evidence with the degree of scrutiny that would be necessary to come to any strong conclusions. I am a cryptographer, not a geologist. I would like to see you show it to professional petroleum geologists, ideally ones who were not previously convinced by Peak Oil arguments, and also who are willing to have their names used publicly, and get their endorsements. If most qualified professionals find your argument convincing, that would go a long way towards convincing me (although by that point my amateur endorsement would of course be entirely superfluous).
I have serious doubts about your basic methodology of looking at things in extreme detail, for example dividing Saudi production since early 04 into no fewer than nine segments and guessing exactly what the Saudis were trying to do in each one, and then gathering data from sources that were never intended to be used for this purpose like some of the graphics in this article, trying to put all this extremely low quality data together to reach a high quality conclusion. This is reflected in the current article where as I pointed out you put forth a number of caveats and hedges as you march through your argument but then in the end you seem completely convinced anyway.
As a general rule, in my understanding of the relevant literature, this kind of methodology is not successful in predicting the future. Businesses that try to develop extremely elaborate and detailed scenarios for their planning models do not do as well as those that use broader and more general methods. The world is an uncertain place and it is difficult for us to anticipate the full range of variation in possible outcomes. Your drive towards specificity and certainty is in many cases associated with poor accuracy. Experts who present modest conclusions and openly discuss their uncertainty tend to be more successful predictors than those who are extremely confident and specific in their forecasts. In fact, overconfidence is one of the most universal human failings; in one study, people asked to make estimates with 98% confidence intervals were found to be in error 40% of the time.
I would be inclined to take you up on some sort of bet, but it seems to me that since you are the one professing certainty whereas I am the one who argues that things are unclear, you ought to offer more favorable odds, or a stronger claim than that KSA will fail to increase production by 25%.
[Psssst, Halfin. Take in the broader context. SS and FF are trying scare more data out of KSA. That's the real drama. Let's applaud them. It may just work.]
It's comforting to know that even someone as intellectually disciplined as you are gets a little excited and incautious in his wording from time to time.
Stuart,
I've been reading TOD for a while now; the last few days events have finally convinced me to post. Probably foolish, but what the hey.
I admire the level of discussion that you, FF, Euan et al. have managed - it is a healthy, productive discussion. If I have a complaint it is that people are giving the sceptics too hard of a time; we need critical thinking here, which means subjecting every claim to tough testing. To the extent that people question things like the placement of those cross-sections, I think they make very valuable contributions.
Now, for my own contribution, which is simply to question the basis for all of your conclusions. As far as I understand (and that is, I'm sure, not very far) your conlusions come from a pair of SPE publications. Now, I have worked for large technical/scientific organizations, and I can tell you that they rarely let you publish so much as the coffee club list without extensive document review. Do you really think KSA/Aramco would "inadvertently" let slip this kind of information? Especially information with potentially kingdom-ending implications? It's not like the internal reviewers would miss the importance of a figure showing a reservoir model of Ghawar - they would want to make sure it didn't say something they didn't want it to say.
If it was inadvertent (e.g. that the linux-cluster paper was checked/approved by a computer guy and not a reservoir engineer), it might be informative to find out what the authors are doing now. Deputy lead of wastewater management in the Empty Quarter? Heck, has anyone tried contacting the authors?
Or, what about a more prosaic explaination: that the simulation showed the predicted state of the reservoir at some unknown future date, and not 2004? Perhaps it was predicting watering out in 2009 and that's what preciptated the recent drilling? Granted, I'm speculating here -- I'm hardly in a position to do any better -- but I want to stimulate some critical thinking.
The response to questions has sometimes been along the lines of: "if you dont believe me, come up with something better!". With respect, that may not be the best approach. Not everyone has the knowledge, time or energy to come up with the grand posts that you do - but they may still have valuable insights into particular aspects of the problem. (An example from scientific peer review: the reviewer is expected to ask tough questions, not produce his own paper as a rebuttal).
I will say that I agree that this is likely one of the most critically important issues we face in the near term; I have parents who lived through the great Depression, and we could be looking at something like that in the next few years (or worse). I would urge everyone to treat this as seriously as possible, which means the usual flame wars etc need to take a back seat to real discussion. Again, I applaud Stuart, Euan, garyp et al for their efforts in this direction.
Finally, would it be possible for some of you to sit down and come up with a post that summarizes what has been concluded, on what basis, and at what level of uncertainty?
A review....
Hello Raybender!
The first step to being smart is to revel in looking foolish. You can get away with murder, plus when you say something you get more credit if they underestimate you.
I've also worked in large scale S&T organisations and I know just how much use most review activities are. Firstly, to get good illustrative data to backup your case you almost have to use real data somehow. Faked data doesn't look right and takes effort as well. Better to file the serial numbers of the data you have lying around.
Second, people for ever underestimating the ability of smart people to join the dots. Its easy to think the critical piece of information isn't there (ie where the cross sections are of), but its often just as easy to take a few constraints and make knowledge of out disconnected data. Take a look at the top of this thread to see where I took results in two different papers, correlated them and got more info out. Its like a crossword puzzle, or not a little like doing basic research in the first place.
And finally, with regard to SA not letting a paper out that said what they didn't want to have heard? Well isn't that what the papers ARE saying? If they were going to fix the numbers, at least fix them in more commercially acceptable directions.
If they are fiddling the figures to make themselves look good to the outside world, they're doing a bad job!
Your argument would be valid if we were talking about the National Institutes of Highway Safety, or some other, similarly low-priority issue. But we're talking about "the worlds largest asset"; the strategic importance of accurate information about Ghawar is hard to overstate. I would expect that every intelligence service in the world has dedicated geologists looking into this (remember Deffeyes' story about the early 70's and the CIA asking him to report on the Chinese oil fields?). The first place intelligence is usually collected is in the open literature; I'd just love to know how many subscriptions to SPE are sent to Langley, VA., or Dzersinsky [sp?] square for that matter.
(the Russians know the strategic importance of oil -- Putin will not have forgotten how the Saudis screwed them in the 80s).
The Saudis have to know this - there is no chance they would let something like this slip through, essentially telling the world the exact state of their reservoirs. That would have to be among the all-time greatest intelligence blunders ever.
Ask yourself this - does KSA have any incentive to have large numbers of outsiders think they are running out of oil?
This is a straw man argument. Your making a assumption then assuming its true.
First Aramco is not bullet proof against the CIA or any other intelligence agency its a very large company. So limiting the literature to protect themselves from government agencies is senseless. You have to prove beyond a shadow of a doubt that a company wants to do this. These agencies have a huge number of ways to gain access to any information they want not to mention satellite data.
You would need extraordinary evidence to even consider that this could be true.
We have every reason to believe that plenty of people inside our governments know the true state of the oil industry. If they are being listened too is a different matter.
Next the papers do show reasonable caution at protecting sensitive data it only by correlation that you get answers.
And finally if public papers are such a treasure trove and your right they are we can easily preform the same analysis the CIA can.
And finally they spilled the beans already to Simmons and thought nothing of it its only afterwards that they got busy telling us the water cut is under control. A organization that was bullet proof against the CIA would have never let Simmons in in the first place.
You're basically saying that ARAMCO thinks: "we can't keep a secret against the worlds best spies, so let's just publish it in the open literature". I don't think that is good logic - and it certainly isnt applied elsewhere (Los Alamos doesn't say "gee, the Chinese managed to steal the designs for the W88, so let's just publish them." (That'd make for one cool , and probably highly cited, paper. :P)
No, they are going to make it as hard as possible to steal information on the state of their reserves - for economic reasons (so they can game the futures markets), political ones (so they can game OPEC quotas) and strategic ones (so they can hose Iran, and back in the day, the Soviet Union).
They aren't voluntarily going to give away information that valuable. Isn't that obvious? After all, if they really wanted transparency they could easily publish real, verifiable information (with real scale bars and GPS coordinates!), and invite experts to come take a look at the fields. They are probably resigned to the fact that the FSB knows the truth - but they don't want some random dudes on the internet to be able to know their reserve levels.
Which leaves us with a few possible conclusions:
1) They screwed up and released stuff without realizing how valuable it was.
2) They are deliberately releasing mis-information.
Now, there is always the maxim "never attribute to malice what can be explained by incompetence", and the Saudis didn't exactly earn Ghawar by virtue of being competent.
But whoever among them has survived in that environment for this long has to be a fairly savvy character, so I
wouldn't put #2 past them.
On the other hand, this paper is from a few years ago; right around the time Matthew Simmons was doing his thing. Maybe they really didn't realize people were looking that carefully. I just don't know - and I find it hard to believe that anyone on this board can be certain one way or the other.
I would summarize my argument this way: remember that the source of all our data is coming through the hands of the Saudis, who have a vested interest in obscuring the truth. So be very, very, very careful with your conclusions. We should be trying to seek alternate sources of information.
Too bad Google GravityMaps isn't even beta yet.
By the way, you mentioned satellites; what kind of information on oil fields can you get from satellites? gravity map data or something? Is there anyone here who could work that angle?
Perhaps, but correlations can be misleading. First, let me make sure I'm following Stuart et al's. latest ideas. I know Stuart has looked at more than 40 papers, but right now, the most recent conclusions regarding N. Ain Dar come from just a few figures: 1) the x-section from the "flanks" showing that the area in question is essentially watered out. 2) A relief map. My understanding is that the bulk of his argument rests on the observation/claim that the only possible location of the x-section is in fact near the top of Ain Dar; the implication being that the entre field is watered out. Stuart, is this a correct summary?
If it is, then I'd say that isn't such a big stretch that you wouldn't expect an ARAMCO reviewer to be able to see the possibilities of releasing these two pieces of information.
Now you take your strawman to the opposite extreme.
memmel:
First, I have a couple of formatting-related responses for you. Please take them as constructive criticism:
1) Learn to use "blockquote"s properly, and most importantly to close them (with a backslash-blockquote).
2) There is a preview button. Using it helps you avoid serious formatting issues that make posts hard to read.
3) I would suggest not posting when you are sleep-deprived. Your post seems very, perhaps even unusually, oriented toward personal attacks. Some examples:
I will honestly say that my posts are intended as serious contributions to the discussion, and I endeavour to be clear, calm and logical. It may often be the case that my arguments can be shown to have flaws; but I believe I have a sufficient grasp of logic and critical thinking to participate in this discussion.
Now for the more substantive part of the discussion.
My principal point has been and remains that all of these recent conclusions on 'Ain Dar and the rest of Ghawar are based on small number of plots from a small number of publications out of Aramco. I maintain that that is a relatively unreliable source of information; as I have attempted to show, there are many reasons why the Saudis would be motivated to fabricate data, or outright lie.
(I doubt I will find many on this board who believe in the honesty of the Saudis.)
Stuart et al. are saying that the information was inadvertently leaked. Stuart does make a good point based on his experience with computer security and the asymmetry of effort between the "attacker" and "defender" (i.e. us and the Aramco document reviewers). I recognize the point, but am still unconvinced. To my mind the financial and strategic interests are too strong for the Saudis to make such relatively amateurish mistakes.
There are still a few straightforward possibilities that haven't been ruled out: 1) that the cross-section shown is not for 2004 (does it say it is somewhere that I missed?).
I do recall seing a date of 2032 in certain other papers that have been linked to in the board. I think that was for UTMH, though. Nonetheless, they are clearly running simulations into the future, so that cross section could be from such a run.
2) That the location of the cross-section is wrong, despite the best efforts of the photo-shop users here on the board.
3) And above all, that they are simply lying.
You ask: why would Aramco publish at all? Good question - were I them I sure wouldn't. You say as a resume-building effort; were I the head of Aramco I wouldn't let me people risk disclosing issues of such fundamental importance for a mere resume. I'd pay them more if they complained. Besides, people need resumes when they are moving to other jobs; I wouldn't want my people leaving with their information. Were I a personnel manager for Saudi Aramco, I would consider a job there as a job for life (maybe even like the mob). But that's just me - I can't speak for them.
Why would they publish information that can be interpreted to imply that they have seriously overstated their reserves? There are only a few possible reasons (adding to my previous list):
1) They didn't realize that is what the paper would imply.
2) They are lying or spreading misinformation.
3) They screwed up and it was inadvertent.
We've covered 2 & 3 in previous posts. 1 is new and suggested by someone else on this board. To be fair, you can hardly expect them to anticipate every wacky interpretation that random dudes in the internet are going to come up with. We could be so far off base that they are laughing at us right now, who knows? (Aramco does, probably.) I certainly don't, and I am trying to caution you that you probably don't either.
1) People believe their own bs sometimes. Its genetic. Its quite possible that CERA, IEA, KSA and others, have their own interpretations of this data. Remember, it wasnt too long ago that EIA based their production forecasts on the amount needed to meet demand-this was not really disputed generally until the last few years.
2) If KSA really does believe and understand the implications discussed in this forum, then I agree with you there would be a reason for the 'leak'. Possible incentives could be:
a) making sure they have some other countries military support once production and revenues decline. b) requiring higher prices on what oil IS remaining so as to invest in infrastructure. c)internal soap opera games within Saudi family d)leaking incorrect data to give Peak Oilers reason to doubt then quashing all doubt in 3 years by producing 12mbpd therefore shutting us all up for a good decade.
This line of argument is interesting, but I'm not sure it leads where you think. If we assume that the Saudi's are motivated to avoid revealing the depleted state of their oil fields, and that they are rigorously reviewing all the SPE papers to avoid letting slip anything they shouldn't, then what are we to make of the 'Ain Dar cross sections? Why publish empty looking cross sections if there were juicy oil filled ones to publish? Or if they must publish empty looking ones from the outer edges of the reservoir, wouldn't it be better to make it clear they were doing that? Doesn't that suggest that those cross-sections were actually the best possible ones?
I'm not sure we should push this kind of argument too far, however.
In my own field of computer security, a very common mistake that untrained people make in thinking about security risks is underestimating the level of effort that hackers will go to to break into a system. Good hackers will obsess for night and day for literally weeks while trying to figure out a single vulnerability in a piece of code. Meanwhile, the programmers who put the problem there casually made a lazy short-cut or two while figuring "Ah, no-one will ever realize this problem is buried here."
I'm inclined to suspect that we have that kind of situation here. Many of these SPE papers have indications of haste in their preparation (unclear labels on graphs, bad font choices, etc, etc). Possibly the authors saw their main job as getting oil out of the ground, and publishing papers was a spare time resume-building or boss-pleasing activity. They probably weren't thinking nearly as carefully as you might assume about how many bits of information they were leaking. Likewise, the reviewers were likely busy managers with many important projects to co-ordinate in the company's real job: producing oil. They probably were particularly unaware of the possible results of a sustained effort to correlate the information across many sources.
That's one possible situation, but there are others: what if the Saudis really do have 30 more years of easy oil, but have decided for various reasons that they would prefer the world pay $60-$80 a barrel? Have some sympathy -- keeping a harem of the finest blondes is expensive. They can't just raise prices without risking us bombing them, so instead just start a whisper campaign and let the market handle it for you.
Look, Stuart, you're doing some really nice work. But I know from personal experience how easy it is to get seduced by a beautiful (but flawed) idea, so I am trying to keep you honest. Your conclusions will be stronger for having been tested - you know that as well as I do.
That being said, what I am thinking is that we need another angle. I wish I could get my hands on a sample of two of Arab light from this past year, and compare it with stuff from 10 years ago. Or with stuff out of Basra, for that matter.
Hi Ray,
re: "Ask yourself this - does KSA have any incentive to have large numbers of outsiders think they are running out of oil?"
Salve for the conscience?
The proper paranoia is perhaps not KSA hiding information but somebody feeding TOD falsified scary information to place the peak too early in time. Overstating the problem with a few years might make sense for some as a market manipulation or less selfish for producing panic to get things started in time before the real peak.
I don't think we are barely on their radar Simmons stung them a bit with his book and his position but I seriously doubt that we are a problem for them. I think for them we are little better than a fringe group of nuts.
Next as far as their concerned I'm sure the US government has good information on the state of the oil supplies in most if not all of the oil producing countries. Our governments could easily disclose the truth of the matter. I don't think the state of KSA oil reserves is a big secret except to the unwashed masses. Simmons made enough noise that I can't imagine that the US has not fully evaluated the situation.
If we are even reasonably close the real situation I'm concerned that either our governments are so incompetent that they pay no attention to issues vital to our energy security or they know and are not telling. Either answer is extremely troubling.
In any case the problem is not KSA or their secrecy the problem lies with the democratic elected governments of the world regardless of what they know or don't know the current situation does not bode well for the future.
Hi m,
Well-stated.
re: "If we are even reasonably close the real situation I'm concerned that either our governments are so incompetent that they pay no attention to issues vital to our energy security or they know and are not telling. Either answer is extremely troubling."
I didn't mean to imply the problem is with KSA, per se. More that... any one individual (whether within the US gov, or within any gov, for that matter)...who has a grasp of the big picture has to have a problem, perhaps even a conflict. "Who do I tell? What do I do?"
As Aleklett famously stated, those who know and do not tell are like people who knew about the Indonesian tsunami and failed to warn people in the path.
In this regard, I would imagine people would also like to see their actions (whatever they may be) as positive, even if questionable. (I bet we've all experienced some of this in one way or another here?)
My take on it is that some people do know, and other do not. Still others know parts and may not be able to accept it emotionally, thus the motivation to connect the dots is lacking. (My guess is the majority fall in this category.)
We know Cheney knows. http://www.energybulletin.net/559.html. At least, we know he's talked and acted like he knows (without being able to get inside his head in terms of how he processes this).
Yet another possibility along these lines is: someone may see "resource grabbing" as a form of BAU, and not understand we are facing the prospect of a collapse of the whole.
I will add the objection that at some point, the scale is beyond control - any organization involving such massive numbers of people, information, technology, and wealth is impossible to keep contained within its intended boundaries, since reality is not a matter of memos and guidelines.
This discussion has been an attempt to discover what is happening, and it uses whatever facts are found, from whatever source - after all, only one geologically correct answer exists in terms of that subsurface part of the Saudi desert, both for the people responsible for producing oil there and for anyone else interested in that geology.
Peak oil is about reality, which is one reason it appeals to me so much. It may also be why so many other people dismiss it, especially those who consistently expect it to happen later, as now would be inconvenient.
The response to questions has sometimes been along the lines of: "if you dont believe me, come up with something better!". With respect, that may not be the best approach. Not everyone has the knowledge, time or energy to come up with the grand posts that you do - but they may still have valuable insights into particular aspects of the problem. (An example from scientific peer review: the reviewer is expected to ask tough questions, not produce his own paper as a rebuttal).
I completely agree that asking tough questions is helpful and I certainly hope I haven't discouraged anyone from doing that. But there's a big difference between saying "I don't understand how you get from step 8 to step 9, please justify it better", or "I don't believe your story on point A, because of XYZ reasons", and "This entire effort is inadequately reasoned and the data do not support the conclusions". The latter is a much stronger statement, and the only way to be in a position to make it is to have studied the data to the point where one understands the constraints on the hypothesis space. This is exactly the distinction I was trying to draw in my first response to Halfin.
"As far as I understand (and that is, I'm sure, not very far) your conlusions come from a pair of SPE publications."
No. I have read thirty or forty references at this point, and have been following the reserves, production, stock, rig count etc data for a couple of years. If you just read the stories listed at the top of the page, you'll see that I'm drawing from a lot more than those two papers.
Which is not to say that I'm not learning a great deal from this ongoing conversation.
My comment has nothing to do with your work on PO, which has been exceptional, but merely on your claims of strong and weak uncertainty. As a somebody with a strong foundation in the theory of knowledge that is a bit more in my realm of expertise.
I think you are mistaken to interprete these arguments as you have described them. *disclaimer - much of this sort of debate is likely "reasonable disagreement" which flows from two people sharing the same data and having slightly different internalizations of that data. This is to say that both people are using the same words/data, and both are using sound logical methods. The problem lies in their first assumptions which stem from their basic understanding of the initial premises/data, which are based in a type of a priori knowledge that sometimes cannot be shared between people in words or text. As a result both people can go through the same logical process, validly, and still come to different conclusions*
Your use of weak (un)certainty is fine, and some of the less technically advanced are likely using such a claim. You might want to call that a claim of weak understanding though.
I take an issue with your second characterization. Implicit in your description of the strong claim of uncertainty is that your cliam's certainty relies in some manner on the quality or availability of alternative claims/theories. This simply is not the case though.
The presence of competing claims goes to establish the "quality" of your claim in the sense that it is or is not the best available claim, or the the best theory that we have at the moment.
The strength of a claim to certainty is based upon the reliability or accuracy of the data that you have used to produce your theory. If the data you are using is less than certain and/or less than complete, then you would have a weak claim to certainty despite the fact that your logical reasoning is PERFECT.
The people claiming that you should not be acribing so much certainty to your arguments do so because they lack faith in the sources, not the reasoning or logic. They are not saying the the conclusion does not follow from the premises, nor are they saying that there are better theories out there given the current data. They are saying that the data is weak and that that better explanations probably exist. The problem is that we need a lot more information to come up with those theories, and that we need a lot more information to ascribe anything close to "certaininty" to any theory regardless of its soundness.
You have a sound theory, and it is in my opinion, the best available theory. I don't believe that the data sources are all that great though. KSA is very secretive, we don't know exactly what section of the field we are viewing a cross-section of, we don't know exactly how this shape has been manipulated for presentation purposes, we don't have good scaling for the image, and we are using images for purposes other than they were originally intended. Not to mention that this information provides us with much less than a complete picture of these fields. This all amounts to something less than a claim to certainty.
I think you have a great working theory, that logically speaking, is very sound. We need a lot more KSA data, that can be independantly verified to come up with theories that we can ascribe certainty though.
As far as your positions about "world peak", I think you have a much stronger claim to certainty, given our data about other fields around the world.
What he said. :)
Speculation: Fractional_Flow is Professor Deffeyes.
Compare writing style in the books and on his website against that of Fractional_Flow here. Note personal info where it slips through would suggest a match.
Thoughts?
Ghawar Is Dying
The greatest shortcoming of the human race is our inability to understand the exponential function. - Dr. Albert Bartlett
You could be right. In my dealings with Prof Deffeyes when he spoke at the Peak Oil and Environment conference last year, his telling trademark in all of our interaction was humor, even when I irritated him. I personally think the guy is so smart that he uses humor just to keep from being bored.
Whatever.
The audience is awed, on its feet, applauding.
Bravo. SS, f_f, Euan,plucky,Bob,garyp, Ron...and forgive me if I've forgotten anyone.
He isn't :-)
That's an interesting piece of information in itself, Stuart. And yes, I noted the use of humor as being very similar as Nate did. Well, whoever this is, they have provided some thought provoking material in conjunction with you, Euan, garyp and everyone else.
Ghawar Is Dying
The greatest shortcoming of the human race is our inability to understand the exponential function. - Dr. Albert Bartlett
I've read several posts where I believe some people are confusing two key concepts; Water saturation (Sw) and the water/oil ratio (WOR). When we talk about a well watering out we are really saying that the WOR is approaching 1 (100% water). It is also likely that the Sw is increasing. However, the Sw will never need to get to 100% because it will have stopped producing oil long before that point.
Each reservoir is different in regards to how high the Sw has to be before the production of oil is not possible. It is also the case (as shown in the figures provided in these posts) that the Sw will vary within the reservoir. The lower portion of a well may have an Sw = 0.6 and produce 100% water while the upper portion may have an Sw = 0.15 and produce 100% oil (hence the need to set a plug). The end result of that well may be a WOR = 0.5, if both high and low Sw areas are produced.
I haven't read the SPE papers, so I am ignorant with respect to whether the Sw values are bulk water or movable water (from these you could get to movable oil). This would be an important bit of information if you were attempting to do a volumetrics calculation on the field.
The things I mentioned have been implicitly covered in most of these posts, I just felt a late night need to say them out loud.
Thanks face-
Send that one to Rockdoc over at the Peakoil website.
He is the Saudi expert there that doesn't understand the difference between water saturation and water cut.
The difference is my username, that is why I chose i :)
FF
The 10% Case, Cumulative Outliers
First of all, KUDOS All around ! This is the BEST analysis process I have seen in my life !
I would like to make a data analysis case, using cumulative outlier information. I have read all and am still digesting (I will need to reread).
Cumulative outlier analysis is valid when the # involved is large (GM auto production; how often does a 99% percentile large crankshaft get placed on a 1% or 99% percentile bearing).
However, it has the opposite effect when the # are small (1 to 3 in this case). In a single case, it is exceedingly unlikely that a string of outliers with a single bias will be selected sequentially. Each data point supporting the alternative hypothesis may have a reasonable probability. Say, 10%, 20%, 5% and 33%. But the odds of 4 selections all sharing the same bias are quite small (0.033% in the illustration).
The quality of the data that Stuart uses is not good, and each of his interpretations is subject to a valid challenge. IMHO, SS did pick the "most likely" interpretation in each case but alternative interpretations for each data point are quite reasonable.
A rough guess is that Stuart made the wrong guess (but not materially/dramatically wrong) in at least one selection, perhaps two (in the illustration, the chances of picking zero of the four with the bias is 46%, picking 4 of 4 is 0.033%). This will create an error bar around his conclusions. IMVHO, not a very large error bar.
Any alternative hypothesis that comes to a materially different conclusion will require (IMVVHO) a series of "less likely but still credible" interpretations of the same data. However, the probability of such outliers, all with the same bias, all being true is quite small.
May I suggest that those that are struggling to digest this significant work and search for the truth use this technique, however roughly.
Best Hopes for All Involved :-)
Alan
Hi everyone,
The recent flurry of graphics intensive posts and related discussion has made my brain melt!
A plea: Once the smoke clears could some kind person post a very brief summary in relatively plain English on the final conclusions of all this work.
Many thanks.
Well, well, quite the little discussion! My eyes are sore from reading, and I am past due on my reports at work because I have spent time on the computer studying complicated models of Ghawar instead of dealing with the mundane reportage required by my job. :-)
I would skip over the repetitive congrats and thank you to the TOD heavy hitters if I could, simply to save word count, but I can’t bring myself to skip it, having been awed in the last few days by a quantity and quality of data that is rare in this bumper sticker world, enough to create an excellent small book that could act as a reference guide on Ghawar in particular and oil field modeling in general. I have not jumped into the hunt on this string, because I am not in any way knowledgeable about the subject of oil geology or computer modeling of oil fields. These are detail oriented undertakings, and I am not a detail oriented person, being more of a big picture type. I am interested in context and inference reading. So, to that end, a few comments:
I once said, after having read many of his posts, that I would take Stuart Staniford’s numbers over the thin conjecture of EIA, IEA, CERA and USGS combined, and I have to stick to that. Given Stuart’s work, even a well read layman would have to admit that Ghawar’s ability to hold steady output is in serious question, and it’s ability to deliver even higher output in extreme doubt. When combined with the work of Simmons in “Twilight In The Desert” smf others, the evidence is starting to lean toward a Ghawar field on it’s last leg. Where does that leave us?
We must of course remember that we are talking about a huge field and vast quantities of oil. Ghawar, like an elephant that has been shot, could run a mile or more on sheer momentum. Thus, timing the downtown and the “backside” decline is difficult. Even a miscalculation due to lack of data could move the peak and then decline points by years, and change the slope of the downside a great deal. But, even if we factor in some pretty sizable errors, most of the evidence and consensus here seems to put us within a half decade of terminal decline. That, as we know, is no time at all in the oil business.
If we accept Ghawar as declining within 4 to 5 years (not unreasonable given the evidence discussed, it could already be turning down), we move from accepting this conclusion to the next stage of conjecture:
Does the peak and following decline of Ghawar assure the peak and decline of Saudi Arabian oil production? I know that the consensus here is yes, of course, how else could it be? But we do know there are detractors out there (they just don’t post here!). Michael Lynch (hated name, I know, and he may well be wrong, but he is not stupid) makes the argument that in many countries, the U.S. included, that the bulk of total production comes from the second tier fields and from “reserve growth”. Thus, Saudi Arabia may still be some point away from peak production even with a declining Ghawar, depending on the speed with which Ghawar declines. I know that is not a popular theory here, but it cannot be dismissed as a possibility.
If we stay with the assumption that Ghawar is at or past decline, most bets in KSA have to be with (a) Khurais (b) The Empty Quarter, and (c) offshore. Let’s let Stuart, Fractional Flow, Euan, Bob, garyp, Ron and the TOD heavy hitters get some rest, and then do us this type of deep detective work on those three areas next! :-)
What we do not know is how much these areas can provide in making up for Ghawar’s slide. What we do know is that it will not be in any way as cheap or easy for KSA to pull oil out of these areas as it was to pull oil out of Ghawar in the early days. Equipment, staffing and capital are huge issues, and KSA seems to be determined to train the people, invest the money and keep attempting to grow. We have to assume that money will have to come from the oil buyers, and the gasoline gulpers at the pump.
The cost, according to Matthew Simmons, Total’s Christophe de Margerie and others, will be in the hundreds of billions and even trillions of dollars worldwide.
Outside of OPEC, the options are thinner, but there are some, mostly in the ocean: Offshore Africa, offshore South America, and possibly some other finds in the Gulf of Mexico. The Arctic region, and some heavy E&P work in Canada could net results. How much? There is simply no way to know. Again, costs will be high. Saudi Arabia, whether voluntarily or by force of nature, in allowing oil prices to go as high as we have seen are flushing up the possible competitors. If they are there, we should soon see them. Then KSA will know much more about who they have to deal with. If the oil is out there in the world, one can bet that KSA wants to know about it.
If Ghawar is peaked, and Saudi Arabia is peaked and declining or at least, unable to increase production, the craze for ethanol will go from just plain crazy to wild and crazy. The strain on natural gas prices will become incredible, as natural gas is used in ethanol production, tar sand production, and can be used directly as a transportation fuel if need be. Propane and natural gas will become the next “fuel switching operation” and could drive natural gas demand past the breaking point. This should not be ignored in future planning. What was a crude oil price crisis then becomes a combined and interrelated natural gas/crude oil/propane crisis, with implications for home heating, agriculture and industrial fuel price /demand/supply.
On the other hand is the demand side, but there is simply no evidence of a huge demand decline (at least in the developed and wealthy nations) unless prices rise by a substantial amount and fast. Right now, oil is still cheap as a percent of disposable income. But if prices jump fast, and by a large margin, demand can drop astoundingly fast. We saw it in the 1970’s.
On the demand issue, unlike many on TOD, I agree with Stuart’s contention that the place to start is the vehicle fleet mileage. This made a huge difference in the 1970’s and ‘80’s, and drop in demand can happen faster than some people imagine. The crisis of Ghawar is essentially a liquid fuel for transportation crisis above anything else, and it follows that the transportation sector is where to make the gains. It is not realistic to believe that people will stop driving and that all trucks will leave the highway. But increasing the efficiency of the ones on the road is so long overdue it is almost an act of criminal negligence on the part of all Americans not to have done it years ago. I currently drive a Diesel that gets about 30 miles per gallon. I could do better with effort, but even at that consumption, I am almost a third better than the fleet average (!), and this is with a 25 year old car!
The other fast ways to decrease liquid fuel consumption: Trains and barges. It is incredible to see extremely heavy freight such as rock and steel being hauled long distance by truck!
It borders on insanity.
The big problem is that the price of gas, Diesel and oil in no way are showing the onset of a real emergency. We at TOD know that Mexican production is sliding, the North Sea is sliding, Kuwaitis giant Burgen field is sliding, and that Saudi Arabia is now becoming questionable, but oil and liquid fuel prices, when adjusted for inflation, are actually back to about where they should be. I personally would be happy with any oil price up to $80 or even $90 per barrel for the rest of my life, and these are prices far above what the EIA of our own government are projecting out to the year 2030. The price is saying “business as usual” is good enough.
But, as I have maintained often here on TOD, the price will be no warning. When the U.S. peaked in 1970, oil prices were getting near their post depression lows. The price can move almost instantly, and the emergency be upon us with almost no warning.
One more thing: Intelligence. Let’s look for ways to find out things that we perhaps are not intended to know. Stuart’s great work, along with the work of the other posters on this string have given insight that simply cannot be found in the popular media, the “officially released” documents of the government or the oil industry, or the “news perspective” and science articles we see in the press. Can we build on this? It was known just before WWI that the British archeologists and tourists had better information and intel about Britain’s enemies than the U.K. government did. Amateur networking could tell us much. Who has friends, contacts, in Saudi Arabia and the Middle East? Who knows people who have just returned from contract work in the Saudi oil fields? What other intel can we get in the public domain? Contracts for equipment can tell us much, movement of money, construction equipment being moved or purchased, etc. Can we google Earth the Ghawar area, and the offshore area of Saudi Arabia and watch it on an up to date basis?
Is there any way that we can learn more, and then live up the standard as set by TOD for the last several days (a very high standard indeed) and do our own detective work? Of course we are then free to invest on what we have learned and make a buck or two if we choose to, right? ;-)
This game is still very much afoot!
Roger Conner Jr.
Remember, we are only one cubic mile from freedom
Interesting that Warren Buffet just decided to buy into 10% of Burlington RR...perhaps a harbinger?
Buffett's Berkshire buys big Burlington stake:
Legendary investor's firm takes stake of more than 10% in railroad Burlington Northern.
http://money.cnn.com/2007/04/07/news/companies/berkshire_bni/index.htm?c...
"Interesting that Warren Buffet just decided to buy into 10% of Burlington RR...perhaps a harbinger?"
More interesting is the growth in Burlington, and my pet, CSX (in the rail and barge business, how can you beat that), but as usual, by the time the public figures it out, the big money has often been made, with both Burlington and CSX having gained some 400% or more since 9/11/01....that's interesting too.
One more interesting thing...Buffett is bying Burlington at near it's all time high....so he must think there is more left.
The direction to home American heavy infrastructure may not be a bad one though...I was thinking that a good hold portfolio might be a couple of U.S. rail and barge companies, a couple of U.S. natural gas producers, and perhaps a heavy chemical, one that is involved in seed, fertilizer, and now, an alternative energy play....Dupont....{?), if the bio butanol thing does well in the U.K......interesting times indeed.
RC
Remember, we are only one cubic mile from freedom
Yes, but keep in mind with anything involving infrastructure (trains, passenger light rail, even buses), all take a very long time to expand. In the short-term these are not going to help us much. In the long-term, most definitely but we'd better get cracking.
all take a very long time to expand
I think significant impacts can be on-line within a 5 to 6 year time frame and that is NOT "a very long time".
Build more rolling stock (and add transformers, more bicycle parking, larger parking garages/lots) to existing Urban Rail systems EVERYWHERE.
Several track addition programs are underway today for freight railroads (UP has a couple of hundred men on the Los Angeles-El Paso stretch adding a second track; just passed 50% finished). Add another 50 to 100 men to the gang and start up a second gang). And then double track El Paso-Dallas and El Paso-New Orleans after that whilst triple tracking LA-El Paso). Repeat for every Class I RR and some smaller ones. Fix specific bottlenecks (recently opened outside Kansas City, 9,000' long double track overpass for E-W trains over N-S trains. Same needed at Cajun Pass CA, outside Chicago, etc.
Improved signals are the most cost effective way to expand RR capacity; the "IT" solution. MUCH could be done in 5 to 6 years.
New Orleans could build at least 20 miles of streetcar tracks in 6 years (we build our streetcars in-house and could build for others as well).
Los Angeles MIGHT get a section of the Red Line subway open in 6 years (into UCLA ?). Certainly the Expo Light Rail Line to Santa Monica and extending the Gold Line to Azusa (add-ons to current construction projects).
DC should be able to get the Dulles extension at least finished to Tyson's Corner and MAYBE past Dulles. Also Red Line can be easily extended on old RR ROW (it just stops today @ NW terminus). Etc.
Many cities have plans waiting for funding (I have a list that might cost $130 to $160 billion, all start construction within 12 to 36 months).
Dallas could finish out it's 2015 plans in 6 years and start on it's 2030 plans, Miami might get 20 more miles of it's 103 mile Master Plan finished in 6 years (20 miles open today) and so forth.
A start on electrification could be made. 100 to 1,000 mile stretches could be finished here and there within 6 years.
Best Hopes,
Alan
Hi Alan,
Great list. I just wanted to say I hope you keep at it.
Folks - this has been one of the most rewarding sessions I've had on TOD - thanks to all who took part. I got a lot of other things to deal with so will now be leaving the debate for a few days / weeks - as Roger C said - better now to take some time to reflect and do some new data analysis. A brief summary of how I see things:
N 'Ain Dar
My understanding is that the argument for watering out here hinges on the location of the saturation profiles which are speculative. I'm not sure how to interpret what FF and PUD said about this but believe they were unwilling to say with certainty these sections go all the way to the crest (correct me if I'm wrong).
This debate, I believe is largely irrelevant in the broader scheme.
Northern Ghawar
The goal post moving data for me is the top reservoir saturation map dug up by Bob combined with the convincing data for incomplete oil columns in N UMTH dug up by Stuart, GaryP and others. This shows 120 ft or so of dry oil - over a vast area. Reserve calcualtions on this give a relatively near horizon (10 or so years) for the total depletion.
My optimistic stand point at present would be that similar dry oil columns still exist in N and S AD and in SHED. We have this from SHED in 2004:
One thing I would like to do (I'm sure others will do this too) is to play around with reserves figures based on thining oil column assumptions in these areas.
Up side potential
There is a vast area of "blue" unswept oil between northern UMTH and Haradh. This is poor quality reservoir - how poor? Is their potential here for a 3 GOSP, 100 max contact well development analagous to Haradh? It would not surprise me to hear about plans for developing this area (which includes Hawiyah) some time in the next year or two - because the Saudi larder is beginning to look rather bare.
Development of smaller fields, expansion of gas and LPG production and new discoveries.
Down side risk
The situation in 'Ain Dar and Shed is worse than I have presumed here.
Hawiyah is so crap that it cannot be economically produced.
Their other super giants are in worse shape than Ghawar.
Thanks, Euan.
So basically you've stated that northern Ghawar appears to be toast within a time frame extending from the immediate future (the next few months) to a few years out. Also, you didn't say it here but previously you mentioned talking to a friend who changed your opinion - that northern Ghawar is in such a situation as to go from high production to "lights out" suddenly when that time comes? Do you still hold to that position?
With regards to the cross section you reference above, isn't a key factor the actual width of the cross section (and length) coupled with the rate of advance of the waterfront? I guess we do not solidly know enough about these issues to then extrapolate any sort of guess, do we?
Enjoy your time away from TOD! You have earned it, sir.
Seculation follows... I think we have a very firm handle on the state of KSA production, and even if the recent declines were voluntary, they may have been necessary to avoid involuntary declines. KSA may now wish to produce at a significantly lower level and to try to push prices higher yet. As Stuart noted sometime in the last 18 months (wish I could find the comment), at least one economist who has been very right before has noted that the world can probably actually stand prices very close to $100 per barrel before real economic pain sets in. KSA may be trying to push upwards into that range and then hold it there for as long as possible. If KSA can reduce production down into the 3-4 mbpd range, which they have done before, they would then still have some "swing" production to play with the market. Or at least they might believe they have that capability. Often reality is not the issue but the perception is.
Ghawar Is Dying
The greatest shortcoming of the human race is our inability to understand the exponential function. - Dr. Albert Bartlett
"their other super giants are in worse shape than gwhawar"
That brings up Safaniya--world's biggest offshore field. Does anyone recall that Chevron was contracted to run thermal recovery tests in Khafji--the northern end of Safaniya in the nuetral zone. Why go to thermal recovery unless you need to??? Maybe safaniya may have a very long tail, like some of the san joaquin valley fields, but it sure sounds like decline to me.
Does anyone recall that...
It's good etiquette to post weblinks instead of just quoting your recollections at random. And the discipline of searching for a few minutes can make your posts more accurate and useful.
That thermal recovery program in the KSA/Kuwait Neutral Zone is in the Wafra onshore field. Thermal recovery offshore is horribly impractical, for excellent engineering reasons.
http://www.heavyoilinfo.com/newsitems/chevron-finishes-ells-river-drilling
About 6 paragraphs before the end.
Stuart
Surprising to me that your posts can become ever more addictive.
IMO, cross sections are expensive to create and maintain. If only one slice is taken, it would be far more informative for the sa to take it close to the highest spot in the reservoir and where the field is widest, ie where the section will show the maximum reservoir, not in a narrower location further north that might be useful early but will obviously have no value in later years. Further, sa is in the denial business... the section they would want to show the world would be the one showing the most remaining oil, not the least.
Evidence that much of sa recent decline is heavy oil would exclude ad/s. You made a comment that I thought indicated you have an idea which fields are already producing less... is this right? IF so, which fields?
The ad/s decline, when it comes, would therefore add to what has already happened and meanwhile looks to be rapid, with little chance imo of making up this loss from other fields.
SA has no new fields, only very old fields all developed around the same time, and most looking pretty sick and tired while the best of the rest look to be slow producers. IMO this is true throughout the middle east and Russia, too. The plateau is holding, but for how long? And do we slide off gently or precipitously? Has your view of a gentle descent changed recently?
IMO, cross sections are expensive to create and maintain
Interesting argument, but the technology has moved on. Those graphics come out of a reservoir simulation model. The model itself can be expensive to set up & maintain, but once you've got it you can generate sections wherever you want ad nauseam at negligible marginal cost. And the model pretty much has to cover the entire field.