IEA Sankey Diagrams
Posted by JoulesBurn on September 7, 2013 - 11:05pm
The International Energy Agency has taken its share of abuse from The Oil Drum over the years for its rather optimistic forecasts. But it deserves a hearty shout-out for an invaluable resource it has on its web site: Interactive Sankey Diagrams for the World.
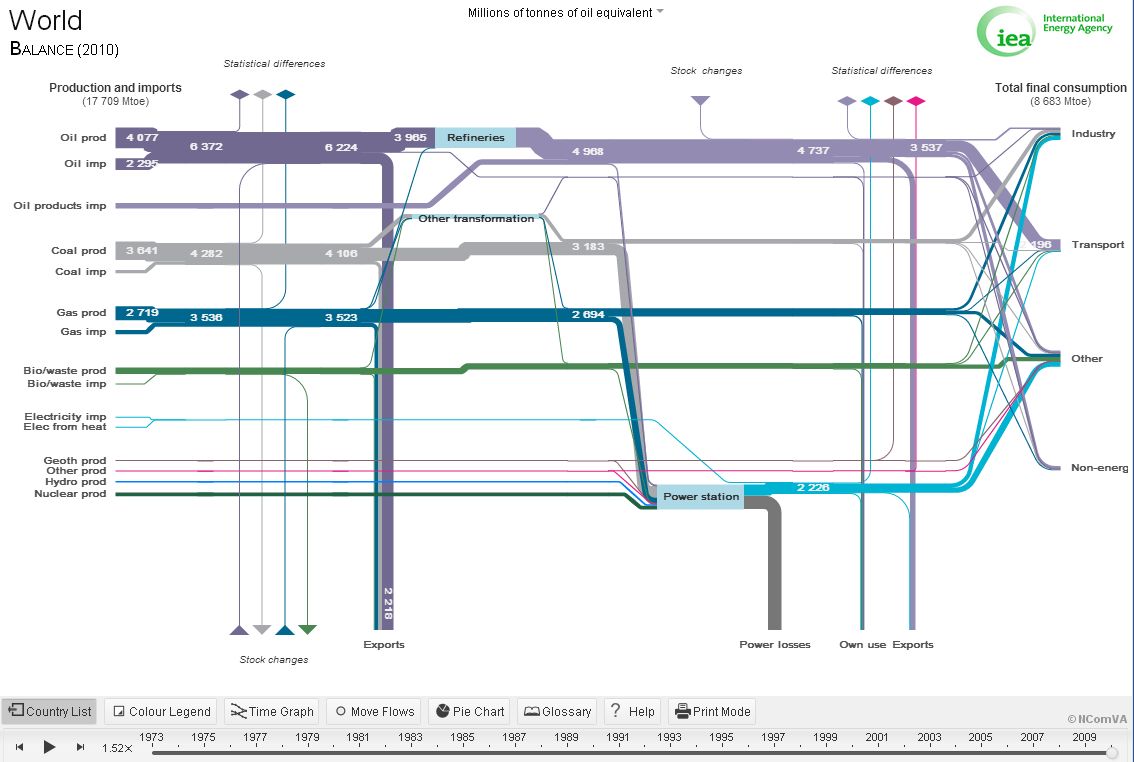
Sankey Diagram showing world energy flows (Click for larger view) |
As long as you understand what a Sankey Diagram is, not much more introduction is needed here. You can look at individual countries, consumption patterns as well as production, and more. Click on individual flows and graph over time.
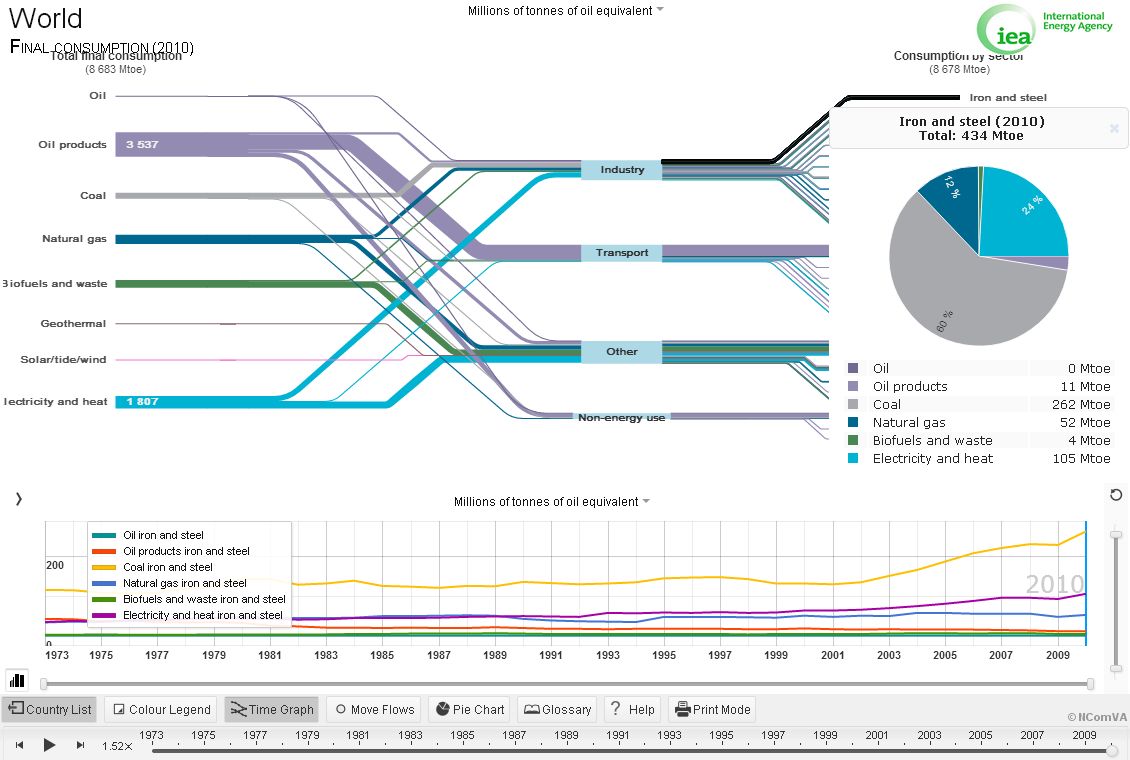
World energy use for steel production (Click for larger view) |
One curiosity, though:
The world oil imports (2295) and oil exports (2218) don't match in the top graphic. "Statistical difference"?
As with data from the BP Statistical Review series, there might be occasional quibbles with the numbers. Also, I've seen prettier Sankeys. But if you've been wondering what to do with all of your time after The Oil Drum goes on hiatus, there you go.
Contact
- Content: editors at theoildrum dot com
- Tech support: support at theoildrum dot com
License

This work is licensed under a Creative Commons Attribution-Share Alike 3.0 United States License.
Very interesting - I had no idea.
Did they stop updating this in 2010?
TE
It would be interesting to see Mtoe of energy input divided by Mt of product. We could then compare energy intensities for steel, glass, aluminum, cement and so on. That is more energy per unit of product is a concern. For corn ethanol the energy inputs would include farm tractor diesel and natural gas derived fertiliser.
Some have argued the recent drop in the price of polycrystalline silicon panels is because the Chinese burned a lot of coal and other nasties to make them without any pollution restrictions. A Sankey diagram could show this. That would then underscore the difficulty of wind and solar creating the materials needed for their own replacement.
I agree. It certainly is interesting the explosion of interesting interactive web-based graphics in the past few years. I have been adding more of these type of interactive charts to my ContextEarth.com site, and have links to other interesting interactive sites such as climate explorer and moyhu.
--
As far as the discrepancy, once the oil is defined as a liquid fuel, it can get accounted differently. For example, a coal export goes through a CTL process and then becomes an oil import. Then imports are higher than exports. Possible?
Such a miracle would be as nothing to the green eyeshade and sleeve garters guys at govt. agencies, lol.
Personally, I think that coal to liquids technology will be adopted on a very large scale within the next decade or two, considering that conventional oil production seems likely to remain stalled while the need for liquid fuel grows.
This observation is contingent on the economy hanging in there long enough for the conversion plants to be built of course.
Have you modeled the price points that will need to be reached for coal to liquids to become profitable?
Does anybody here know of a simple and preferably free way to add contrast and brighter colors to such diagrams?
I'm having a hard time reading this sort of stuff these days.
People pack as much info into one chart theses days as used be in a couple of dozen.
I'm inclined to think they have young eyes and high end equipment and assume that everyone else does too.
CTL is doing okay.
Sasol profit to rise
Petrol price inland 95 octane unleaded is R13.50/L = $5.11/US gal.
Of this the actual cost of the fuel is 53.1%. The rest goes to tax (27.9%), wholesale margin (7%), retail margin (8.4%), transport and delivery (3.6%). The price is set by the government on the first Tuesday of every month depending on exchange rates, price of oil, etc.
Sasol as I understand it was built primarily because South Africa couldn't buy oil in international markets at that time.
I don't know of any ctl plants being built now, although there may be some someplace. The fact that Sasol is profitable at current coal and oil prices is comforting in that it indicates we can for sure have enough synthetic gasoline and diesel to keep most of the wheels of commerce turning for quite a while in the face of declining oil supplies.
That said, it is scary as hell that we will very likely build such plants if it becomes profitable to do so. We humans are extraordinarily good at making bad long term decisions by default .
If it feels good today, we're probably going to do it, no matter the what the consequences may be consequences tomorrow, next year, or next century.
If i were a young man, I would move a long way north- well into Canada.
"the rand’s 14 percent decline against the dollar this year boosted earnings, it said."
Such increases in so called profits are in the end no more than smoke and mirrors.
It's s true that Sasol's books show this profit, and Sasol stockholders can spend it, in South Africa ,if they are quick enough.
But when a currency declines, imports become more expensive proportionally, and all South Africans share in the pain of increased costs of various imports, whereas only Sasol's owners , and perhaps to a small extent Sasol employees, get a share of these artificial profits.
CTL has been proposed in the US - it would very profitable. Fortunately, it was strongly discouraged by the current Pres administration due to very high CO2 emissions.
The discouragement didn't have to be real loud - CTL plants are very large, very capex intensive, and risky if there's any uncertainty about carbon taxes, etc. So, all the administration had to do was make it very clear that there would be no subsidies or official encouragement of any kind. That killed it.
Who says there is a lack of articles on the oildrum?
It seems the announcement of closing down TOD has motivated many to write more articles as has happened in the last weeks.
So just announce every 2 months or so that TOD will close down and the articles will come streaming in
It's fun looking at a country like Germany or Japan and using the bottom slider to see how renewables are kicking in. It's a pity the diagrams only go to 2009. The most dramatic changes will come after that.
EDIT: Want to see something scary? Go to the Sankey diagram for Saudi Arabia and use the slider. See how dramatically exports dropped in the 1980s with the tanker wars. What chance of history repeating itself?
They say history doesn't repeat, it rhymes.
Men in camo, saying "Hoo-ah",
Generally presage a fubar.
Any recommendations for English language sources for any country or on a world wide basis for energy usage by end use--I don't mean the general categories of residential, commercial, industrial, transportation but much more specific--space heating, running electric motors, lighting...
Thanks.
IEA tweets "Yay - Oil Drum blog describes new @IEA Sankey diagrams as an "invaluable resource" http://bit.ly/1fTH9vw
Maybe they'll tweet me some payola.
I retweeted your sentence "The International Energy Agency has taken its share of abuse from The Oil Drum over the years for its rather optimistic forecasts." which they had omitted
:)