| Live Until August 31st, Oil Drum Successors Discussion, and User Profiles | The Oil Drum | British Geological Survey Bowland Shale Gas Assessment |
World Oil and Gas Production Forecasts Up to 2100
Posted by Luis de Sousa on July 16, 2013 - 7:35am
With the recent announcement of closure, this will be the last guest post by Jean Lahérrere at TheOilDrum. By fortune it is an update on Jean's famous long term petroleum and natural gas forecasts; may it serve also as a long term reference to all the readership.
Together with the likes of Colin Campbell or Walter Younquist, Jean is a part of a very strict group of researchers that managed to re-emerge Peak Oil in the late 1990s and early 2000s. Some of his graphs are worth a thousand reports, and have shown remarkable accuracy and longevity.
I started working with Jean, formating and translating content for TheOilDrum, exactly 6 years ago. All I can say is that I feel very fortunate for having such insight into his work and only regret not having had the time to commit more to it.
Hereafter you can continue following Jean's work at ASPOFrance.org.
Introduction
The modelling methodology is the same as in my previous analyses, which started 20 years ago, namely the use of a multi-cycle logistic curve (and its derivatives) to extrapolate the future. The ultimate reserves are those extrapolated from the creaming curve. In a creaming curve, the cumulative backdated 2P reserves (proved plus probable, with the mean value assumed) is plotted versus the cumulative number of discovered fields (or of the new field wildcats). The reserves in the creaming curve incorporate all past revisions and reserve hikes, attributed to the year of original discovery. Very few countries report production and reserves by field: the UK (DECC), Norway (NPD) and the US for the Federal offshore. Therefore, one has to rely on expensive scouting and scout databases, which are not available to the general public. But even then, the scout databases need to be corrected to estimate the actual “2P” reserves.
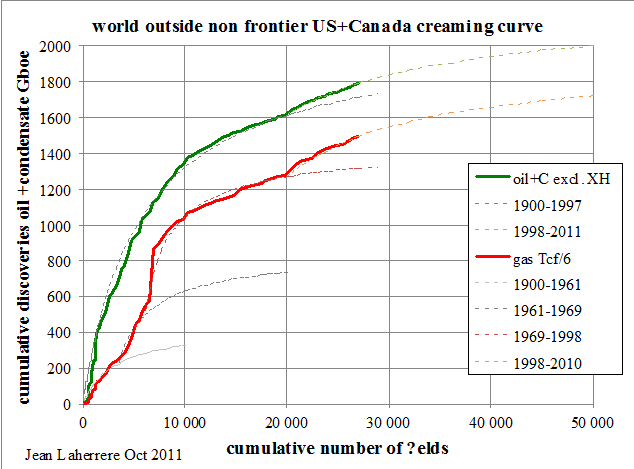
Based on the creaming curve in Figure 1, the ultimate reserves for the world outside the conventional onshore of the US and Canada are about 2000 Gb for crude less extra-heavy (XH) oil, and 1700 Gboe for natural gas. This plot of backdated reserves versus the cumulative number of fields cannot be extended to the onshore US and Canada because there are too many fields with unavailable data and different definitions. However, if one adds the backdated 2P discoveries for the conventional US onshore (thanks to US-DOE data) and for Canada (thanks to CAPP backdated data) to the previous data, the cumulative world discovery versus time converges to an oil ultimate of 2200 Gb and a gas ultimate of 2000 Gboe. This last figure equals 12 Pcf, but this round estimate from 2012 is now estimated in 2013 at 13 Pcf (see Figure 15).

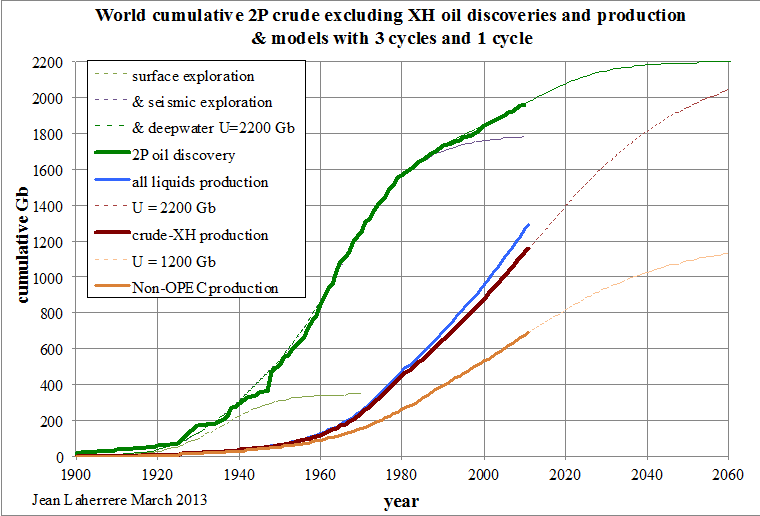
The three cycles, which can be observed in Figure 2, are well-known in exploration:
- the first one is the surface exploration based on seeps and on surface anticlines, from 1900 to 1945;
- the second one is based on seismic surveys showing buried anticlines, from 1945 to 1990;
- the last one is the exploration of deep-water and sub-salt reservoirs, from 1990 to 2011.
Oil production, in particular from OPEC countries, is badly reported because their fight on quotas prevents them to clearly disclose reserves and production data. Sadly, monthly OPEC oil reports rely on secondary sources, often quite different from data directly communicated by OPEC members.
The US-DOE/EIA reports total oil supply as the sum of crude, condensate and natural gas plants liquids (NGPL). The plots of these data start flattening in 2005, followed by a bumpy plateau. The post-2010 increase is mainly caused by the increase of liquids from US shale gas and US shale oil.

It is frightening to see the large discrepancy between the values of the so called “oil supply” from different sources and also its evolution with time.
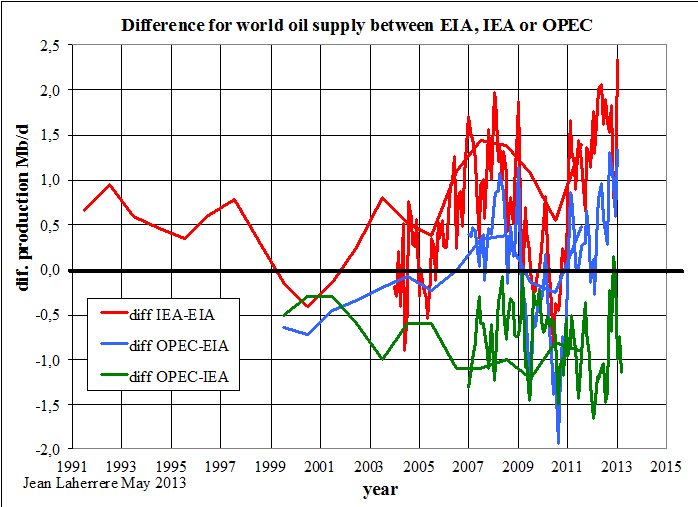
One can note that big changes occur at the beginning of the year when definition changes take place.
Remaining world oil reserves
The data on proved reserves publicly available are either political (issued by OPEC without audit) or financial - all majors listed in the US stock market must follow the Securities and Exchange Commission (SEC) rules with an audit. The confidential technical data on 2P (mean values) is only available from expensive and very large scout databases.

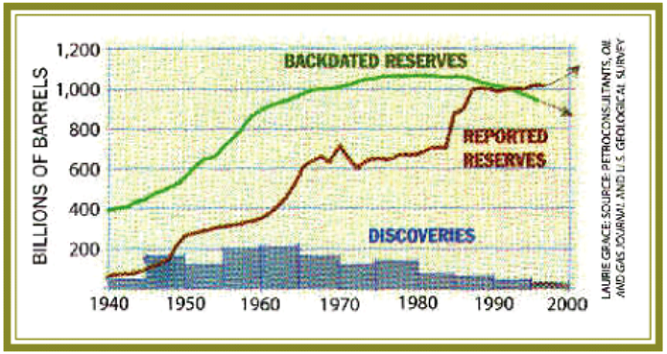
There is a huge difference between the political/financial proved reserves in brown, which has always increased since 1947, and the confidential technical 2P reserves in green, which has been decreasing since 1980. This graph explains why most economists do not believe in peak oil. They rely only on the proved reserves coming from OGJ, EIA, BP and OPEC data, which are wrong; they have no access to the confidential technical data. Economists ignoring peak oil do not think wrong, they thing on wrong data!
The graph below, from the article “The end of cheap oil” by Campbell & Laherrere published in March of 1998 in Scientific American is confirmed today. At the time, we expected the green curve to go down and the brown curve to go up, but we did not expect the latter to move so high (plus 600 Gb) after a long plateau!
The following graph displays the same data as Figure 5, but now as annual discoveries for 2P and 1P, compared to annual production (crude oil + condensate and crude + NGPL). Annual production has exceeded 2P annual discoveries since 1980, but not 1P annual additions.
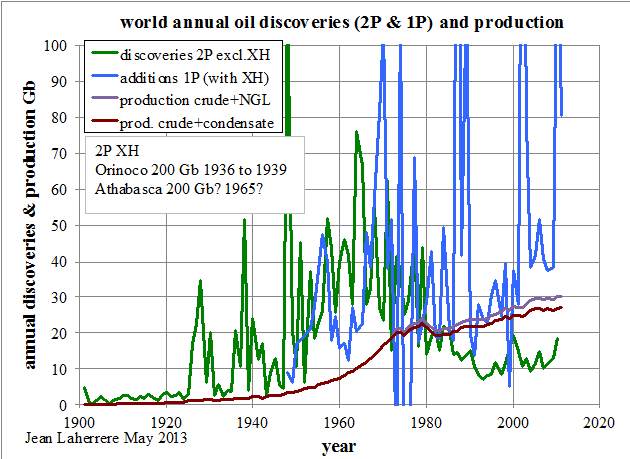
The same graph for natural gas annual discoveries and production shows that 2P discoveries are larger than production up to 2000.
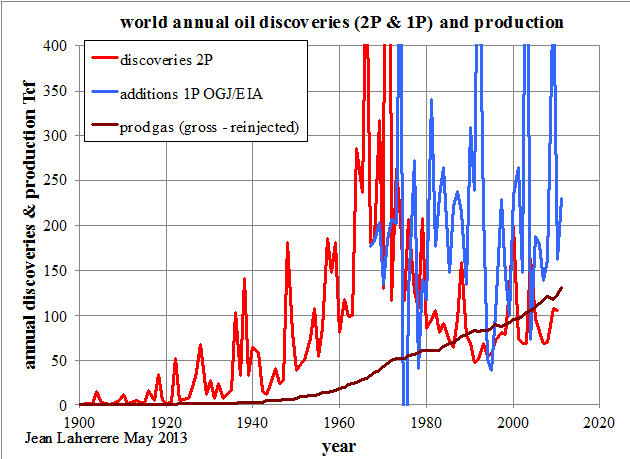
Economists rely on the 1P additions by the EIA to believe, even before the shale boom, that there is no problem, because additions to proved oil and gas reserves are twice the production. In reality annual 2P oil discoveries are about half the production!
Estimates for ultimate oil and gas reserves
One can only plot the cumulative (backdated mean) discovery over time, which suggests that the world ultimate for crude less extra-heavy oil is at 2200 Gb.
Crude oil + NGL
Annual production of conventional crude, extra-heavy oil and NGPL is plotted for the world, OPEC and non-OPEC.

OPEC crude less extra-heavy oil production will overpass non-OPEC around 2030.
For unconventional oil, despite the sharp increase in the US (mainly light tight oil, the new name for shale oil), the rest of the world may face many above ground constraints. So, world ultimate unconventional oil reserves may be lower and be well within the accuracy range of total world crude oil. Thus it may not change much the long term production, but I could be wrong.
All liquids
The breakdown of all liquids production is given for OPEC and Non-OPEC.
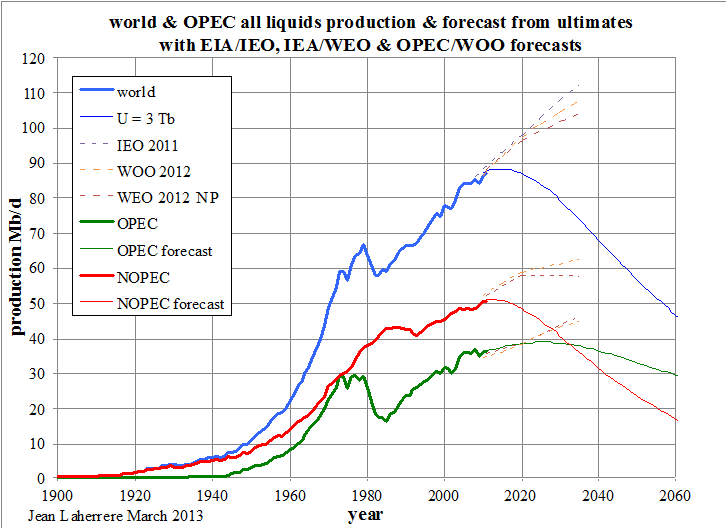
All liquids from OPEC will overpass Non-OPEC around 2030 in my interpretation, when the 2012 WEO NP puts it around 2050. The last IEA forecasts report an increase in oil production from 2012 to 2018 of 8% for Non-OPEC (+30% for the US) and of 7% for OPEC, which is doubtful in my opinion.
World and OPEC crude less extra-heavy oil production, petroleum consumption and exports are plotted and extrapolated until 2050. OPEC consumption (thin blue) is extrapolated using the UN population forecast: it will cross OPEC crude oil production (thin green) around 2045. Exports from OPEC (thin brown) are plateauing and will decline to zero before 2050, unless their heavily subsidised consumption is reduced like it was in industrialised countries.
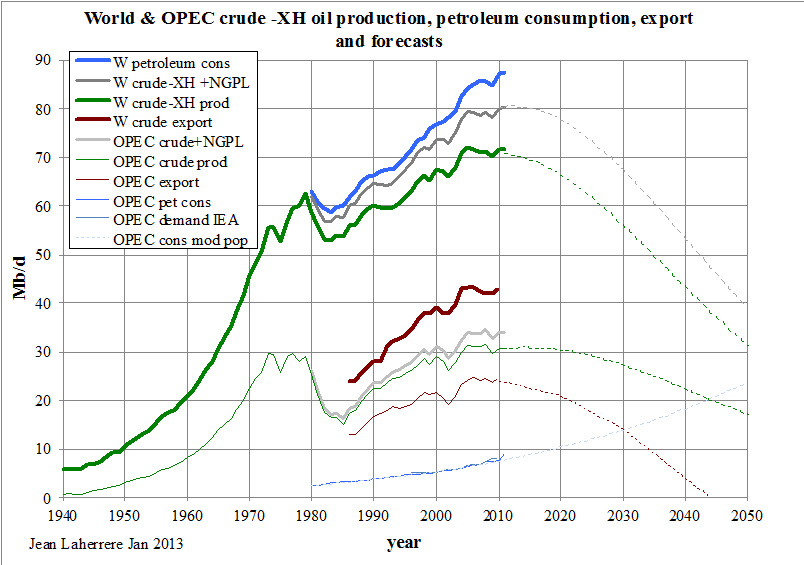
When oil exports cease, somewhere before 2050, OPEC will no longer act as a producer cartel.
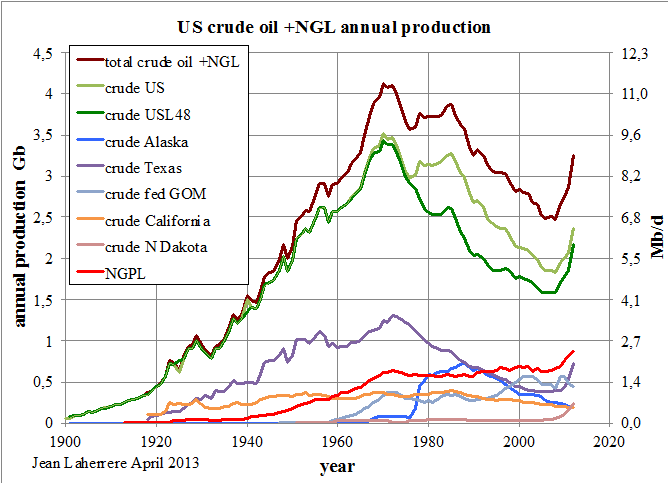
The US exception
The US is an exception in the world because oil in the ground belongs to the landowner, while in the rest of the world it belongs to the State. It is why there are over 20 000 oil companies and thousands of oil service companies in the US and only one in Saudi Arabia. The US production excluding Alaska displays a symmetrical curve with a peak in 1970, as forecast by King Hubbert in 1956.
The number of rigs in the US peaked in 1980 when the second oil shock coincided with the end of price controls, triggering a drilling frenzy. Even the worst prospects were drilled, resulting in many dry wells and a sharp decline at the 1986 oil counter shock, staying low until the late 1990s.
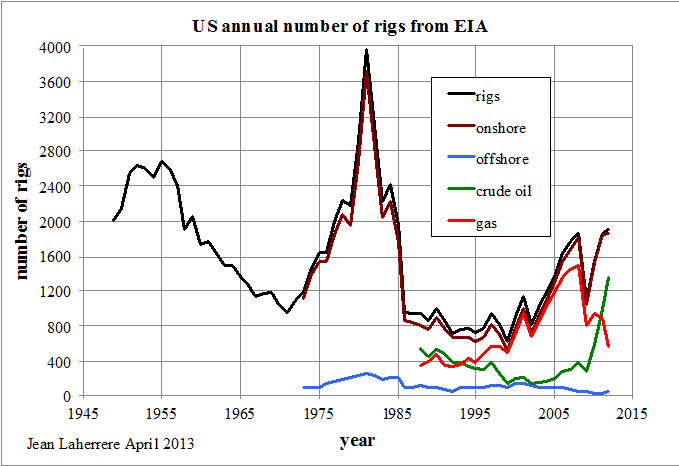
Drilling activity in the US is cyclical, peaking in 1955, 1980 and probably now. The "drill baby drill" practice is due to the shale oil boom, itself caused by the high oil price and the easy money flows provided by the eased monetary policy. Today US explorers are complaining about the lack of conventional prospects and, moreover, of unconventional gas prospects, since the number of sweet spots in shales seem decreasing.
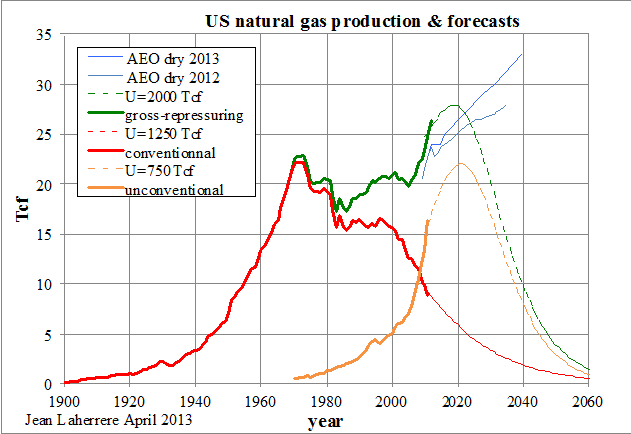
Natural gas production in the US, which peaked in 1970 like oil, is showing a sharp increase since 2005 because of shale gas. In 2011 unconventional gas production (CBM, tight gas and shale gas, in orange in Figure 15) was higher than conventional gas production (in red). The ultimate for conventional natural gas seems to be 1250 Tcf and the unconventional ultimate was estimated at 750 Tcf, summing to a round total of 2000 Tcf. The USDOE reports shale gas ultimate reserves at 482 Tcf and only 273 Tcf for proved reserves.
This 2000 Tcf (2 Pcf) leads to a peak in 2020 at 22 Tcf and the decline thereafter of all natural gas in the US (in green) should be quite sharp. The goal of exporting US liquefied natural gas seems to be based on very optimistic views, as those shown in the 2013 AEO, where US production is forecast to be 33 Tcf in 2040, against 10 Tcf in my forecast!
The gross monthly natural gas production in the US has been flat since October of 2011, after its sharp increase since 2003, with only shale gas production rising.
Some claim that the US can export its shale gas as LNG even though conventional gas (in red) is declining fast and will be quite small in just a few years.
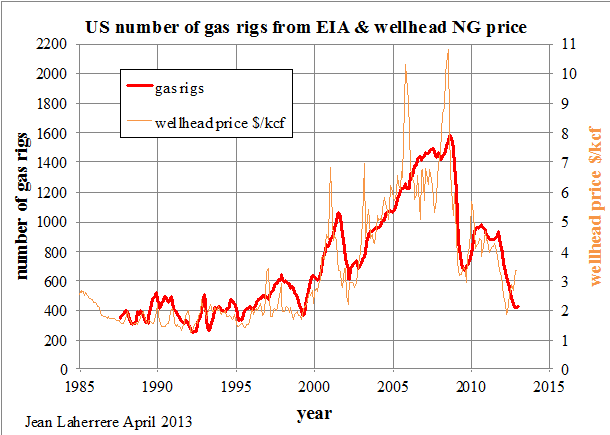
There is an amazing fit between the monthly number of rigs in the US and the monthly well head natural gas price from 1987 to 2013 (the period of available monthly data).
The ratio between oil and natural gas prices in the US has varied widely since 1950. Starting at 7 (meaning that oil was 7 times more expensive per unit of energy at the well head than natural gas) down to 1 between 2000 and 2005 (the normal), up again to a peak at more than 9 in May of 2012 and down again to 4.5 in December of 2012. The ratio varies roughly as the percentage of US gas flared (versus marketed production), and since 1995 as the percentage of gas flared in North Dakota. The lack of gas pipelines creates a glut with low prices and flared gas. This situation with cheap natural gas is unsustainable and has led to lower coal prices and to the expectation of LNG exports.

World, Non-OPEC & OPEC natural gas production forecasts
Annual natural gas production is modelled on the basis of ultimate reserves: 13 Pcf for the World, 7 Pcf for Non-OPEC (NOPEC) and 6 Pcf for OPEC.
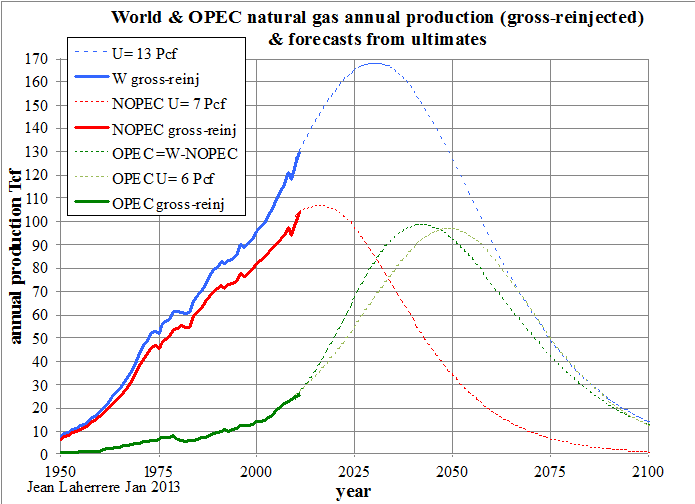
With the estimate of 7 Pcf for Non-OPEC ultimate reserves, production will peak around 2020 at more than 100 Tcf/y. Unless new reserves become available, only an intensive drilling program could delay this peak, but at the expense of a sharper decline. Gas production from OPEC will peak around 2050 also at about 100 Tcf/y.
Outside the US, the potential of shale gas is very uncertain because the "Not In My Back Yard" effect is much stronger when the gas belongs to the country and not to the landowners. Unless the mining legislation is changed, the potential of shale gas is weak, with the largest unknown being China. Suffice to say that up to now, there is no example of economical shale gas production outside the US. The hype on shale gas will probably fall like the hype on bio-fuels a few years ago.
Natural Gas Plant Liquids (NGPL)
These liquids summed up to 9 Mb/d in 2012, but with a 36% lower heat content than crude oil. In 2012, the heat content of oil was 5.8 MBtu/b and 3.7 MBtu/b for US NGPL (versus 3,9 MBtu/b in 1980).
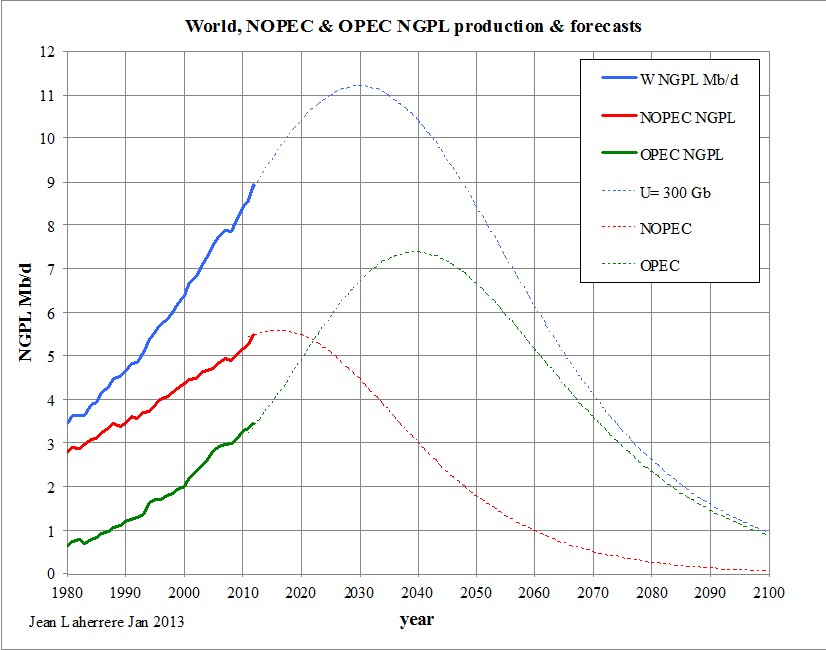
World NGPL production (in blue) may peak in 2030 at over 11 Mb/d, whereas Non-OPEC (in red) will peak before 2020 at 5.5 Mb/d; OPEC (in green) should peak around 2040 at 7.5 Mb/d.
Oil forecasts from different ASPO authors
For a long time Colin Campbell has published (also in an Atlas) oil and gas forecasts up to 2030, more recently updated up to 2050. His forecasts for oil plus NGPL is compared to mine and to Pierre-René Bauquis (PRB), along with past liquids production data. The discrepancy between the different sources for the 2010 data is 3 Mb/d (Figure 4), about the same between these three authors, despite all three being among the founders of ASPO. For 2020 this discrepancy rises to 10 Mb/d and for 2040 it becomes quite large, with production ranging from 50 Mb/d to 100 Mb/d!
The uncertainty is high on past oil production and much higher on future oil production.

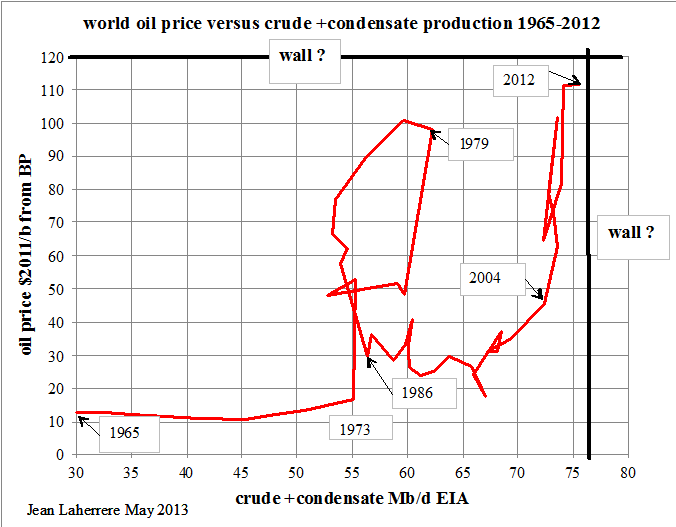
Walls on oil price and on crude oil production
The plot of oil prices in 2011 dollars versus crude oil plus condensate based on BP data seems to have two "walls": one at 120 $/b for the price and another one at 76 Mb/d for production. However, official inflation figures and BP data are questionable. So, where should these two "walls" be exactly put? In fact extra-heavy oil should be excluded.
Peak Oil Deniers
Peak oil deniers claim that peak oil is an unscientific theory, ignoring that peak oil has actually happened in several countries like France, UK, Norway... and that there are more producing countries on decline than on the rise! Peak oil deniers claim that our estimate on world ultimate does not take into account the economy, in particular the oil price. They confuse proved reserves, which are supposed to represent the expected production with present technology and economy (with the oil price at end-year) with the 2P mean reserves, which are used to compute the Net Present Value from a forecast on oil price for the life of the production. The best proof of the quality of my estimate on remaining 2P reserves in Figure 5 in 2013 with an oil price of 100 $/b is that the values are nearly the same as in Figure 6, produced in 1998 when the oil price was at 10 $/b.
For unconventional oil (where tertiary recovery methods are used, such as steam or fracking) the problem is not the size of the “tank” but the size of the “tap”, with oil prices limiting production rates. In Figure 10 this is reflected with the peak of extra-heavy oil put around 2070.
Shale oil is now called light tight oil because the production in Bakken is not from a shale reservoir, but a sandy dolomite reservoir between two shale formations. It has huge resources when estimated simply by the amount of hydrocarbons generated by the source-rocks within the oil kitchen. In the 1994 report “Undiscovered petroleum potential” (Laherrere, Perrodon, Demaison) the efficiency factor (percentage of ultimate reserves versus hydro-carbons generated from source-rocks in the kitchen) was estimated as being very low:
- 1.4 % in the Arab-Iranian Petroleum System (most of the Middle East);
- 1% in the North Sea
- 0.8 % in the Saharan Triassic
- 0.6% in the Niger Delta
- 0.4 % in Gippsland
- 0.3 % in Kutei & Putamayo
- 0.03 % in the Paris Basin.
Most of the oil generated is either lost, diffused in the sediments or still within the source-rocks among the fractures. Huge volumes of hydro-carbons still exist in source-rocks, but the recovery factor should be quite low: a few % at best!
In Montana, production from Bakken is mainly coming from the stratigraphic field called Elm Coulee, which is decline since 2008. In North Dakota, production from Bakken has sharply increased from 50 kb/d in 2008 to 715 kb/d in March of 2013, but it may be close to peak by lack of further sweat spots to drill. Another reason to expect a peak in North Dakota still this year is the decline of rigs in activity, from a peak of 200 in June of 2012 to 176 in April of 2013.
Increase in fuel prices: price of oil or one litre of diesel in France compared to the minimum wage
For many Frenchmen, diesel fuel (what 80% of French cars consume) is today very expensive. But they forget that in 1960 25 minutes of work at the SMIC (minimum wage) rate were necessary to buy one litre of diesel, when only 9 minutes were needed in 2012 (but 6 minutes in 1991).

The display for the number of hours needed to buy one barrel of oil with the SMIC wage is quite different because of French taxes. In 1960 6 hours were needed, in 1980 11 hours and in 2012 over 9 hours.
Conclusions
Oil and gas production data are unreliable and the UN should oblige every country to publish true, updated and complete data on energy. This is especially important for fossils fuels, which are a gift to humanity, alas, sadly soon to be reduced because of energy supply constraints. In the US SEC rules should be changed in order to report mean (2P) reserves instead of proved reserves.
The present study is based on ultimate reserves, mostly estimated from the extrapolation of discovery data coming from scout databases. Only three countries report reliable field data: UK, Norway and the Federal US. If most other countries were to follow their example, such study would be much more reliable. It is a shame that the need of reliable data is not understood in New York at the United Nations or in Brussels at the European Commission.
With the poor data available today, it seems that world oil (all liquids) production will peak before 2020, Non-OPEC quite soon and OPEC around 2020. OPEC will cease to export crude oil before 2050. Present subsidies to gasoline prices in Venezuela and Iran (one hundred times less expensive than in Turkey) are unsustainable and lead to high consumption in detriment of exports. OPEC production of NGPL will overpass Non-OPEC production around 2025. For crude less extra-heavy oils OPEC should overtake the rest of the world around 2030; about that time the same should happen with natural gas. The dream of the US becoming independent seems to be based on resources, but not on reserves.
Of course the present study is based on questionable assumptions and unreliable data, but anyone can look at the graphs and make his own interpretation or challenge the data. Again, alas, I do not know any free study showing as much as this paper.
Acknowledgements
Thanks to Jean-Marie Bourdaire for his comments and for correcting my Broken English.
There is a longer version of this paper, written in February, and a shortened version writen in May, both can be found at aspofrance.org.
Contact
- Content: editors at theoildrum dot com
- Tech support: support at theoildrum dot com
License

This work is licensed under a Creative Commons Attribution-Share Alike 3.0 United States License.
So basically for my Children's Children it is Oh S***.
We will end up burning whatever we can, what a mess we will make of the world.
thats what carbon sequestration is there for.
CCS will never happen on a large scale, 30 or 40% loss in efficiency, so that much more ressources needed to run it, carbon sequestration is green washing in its most atrocious form.
Agreed. CCS just means you have to extract resources and feed the beast of industrialism that much faster, which are exactly the problems we have to address today.
It's like the Fed's economic policy of solving a debt crisis with even more debt - the situation will not end well.
That is only true in post-combustion carbon capture from conventional coal fired power generation. Carbon capture from gasification processes used in synthetic fuel, chemical, or fertilizer production are radically more efficient. The primary energy penalty is just in the form of compressing the captures CO2 from a gaseous state into a liquid for injection into storage. The efficiency and cost hits are less than 10%. Add to that that gasification is inherently more efficient than conventional PC coal power generation, and the effects offset at least in an eneryg perspective (plant CAPEX is higher for a gasification facility).
Of course, where it gets REALLY interesting is when you build one of these facilities, and then start feeding it biomass instead of coal (effectively sourcing that CO2 from the air, as opposed to from the ground). The carbon lifecycle math becomes compelling fast. It's our only economically viable path to lifecycle carbon neutral or negative fuel manufacturing given present technology.
How would synthetic fuel from gasification compare to ethanol?
What's the cost of returning ash to the source, to maintain soil fertility?
I would worry about scalability. I'd prefer synthesis from seawater (for both carbon and hydrogen), using renewable power. That would be a bit more expensive than current FF (maybe $6-7/gallon, with scale and maturity), but it would work just fine for about 10% of our current needs - more than enough for aviation, long distance shipping, seasonal ag, etc.
But, but, the world is awash in oil!
Case in point!
Hey if nothing else, with all that plant food think how happy all the plant's will be /sarc.
Lets see if I have learned anything in My 4 years here at The Oil Drum before it goes away.
All that really matters is the ability to get the oil out of the ground. Reserve and especially resource numbers are just meaningless numbers if you can't get it out of the ground.
With all the constantly increasing reserve and resource numbers, oil prices should be going down, but they are not, proving they don't really matter.
Steve Ludlum's Triangle of Doom comes to mind. While I expect that the cost of producing a barrel of oil will remain high, I have reasonably low confidence that economies will be able to afford that price. Economics will trump geology in this respect. No CAPEX, no oil. Of course, the defacto oil addiction will surely result in economies continuing to rob Peter to pay Paul the Oil Man, for a while anyway...
Overlaying price onto Fig. 3 would be useful.
Hi Ghung,
I agree that a price overlay would be useful. I also think adjusting NGL and other liquids to BOE (barrels of oil equivalent) would show that all liquids has been rising less in energy terms than volume measures would indicate. For NGL each barrel is only about 70 % of the energy in a barrel of crude so 10 million barrels per day (MMb/d) of NGL is equivalent to 7 MMb/d of crude. Biofuels also have lower heat content (57 % of crude for ethanol and 88 % for biodiesel) and each of these components should be taken into account by converting to barrels of oil equivalent (boe).
In many ways the use of millions of tonnes of oil equivalent rather than barrels takes care of many of these problems because the energy content of crude and other liquid fuels is roughly proportional to their density (heavier products tend to have more energy per barrel).
Mr Laherrere's work will has inspired me to finish work I had started on world liquids scenarios.
For light tight oil the USGS recently doubled its estimate for technically recoverable reserves from the Bakken/Three Forks. If we assume a further review of all US light tight oil also results in a doubling of the mean estimate this would bring the mean US estimate for LTO TRR to about 20 BBO (billions of barrels of oil aka Gb). This is 9 months of current world crude output. If we are optimistic and assume the F5 USGS estimates are closer to reality then we might see 29 cumulative BBO of LTO from the US or about 13 months of current crude output.
DC
With all the shale oil and gas in Russia and China, energy is no longer a problem. Sooting the skies on the other hand...
Graphs 10 and 12 say so much.
Last night on BBC News they toured California fields with the exclamation we have so much oil left it is unbelieveable, and that we won't be running out anytime soon. My mouth hung open because he was describing Peak as if it was a 'don't worry' scenario. It is unfolding as predicted, higher prices produce production from expensive sources, all paid for in the market. Nothing to worry about, right?
As asked above, where is the upcoming 'wall'? Plus, how many walls do we hit before MM picks up on the trend and implications?
Thank you for this extensive work.
Paulo
Your description of that BBC video sounds similar to that presented in the lead story from yesterday's Drumbeat, The receding threat from 'peak oil' . In that story, the author totally misinterprets the recent report in EOS (which is actually a good presentation of recent TOD thinking), claiming:
.
It would appear that the author didn't read the full report, perhaps looking only at the first two paragraphs...
E. Swanson
The mainstream media will pick up on the trend and its implications when someone pays them more than the oil companies to report it.
But graphs 10 and 12 are the old, tired "the peak is today" type plots that I have laughed at on this site for the past 5 years. These are the WORST graphs in this presentation. The rest of the presentation is very good. Chicken-little comes to mind here, the flaw of this site is that it has called peak so many times that when we do reach peak, and we most certainly will, nobody will believe it...
Please provide links to where this site has called peak oil without any caveats?
Sadly, caveats aren't really helpful. A model is only useful if it can provide specific, falsifiable forecasts.
I have mixed feelings about this site going away. It's been nice to visit every few months and see the latest production stats. However, the relentless chicken little predictions are horribly non scientific and extremely tiring.
Most posts (like this one) have been very good. There are a few contributors who ended most of their articles with suggestions of doomsday right around the corner. 2005 was supposedly the peak. A lot of you need to apologize for calling dissenters trolls. You know who you are.
I'll say this one last time... the supply curve rolling over DOES NOT PROVE peak oil has arrived. If you don't agree with that, think about this. If you owned a twinkie factory, would you produce a billion units per day if you only sold 1 million? Of course not. You match supply to demand.
It may not be possible to predict peak oil even 10 years after the fact. Producers will not turn the spigots on full blast all at once just to prove your theory.
It may never be possible to "call" peak oil.
Take mercury: it's consumption peaked, due to it's toxicity. We don't call that peak mercury, because it was a decline in demand.
Well, we've discovered that oil produces a toxic byproduct in the form of CO2. With luck, demand will fall fairly quickly.
Go Tesla! Go Volt! Go....Leaf!
If you walk around outside you’ll see birds chirping, trees whispering, kids laughing, people driving around pretty much like normal. It looks just like it did in the 1960’s, except we have nicer looking cars and TV’s now, and the smog is better. What’s so different about today that provokes Chicken Littles like me to scream that the world is about to end?
The answer to this is that our entire financial system, and its history going back at least 100 years, has been predicated on, and driven by, perpetual economic growth. That is what provides value to money. Money is essentially created out of future debt going out all the way to the 30 year Treasury Bond. People historically bought those bonds because they were reasonably confident that the economy would grow at a rate roughly equal to the bond coupon, FOR THE NEXT 30 YEARS. This is what greased the wheels and provided investment incentives for all of the industries and parts of the economy providing jobs for workers. In the 1960’s, money worked, because the economy could grow.
But in 1970 the US hit Peak Oil. As a result, its economy should have begun declining because it couldn’t grow anymore. But it didn’t decline, at least to the degree one would have expected. Why not? Because there was a fundamental change to the monetary system. In 1971, the US defaulted on its gold convertibility and the dollar became a fully debt backed fiat currency. Those systems are dependent on perpetual exponential growth and they invariably, 100% of the time, blow up in hyperinflation. How did the US avoid that catastrophe? It (militarily) enforced the dollar as the world’s reserve currency, that’s how, which extended the US empire around the world and forced other countries to sell their resources (oil and manufactured gizmos) to the US in exchange for pieces of paper. That was a fundamental system change in 1971.
This only worked for a while, until what happens with all debt backed fiat currencies happened – runaway inflation. In order to keep the bond vigilantes at bay and prevent a runaway monetary collapse, in 1982 the Fed increased interest rates to about 20%. This “destroyed” the economy, but it didn’t really, because the alternative was hyperinflation which would have destroyed it as well. Back then, the economy could weather those high interest rates without completely collapsing because it wasn’t over-leveraged. And more importantly, the US still retained the world’s reserve currency, so it could run a perpetual trade deficit and CONTINUE GROWING – using other countries’ resources, who hadn’t yet hit Peak.
This 1982 shift in interest rates was another fundamental system change. Since then we have had no system change, we’ve had 30 years of the same ol’. Over this period, interest rates have gradually and steadily declined to basically nothing today as the hollowing-out US economy increasingly depended on credit money and consumerism, and its overseas military enforcing the trade deficit, to maintain GDP growth. Along with this, systemic leverage has increased – they all go hand in hand.
Now, essentially, the whole world is at Peak Everything, and it can no longer grow. Correspondingly, the monetary system is ceasing to function. We are now looking at another imminent system change. Interest rates cannot go any lower, government debt is spiralling out of control, and the financial system is insolvent. Over the last few years, real buyers of US Treasuries have been declining to the point that the Federal Reserve is now openly buying about 75% of them I believe – this is direct monetization of debt, and it’s increasing exponentially. Why would anyone buy a 10 year bond returning 1.5% when the increase in money supply from Fed monetization results in a real inflation rate several times that? There is now no “productive” monetary asset left that can provide a positive real rate of return, absent central bank manipulation of markets. Not stocks, bonds, or even cash, because deflation is being held at bay by QE. Because the economy can’t grow anymore! We’re at Peak Oil. Duh!
There is absolutely no way interest rates could rise to 5-7% without totally destroying the current financial and monetary systems; there is just too much astronomical debt in the system and hundreds of trillions of $ of interest rate derivatives. The only way we could return to a 7% interest rate environment would be if the current monetary system collapsed and we got a new one flushed clean of debt – in other words, all the savers out there would lose their savings, because on the other end of every dollar or bond saved is a debt that cannot be honoured. To all the baby-boomer nest-eggers out there expecting to retire on their stocks and bonds – I’m sorry to report to you that it will not happen. You have been duped into yet more ponzi scheme RRSP’s (in Canada) or 401K’s (in the US). You are going to lose your life savings. Any residential real estate you own will get hammered, because we all know what happens to real estate when rates rise… The economy cannot possibly grow to provide value to your (debt-based) investments that you believe represent real wealth.
Anyone who casually looks out the window and concludes that what is going in society now resembles anything close to historical norms is in for a big surprise. Look what’s happening to the gold market – the privately-owned Federal Reserve seems to be about done selling off the American citizens’ sovereign gold, as China, India, and pretty much every other country besides N America and Europe is voraciously buying it up at these ridiculously low manipulated prices designed to provide one last desperate gasp for the US dollar. Once the gold is gone, the dollar will be rejected in international settlements, the US will no longer be able to import ½ the oil it consumes, and it will descend into darkness. We can only hope that Bernanke and the banksters still have a shred of decency left in them to keep a small hoard of gold with which to back a new currency with – but I doubt it.
The system WILL end, and it will not end with a whimper. No statistics will be needed to determine when that transition happens. All this talk about whether total global oil production is up or down a smidgeon based on how such and such entity interprets density or energy content differences between NGL’s and crude, etc. etc -- it’s all just statistical noise. It’s good for showing how we are approaching PO and why the global economy cannot continue to grow, but it isn’t PO. When PO happens, there will be no doubt in anyone’s mind that it is here.
While it’s easy for those who understand how the system works to identify that we’re near the peak of the greatest ponzi scheme in the history of the world, it’s much more difficult to predict when it will crash. We are up against VERY powerful forces who will do whatever it takes to preserve BAU... until they can’t. It will not end until the world ends; at least “the end of the world” as we know it. Those in control will lose control when this happens, and the central banks are pulling one rabbit after another out of their hats to prevent it from crashing. But they cannot violate the laws of physics and they are running out of rabbits, and all this is doing is further inflating the ponzi scheme which will make the inevitable collapse even worse, because every year that this continues, we are consuming more and more resources away at unsustainable rates, using artificially inflated dollars – resources that could otherwise be put towards developing renewable energy, and WOULD otherwise be left in the ground and extracted at much slower rates in a normal interest rate environment – in other words, we’d be clearly beyond PO now if it weren’t for central bank manipulation of the monetary system.
And all along up until the system crashes, those who are predicting it will get ridiculed by those who don’t understand how the system works, who don’t see the fundamentals which undeniably point to an imminent “end of the world”. But when it does crash, those deniers will lose their shirts (like in 2008), and those who correctly positioned themselves will make a killing (like those shorting the stock markets in 2008).
And while it might be tempting for the Chicken Littles to do some “told ya so”ing afterwards, it will provide little satisfaction because it will be too late – the world will be on its downward spiral. And the naysayers taunting the doomers will mysteriously vanish into the woodwork… just like they always do after every ponzi scheme crashes.
The doomers WILL be vindicated, and I would hazard a guess that it will be happening fairly soon. But I am not a central banker, so I cannot predict exactly when. I hope this post goes into the Oil Drum’s archives as one of the last summaries wrapping the whole theme together, an attempt to bring the financial and energy systems together, something I wish TOD had spent more time focussing on when it was still alive. It’s given up having only covered half the story.
SAN FRANCISCO of pipeline examples from Chevron Corp.'s El Segundo refinery located deterioration to a degree comparable to the pipeline that fell short and triggered a big fire at the business's [url=http://www.onecms.net/NFL_football_jerseys.html]wholesale football jerseys[/url] Richmond center, a record launched Thursday located. Chemical Protection Board and [url=http://www.onecms.net/NFL_football_jerseys.html]Cheap NFL Jerseys[/url] The golden state Department of Occupational Security and Wellness. Chevron willingly assessed the pipelines at its El Segundo center after an Aug
.
In instance you were questioning, southwestern style is a mix of cozy colours with Western side furnishings accents. And if you live in a cold-weather city, you could lighten points up with southwestern layout motifs. -Some kind of eruptive tools are tossed from the automobile in an evident try to quit authorities.
Congress reserved concerning $3.1 thousand to remodel the watchtower in 2009. The task showed a lot more hard compared to anticipated when employees uncovered that steel braces holding up the gallery and lantern decks near the best had actually broken and required to be changed. The National forest Solution, which possesses the watchtower, had to look at an extra $1.89 thousand prior to job could possibly return to in 2012.
[/url]
Oil will be of lower quality, harder to get and cost more. Then you have the political dimension of whether you CAN get more.
You see more exporting countries using more of their product and exporting less. The world may produce 90 million barrels per day, but less will be on the open market.
India imports 70% of their oil, China is importing more each day. In 1970 the world had 200 million cars now it is over 700 million and climbing rapidly.
The squeeze is on, the peak oil debate is interesting but the availability will be the key issue. There can be lots produced in the world, but if you can not get enough at a price you can afford, then you are out of luck.
if you can not get enough at a price you can afford, then you are out of luck.
Time to buy a true dual-fuel car, like a Volt. No gas - not a big problem.
Nice to see a post from Jean before TOD closes, a small caveat : it's Laherrère, not Lahérrere (I've to check myself for the double r and the accent most of the time ;) )
And what these graphs also show, is that not only we are around peak oil right now, but also at some kind of maximum dissonance between "official information"(the dotted lines forecasts) and "objective information at best available data and methodology".
Yes in thinking how governments act and oil corporations act---if we are at peak oil they are not going to throw their hands up and yell fire everybody out of the building...they are going to quietly walk out before everyone finds out...They need to get as much money from investors as possible...that being said I don't think it is a bad investment to invest in oil companies as the price will surely rise in the near future.
"the price will surely rise in the near future."
Seems like a safe bet... but a great deal of demand is enabled by unlimited quantities of nearly free money coming from central banks. That might go on for years. But a return to typical interest rates in the 5-7% range would shut down a significant number of marginal business ventures.
Don't be surprised when oil goes back to $40/bbl some day.
When does unconventional gas become conventional gas?
I like to reference scenarios to year 2050 which is when today's kids will be middle aged and alas when baby boomer TODsters will have become depleted. From the blue curve in Figure 11 and the green curve in Figure 20 I'd get the one-liner
liquid fuels will drop from just under 90 million barrels a day in 2013 to 60 million in 2050
For some this means a happy future of cycle commuting and vegie growing for others a collapse of civilisation. At best I think it will be something in between.
Actually you have to take into account that the 'rules of the game' on the decline are different than on the way up - particularly when you consider how governments claim ownership of underground resources.
Far from an emphasis on export, the key driver becomes 'sustain and gather'. Resources are 'managed' to meet national ends, with energy using work 'gathered' to be in the national bounds of the producer. You want to do chemical production, you do it in the middle east.
Couple that with the inability of our society to retrench very easily/painlessly, and you can expect harsh outcomes from the plateauing (already here) and the decline (coming soon) and a production decline rate higher than your curve/figures would predict.
Thank you Jean for your long patience at putting these reports together. I wish the US Government did half as good a job.
The forecast for US natural gas production is scary as it is natural gas currently providing the income to purchase expensive oil. But if the 273 Tcf is the real number for US shale gas, then the US can expect to follow Greece into economic decline.
Does the projections include "Shale Oil Bonanza Reaches Australia With '$20 Trillion' Discovery"
Read more: http://www.businessinsider.com/arckaringa-basin-shale-discovery-2013-1#i...
What is the latest news?
That is a kerogen discovery...if you notice in the article that stock value only went up ten percent...if this was as feasible as they say, it would go up 50 percent...you really have to parse through the news these days to get the trough...Peak Oil News has a good article on this "discovery"
The Oil & Gas Journal article suggests that it's comparable to what's being called tight oil:
"Linc Energy Ltd., Brisbane, will seek international partners with expertise and funding to explore and develop shale oil potential in the Arckaringa basin in South Australia, where consulting engineers identified formations that have total organic carbon, permeability, porosity, and thicknesses that compare favorably to the Bakken and Eagle Ford in the US."
Or does it? Perhaps I'm mistaken, but this "Arckaringa" play (aka "Coober Pedy") might just be a sly attempt to blur and conflate two very different meanings of the term "shale oil", especially in the minds of potential investors and politicians.
One clue is that in a couple of the online promotions I have seen, there is an early mention of the word "kerogen" (perhaps with eye to legal CYA down the road?) and then there appears to be no further mention of, or reference to, kerogen in the thousands of words that follow. Instead, there is plenty of talk about tight oil, fracking, horizontal drilling, Bakken, etc. But what if this Arckaringa is not at all like Eagle Ford, but rather much more like the Green River formation which stretches across portions of Wyoming, Colorado and Utah? Both Arckaringa and Eagle Ford have been described as "shale oil", but only one of them has recently enjoyed large, widely discussed increases in oil production, and only one has played a major role in the unexpected turnaround of US oil production, as decades of constant decline have suddenly been replaced by steady annual increases over the last few years (and of course this does not refer to Arckaringa in Australia).
Could LINC Energy and partners really believe that success with such a marketing stunt is possible "under the noses" of both American and Australian regulators (SEC, etc) and also the thousands of oil industry veterans from around the world who will see these promotions? And if Arckaringa is truly not like the Green River shale formation, why even risk using the word "kerogen"? Wouldn't this be a word very likely to "spook" certain potential investors? I say that because it's fairly well known that the Green River formation was discovered over 100 years ago, yet to this day it still has not produced crude oil in true commercial volumes (only the occasional barrel or two in experimental trials and prototypes AFAIK). And a major reason for this is that formations like Green River (and possibly Arckaringa?) do not contain any crude oil! Instead they contain a thermally immature (i.e. un-cooked or under-cooked) precursor to crude oil called kerogen.
If I am wrong about this, if LINC's mention of kerogen is not at all significant, and if Arckaringa really does contain about 233 billion barrels of LIQUID crude oil which can be economically extracted, then color me stupid and please accept my sincere apologies to LINC Energy and to all others concerned.
See the Wikipedia entry on Linc Energy. They're into everything. At one time they had a little green compact car travelling around on fuel made via underground coal gasification with the spare fuel in a diesel truck following behind. Presumably the truck fuel was conventional.
Arckaringa Basin may contain a smidgin of uranium as it overlays the Precambrian basement that has some large reserves such as the Olympic Dam deposit. However it is close to a rail line.
Very interesting work. I need to have a proper read through and take a deeper look into the methodology before I make a proper comment.
What jumps out at me as immediately concerning from statistical analysis point of view is that you have a number of curves that peak immediately after the current data. This could be legitimate or it could be fitting the data to a predetermined curve based on ideology rather than data.
Like I said I need to take a closer look before any final comment either way but at this point I am healthily sceptical. If anyone has a link to Jean's methodology that would be greatly appreciated.
It's worth nothing that while the US is currently an exception in terms of its massive shale oil production there are a number of other likely candidates that may be able to produce similar results (probably on a lesser scale). I am very cautious on dismissing shale at the moment as most of us have been proven very, very wrong by shale so far (despite all the very valid concerns).
If Jean's right then this post is terrifying.
Below a link to a longer preliminary version of Jean Synthesis :
http://tribune-pic-petrolier.org/wp-content/uploads/2013/03/oilgasprodfo...
(but don't think the methodology is explained in much more details)
As to the methodology, my view on it is that it is a two steps process :
1) Estimation of URRs with "creaming curves" : based on statistical analysis of discovery data "back dated" (so the discovery added to the reserves at the time it was made, with todays estimation of its volume)
2) Hubbert curves fitted on step 1) URR estimations and historical production data.
Keep in mind that Jean's graphs do not include extra heavy oil, bitumen from tar sands in Canada and Venezuela, which means his charts underestimate the C+C that will actually be produced.
There is the possibility that a high price for oil will create a fat tail on the down-slope.
Because the current recovery of C+C (including extra heavy oil) is 1.2 Tb, modeling a URR of 2.2 Tb with Hubbert curves assumes that the peak occurs when 50% is extracted and occurred in 2008 or 2009. According to EIA data the current peak is in April 2012 which explains why his projected curves decrease steeply from the actual data. Also enhanced recovery may cause the peak to occur after more than 50% of the oil is extracted.
The "all liquids" graph does include them (extra heavy), below another version where it is clearer :
His all liquids graphs do include extra heavy, below another version where it is clearer :
http://iiscn.files.wordpress.com/2013/05/jlliquidsworld.jpg
With all due respect. Some scepticism is helpful. The 1998 report "the end of Cheap oil" J.H. Laherrer and C.J.Campbell can be found here.
http://www.dieoff.org/page140.htm
Going off that forecast we would be down to about 24 Billion bbl/d not the 27 we are doing now.
It's billion barrels per year, not day.
The chart in that paper predicted a peak around 2003, followed by a decline. Instead, what we have seen is a plateau starting around 2005. That's not too far off. What they could not have predicted back when that article was written was the easing monetary policy since 2001, which is what has enabled that plateau to be maintained. The continually dropping interest rates since 2001 (actually, since 1982) have enabled more and more difficult oil production to be funded -- activity that would not otherwise be profitable in a normal interest rate environment (as Jean states, the shale boom was "caused by the high oil price and the easy money flows provided by the eased monetary policy.")
Essentially, what has happened is that future oil production has been brought back in time, and when the low interest rates end, as they eventually and inevitably will, then oil production will tank and probably take us back down to where the curve in that paper predicted we would be.
Thanks for the explaination why. My comment was simply suggesting that there are more unknown unkown's that will likely prove this forcast to be inaccurate. Obviously oil production started at zero and will return to zero, the tricky bit is predicting when it will hit it's maximum rate.
Yes, Bernanke & Co have learnt from the 1st and 2nd oil crises, when high interest rates killed the economy
dropping interest rates since 2001 (actually, since 1982) have enabled more and more difficult oil production to be funded -- activity that would not otherwise be profitable in a normal interest rate environment
You might want to quantify that. I'll think you'll find that "tight oil" will "pencil out" even with higher interest rates. Heck, companies don't do their cost analysis using short term Fed rates - investors demand a much higher IRR.
Goodbye -- and thanks for all the abuse you gave me over the years.
Please be assured you won't be missed as you fall into the category of bad science you defended as if it were religion.
Jerome R. Corsi, Ph.D.
Senior Staff Reporter
WND.com
You're welcome http://www.theoildrum.com/node/9144
Clearly, over the last 8 years TOD has been doing something right. This post has made my day.
In my opinion, I'm not sure what makes one more delusional--being in the abiotic oil camp, or admitting that one is a staff writer for WND.com.
He's a far, far right nutball (that PhD? it's 'political science', nuff said) who has a terrible record for being fact checked as 'false' (eg he tells porkies).
Not sure if having a crazy try to badmouth you is a badge of honour - the green pen brigade are unfortunately the mosquitos at the knowledge picnic.
Wow - That site's up the with The Onion. Not as realistic or believable though.
Not nearly as funny.
The US all liquid and crude oil production chart should be updated
The latest weekly stats from the EIA
US all liquids is at 12.093 million bpd and crude oil is at 7.49 million bpd.
May 2013 North Dakota stats are 810,000 bopd.
http://nextbigfuture.com/2013/07/us-all-liquid-oil-production-over-12.html
IEA oil monthly report has oil supply at about 91.5 million bpd in Q2 2013 and oil demand projected at about 93 million bpd for Q4 2014
http://omrpublic.iea.org/
It seems to me that this data suggests a peak in aggregate global liquids production around 2015, or am I misinterpreting?
Stuart Saniford is following this monthly at his early warning blog. It's close. He is also charting all liquids and C&C separately for reasons that he explains
I posted the below graph on Stuart's blog.
I've forecast US production 2 years in advance. Anything past that is largely statistically meaningless. A Holt-Winters prediction shows US oil production is likely to hit a 23 million barrels per day roof for the next 2 years and bounce around just under that. Anything after that is wild speculation.
A bit of info on methodology below:
"Exponential smoothing in its simplest form should only be used for non-seasonal time series exhibiting a constant trend (or what is known as a stationary time series). It seems a reasonable assumption to give more weight to the more recent data values and less weight to the data values from further in the past. An intuitive set of weights is the set of weights that decrease each time by a constant ratio. Strictly speaking this implies an infinite number of past observations but in practice there will be a finite number. Such a procedure is known as exponential smoothing since the weights lie on an exponential curve.
Thus the smoothed series depends on all previous values, with the most weight given to the most recent values.
Exponential smoothing requires a large number of observations.
Exponential smoothing is not appropriate for data that has a seasonal component, cycle or trend. However, modified methods of exponential smoothing are available to deal with data containing these components.
The Holt-Winters model uses a modified form of exponential smoothing. It applies three exponential smoothing formulae to the series. Firstly, the level (or mean) is smoothed to give a local average value for the series. Secondly, the trend is smoothed and lastly each seasonal sub-series ( ie all the January values, all the February values….. for monthly data) is smoothed separately to give a seasonal estimate for each of the seasons. A combination of these three series is used to calculate the predictions output by iNZight."
https://www.google.co.nz/url?sa=t&rct=j&q=&esrc=s&source=web&cd=1&cad=rj...
?
Whoops missing a zero. Unlikely (95% confidence level) that US oil production will go over 230 million barrels in the next two years.
I assume that you are talking about monthly production? You might want to convert the graph to either barrels per day, or to annual.
The chart text refers to barrels per day, so that would be best.
Jean,
thanks for this excellent update.
However I wonder why you mentioned the huge difference of ASPO author Pierre-René Bauquis (PRB) without any comment about it.
Do you think that this forecast is also possible?
What are the main reasons for the huge long-term forecast gap?
A newbie question:
Since Wikipedia says:
"1P reserves" = proven reserves (both proved developed reserves + proved undeveloped reserves).
"2P reserves" = 1P (proven reserves) + probable reserves, hence "proved AND probable."
"3P reserves" = the sum of 2P (proven reserves + probable reserves) + possible reserves, all 3Ps "proven AND probable AND possible."
In graphs 7 and 8, 1P is larger than 2P.
But 2P = 1P + (something).
Does 2P have several definitions?
Very useful report, but given up arguing with peak oil deniers - it's a bit like the scene out of the film 'the sixth sense' where Bruce Willis only sees what he wants to see, and is actually a ghost of his former self.
Before the oildrum considered archiving off this website.. have they ever considered web SEO ? I mean a url of http://www.theoildrum.com/node/10009 isn't particularly seo friendly.. something like http://www.theoildrum.com/World-Oil-and-Gas-Production-Forecasts-Up-to-2... would be better and attract more punters to comment and respond.
I think they have been premature in not considering other options myself - I smell behind the scenes political/business pressures myself ?
Useful graphs - but any chance of giving netenergy weights to the different energy liquid forecasts ? In a world where non conventional resources are growing while conventional resources are declining just showing graphs of equivalent gross energy values like the IEA and EIA do is becoming from a social/economic point of view increasingly meaningless.
I 2nd that, as I have long called for here & elsewhere, including Stuart's blog.
Jean's excellent article shows that the Oildrum is closing prematurely.